. 2021 Oct 15;22(20):11113.
doi: 10.3390/ijms222011113.

Photophysical Properties of BADAN Revealed in the Study of GGBP Structural Transitions

Affiliations

Photophysical Properties of BADAN Revealed in the Study of GGBP Structural Transitions

Alexander V Fonin et al. Int J Mol Sci. .

Abstract

The fluorescent dye BADAN (6-bromoacetyl-2-dimetylaminonaphtalene) is widely used in various fields of life sciences, however, the photophysical properties of BADAN are not fully understood. The study of the spectral properties of BADAN attached to a number of mutant forms of GGBP, as well as changes in its spectral characteristics during structural changes in proteins, allowed to shed light on the photophysical properties of BADAN. It was shown that spectral properties of BADAN are determined by at least one non-fluorescent and two fluorescent isomers with overlapping absorbing bands. It was found that BADAN fluorescence is determined by the unsolvated "PICT" (planar intramolecular charge transfer state) and solvated "TICT" (twisted intramolecular charge transfer state) excited states. While "TICT" state can be formed both as a result of the "PICT" state solvation and as a result of light absorption by the solvated ground state of the dye. BADAN fluorescence linked to GGBP/H152C apoform is quenched by Trp 183, but this effect is inhibited by glucose intercalation. New details of the changes in the spectral characteristics of BADAN during the unfolding of the protein apo and holoforms have been obtained.

Keywords: BADAN (6-bromoacetyl-2-dimetylaminonaphtalene) spectroscopy; apo- and holo-forms of GGBP (D-glucose/D-galactose-binding protein); pathways of GGBP unfolding.


Conflict of interest statement

The authors declare no conflict of interest.

Figures

Figure 1
Figure 1
Spatial structure of D-glucose/D-galactose-binding protein (GGBP) in apoform panel (A) and holoform panel (B) according to X-ray structural analysis [33]. Polar GGBP residues are shown in blue; non-polar protein residues are in gray; GGBP tryptophan residues, four of five of which are located in the C-terminal domain of the protein, are shown in red; histidine residue 152 is shown in yellow (His152/Cys substitution provides linking of the fluorescent dye BADAN in the active center of GGBP); and the glucose molecule is shown in green.
Figure 2
Figure 2
Spectral characteristics of BADAN bound to GGBP/H152C in apo panel (A) and holoform panel (B). The absorption and fluorescence spectra of BADAN are shown by solid blue and red curves, respectively. The absorption spectra are normalized to the signal intensity at the maximum of the long-wavelength band. The dye fluorescence spectra were measured at an excitation wavelength of 387 nm and normalized to the fluorescence intensity of BADAN attached to the GGBP/H152C apoform. The BADAN excitation spectra measured at fluorescence recording wavelengths of 475 and 530 nm and normalized to the intensity at the maximum of the spectrum are shown by blue dashed curves. The anisotropy spectra of BADAN fluorescence were measured at an excitation wavelength of 387 nm and are represented by red symbols. The excitation anisotropy spectra of BADAN were measured at a fluorescence recording wavelength of 530 nm and are represented by blue symbols.
Figure 3
Figure 3
The fluorescence decay of BADAN bound to GGBP/H152C in apo (blue curve) and holoform (red curve) in semilogariphmic scale. The green curve represents the instrument response function. The best fits of BADAN decay are represented by black curves. The excitation wavelength was 372 nm.
Figure 4
Figure 4
Decomposition of the fluorescence spectrum of BADAN linked to the GGBP/H152C apoform. Panel (A) Decay-associated spectrum of BADAN linked to GGBP/H152C apoform after global analysis of 100 dye decay curves recorded from 430 to 630 nm with step 2 nm. Colors indicate spectra associated with the particular decay time. Excitation wavelength was 372 nm. Panel (B) Decomposition of the fluorescence spectrum of BADAN linked to the GGBP/H152C apoform into components based on the analysis of the characteristics of the dye attached to various structural states of GGBP/H152C. The fluorescence spectra of BADAN attached to GGBP/H152C in the apoform, the holoform, and the unfolded state are shown in blue, green, and red solid curves, respectively. The spectra are normalized to the fluorescence intensity at their maximum. The short-wavelength component of BADAN fluorescence obtained by subtracting the fluorescence spectrum of the dye attached to denatured GGBP/H152C from the spectrum of the dye attached to the native apoprotein is shown by the blue dashed curve. Excitation wavelength was 387 nm.
Figure 5
Figure 5
Influence of microenvironmental properties on the fluorescence characteristics of BADAN coupled to various mutant forms of GGBP in the apoform (panel (A)) and in complex with glucose (panel (B)). The black, red, blue, and green curves correspond to the spectra of the dye attached to GGBP/H152C, GGBP/W284C, GGBP/H152C/W183F, and GGBP/H152C/W183A, respectively. The BADAN fluorescence intensity is normalized to the fluorescence intensity of the dye attached to the GGBP/H152C apoform. The excitation wavelength was 387 nm.
Figure 6
Figure 6
Characteristics of BADAN linked to GGBP/H152C/W183A in apo (red curves) and holo (blue curves) form. Panel (A) The fluorescence spectra of BADAN linked to GGBP/H152C/W183A (solid curves) and their decomposition into components (dashed curves); the excitation wavelength was 387 nm. Panels (B,C) The excitation spectra of fluorescence recorded at 475 nm (dashed curves) and 540 nm (solid curves). The result of subtraction of the excitation spectrum recorded at 475 nm from that recorded at 540 nm is shown by the green curve panel (C). Absorption spectrum of BADAN linked to GGBP/H152C/W183A is presented by the black curve.
Figure 7
Figure 7
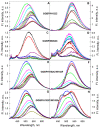
GdnHCl-induced changes in the spectral characteristics of BADAN linked to GGBP/H152C apo- (left panels) and holoform (right panels). The characteristics of the dye linked to the native protein. The characteristics of the dye linked to the native protein (Panels (A,B)), partially folded state of apo-protein in 0.5 M GdnHCl (Panel (C)), partially folded state of holo-protein in 1.5 M GdnHCl (Panel (D)), and unfolded protein in 3M GdnHCl (Panels (E,F))are presented. The BADAN fluorescence spectra, components of the fluorescence spectra, and fluorescence anisotropy spectra at λex = 387 nm are indicated by red solid and dashed curves and red symbols, respectively. The BADAN absorption spectra, excitation spectra recorded at 475 and 530 nm, and excitation anisotropy spectra recorded at 530 nm are shown by blue solid curves and dashed curves and blue symbols, respectively.
Figure 8
Figure 8
Fluorescence spectra of BADAN linked to mutant forms of GGBP in apo (left panels) and holoform (right panels) in GdnHCl solutions. Panels (AH) Spectra of GGBP/H152C, GGBP/W284C, GGBP/H152C, GGBP/H152C/W183F, and GGBP/H152C/W183A. Black, red, blue, green, pink, blue, dark red, dark green, dark yellow, dark blue, and violet curves characterize the BADAN fluorescence spectra in solutions containing 0, 0.1, 0.3, 0.5, 0.7, 0.9, 1.2, 1.5, 2, 3, and 4 M GdnHCl, respectively. The fluorescence intensity of BADAN under all experimental conditions was normalized to the fluorescence intensity of the dye attached to the GGBP/H152C apoform. The excitation wavelength was 387 nm.
Figure 9
Figure 9
Diagram illustrating BADAN photoprocesses during conformational changes in GGBP/H152C during the interaction of this protein with glucose and the unfolding of the GGBP/H152C apo and holoform induced by GdnHCl. The energy levels of the dye are indicated by horizontal lines, vertical purple arrows illustrate the transition of BADAN molecules from the ground to an excited state, blue and green arrows illustrate the radiative transitions of BADAN from PICT (planar intramolecular charge transfer state) and TICT (twisted intramolecular charge transfer state) to the ground state, and wavy arrows indicate nonradiative BADAN transitions. The relaxation of the excited and ground state of the dye under the action of the solvent is indicated by the abbreviation SR and is represented by dashed arrows.

References

    1. Adhikary R., Barnes C.A., Petrich J.W. Solvation dynamics of the fluorescent probe PRODAN in heterogeneous environments: Contributions from the locally excited and charge-transferred states. J. Phys. Chem. B. 2009;113:11999–12004. doi: 10.1021/jp905139n. - DOI - PubMed
    1. Alty I.G., Cheek D.W., Chen T., Smith D.B., Walhout E.Q., Abelt C.J. Intramolecular Hydrogen-Bonding Effects on the Fluorescence of PRODAN Derivatives. J. Phys. Chem. A. 2016;120:3518–3523. doi: 10.1021/acs.jpca.6b02398. - DOI - PubMed
    1. Artukhov V.Y., Zharkova O.M., Morozova J.P. Features of absorption and fluorescence spectra of prodan. Spectrochim. Acta A Mol. Biomol. Spectrosc. 2007;68:36–42. doi: 10.1016/j.saa.2006.10.048. - DOI - PubMed
    1. Artyukhov V.Y., Zharkova O.M., Morozova Y.P. Complexing and photoprocesses in a PRODAN molecule. Russ. Phys. J. 2004;47:1172–1177. doi: 10.1007/s11182-005-0049-6. - DOI
    1. Bakalova S.M., Kaneti J. Solvent induced shifts of electronic spectra IV. Computational study on PRODAN fluorescence and implications to the excited state structure. Spectrochim. Acta A Mol. Biomol. Spectrosc. 2009;72:36–40. doi: 10.1016/j.saa.2008.07.020. - DOI - PubMed

MeSH terms

Substances

LinkOut - more resources