Resolution of Two Steps in Botulinum Neurotoxin Serotype A1 Light Chain Localization to the Intracellular Plasma Membrane
- PMID: 34681775
- PMCID: PMC8539409
- DOI: 10.3390/ijms222011115
Resolution of Two Steps in Botulinum Neurotoxin Serotype A1 Light Chain Localization to the Intracellular Plasma Membrane
Abstract
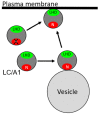
Botulinum neurotoxin serotype A (BoNT/A) is the most potent protein toxin to humans. BoNT/A light chain (LC/A) cleavage of the membrane-bound SNAP-25 has been well-characterized, but how LC/A traffics to the plasma membrane to target SNAP-25 is unknown. Of the eight BoNT/A subtypes (A1-A8), LC/A3 has a unique short duration of action and low potency that correlate to the intracellular steady state of LC/A, where LC/A1 is associated with the plasma membrane and LC/A3 is present in the cytosol. Steady-state and live imaging of LC/A3-A1 chimeras identified a two-step process where the LC/A N terminus bound intracellular vesicles, which facilitated an internal α-helical-rich domain to mediate LC/A plasma membrane association. The propensity of LC/A variants for membrane association correlated with enhanced BoNT/A potency. Understanding the basis for light chain intracellular localization provides insight to mechanisms underlying BoNT/A potency, which can be extended to applications as a human therapy.
Keywords: SNAP-25; botulinum neurotoxin; botulinum neurotoxin serotype A; cellular microbiology; subtype; toxins.
Conflict of interest statement
The authors don’t have any conflict of interest to declare.
Figures


Similar articles
-
How Botulinum Neurotoxin Light Chain A1 Maintains Stable Association with the Intracellular Neuronal Plasma Membrane.Toxins (Basel). 2022 Nov 22;14(12):814. doi: 10.3390/toxins14120814. Toxins (Basel). 2022. PMID: 36548711 Free PMC article.
-
The Light Chain Defines the Duration of Action of Botulinum Toxin Serotype A Subtypes.mBio. 2018 Mar 27;9(2):e00089-18. doi: 10.1128/mBio.00089-18. mBio. 2018. PMID: 29588398 Free PMC article.
-
Association of botulinum neurotoxin serotype A light chain with plasma membrane-bound SNAP-25.J Biol Chem. 2011 Apr 29;286(17):15067-72. doi: 10.1074/jbc.M111.224493. Epub 2011 Mar 4. J Biol Chem. 2011. PMID: 21378164 Free PMC article.
-
Crystal structure of the catalytic domain of botulinum neurotoxin subtype A3.J Biol Chem. 2021 Jan-Jun;296:100684. doi: 10.1016/j.jbc.2021.100684. Epub 2021 Apr 21. J Biol Chem. 2021. PMID: 33891946 Free PMC article.
-
Functional characterization of botulinum neurotoxin serotype H as a hybrid of known serotypes F and A (BoNT F/A).Anal Chem. 2015 Apr 7;87(7):3911-7. doi: 10.1021/ac504716v. Epub 2015 Mar 17. Anal Chem. 2015. PMID: 25731972 Free PMC article.
Cited by
-
Advances in Clostridial and Related Neurotoxins.Int J Mol Sci. 2022 Nov 15;23(22):14076. doi: 10.3390/ijms232214076. Int J Mol Sci. 2022. PMID: 36430554 Free PMC article.
-
How Botulinum Neurotoxin Light Chain A1 Maintains Stable Association with the Intracellular Neuronal Plasma Membrane.Toxins (Basel). 2022 Nov 22;14(12):814. doi: 10.3390/toxins14120814. Toxins (Basel). 2022. PMID: 36548711 Free PMC article.
-
Botulinum Neurotoxin A4 Has a 1000-Fold Reduced Potency Due to Three Single Amino Acid Alterations in the Protein Receptor Binding Domain.Int J Mol Sci. 2023 Mar 16;24(6):5690. doi: 10.3390/ijms24065690. Int J Mol Sci. 2023. PMID: 36982762 Free PMC article.
References
-
- Singh B.R. Scientific and Therapeutic Aspects of Botulinum Toxic. Volume 2015. Lippincott Williams & Wilkins; Philadelphia, PA, USA: 2002. p. 14.
MeSH terms
Substances
Grants and funding
LinkOut - more resources
Full Text Sources
Medical
Research Materials

