

Diagnosis of Dental Fluorosis Using Micro-Raman Spectroscopy Applying a Principal Component-Linear Discriminant Analysis
- PMID: 34682316
- PMCID: PMC8535615
- DOI: 10.3390/ijerph182010572
Diagnosis of Dental Fluorosis Using Micro-Raman Spectroscopy Applying a Principal Component-Linear Discriminant Analysis
Abstract
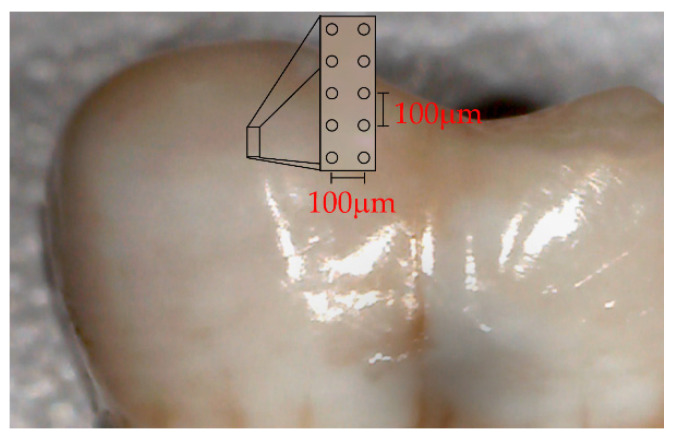
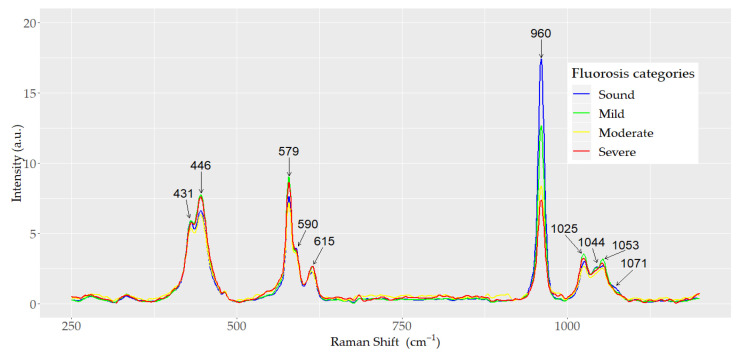
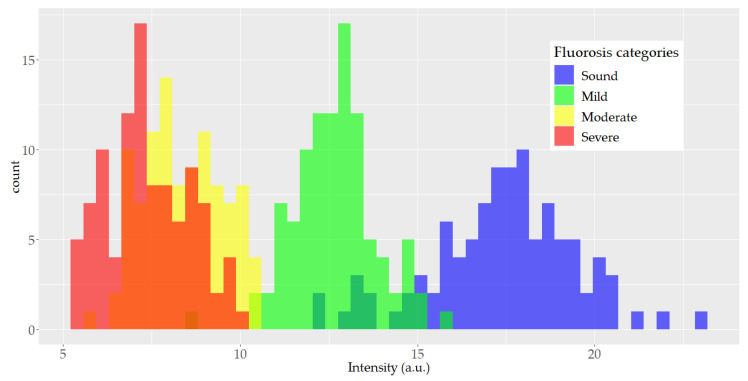
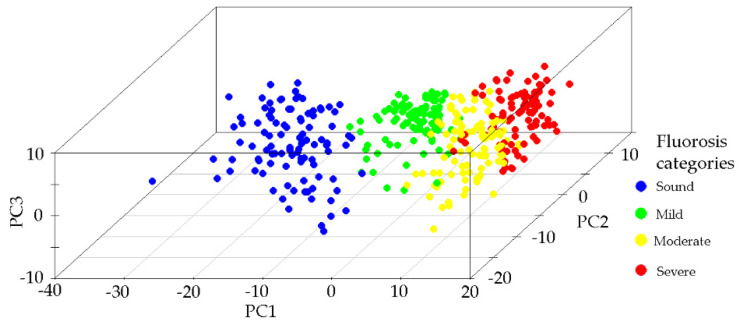
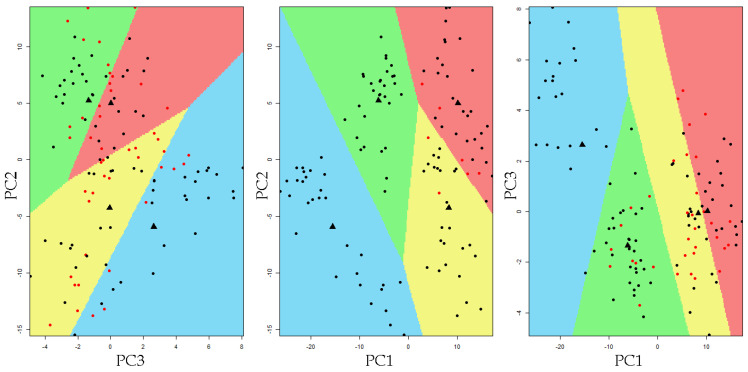
Dental fluorosis is an irreversible condition caused by excessive fluoride consumption during tooth formation and is considered a public health problem in several world regions. The objective of this study was to evaluate the capability of micro-Raman spectroscopy to classify teeth of different fluorosis severities, applying principal component analysis and linear discriminant analysis (PCA-LDA), and estimate the model cross-validation accuracy. Forty teeth of different fluorosis severities and a control group were analyzed. Ten spectra were captured from each tooth and a total of 400 micro-Raman spectra were acquired in the wavenumber range of 250 to 1200 cm-1, including the bands corresponding to stretching and bending internal vibrational modes ν1, ν2, ν3, and ν4 (PO43-). From the analysis of the micro-Raman spectra an increase in B-type carbonate ion substitution into the phosphate site of the hydroxyapatite as fluorosis severity increases was identified. The PCA-LDA model showed a sensitivity and specificity higher than 94% and 93% for the different fluorosis severity groups, respectively. The cross-validation accuracy was higher than 90%. Micro-Raman spectroscopy combined with PCA-LDA provides an adequate tool for the diagnosis of fluorosis severity. This is a non-invasive and non-destructive technique with promising applications in clinical and epidemiological fields.
Keywords: Raman spectroscopy; dental fluorosis; discriminant analysis; principal component analysis.
Conflict of interest statement
The authors declare no conflict of interest.
Figures

References
-
- World Health Organization Water Sanitation. Water Related Diseases. Fluorosis. [(accessed on 22 June 2020)]. Available online: https://www.who.int/water_sanitation_health/diseases-risks/diseases/fluo...
-
- Molina-Frechero N., Nevarez-Rascón M., Nevarez-Rascón A., González-González R., Irigoyen-Camacho M.E., Sánchez-Pérez L., López-Verdin S., Bologna-Molina R. Impact of Dental Fluorosis, Socioeconomic Status and Self-Perception in Adolescents Exposed to a High Level of Fluoride in Water. Int. J. Environ. Res. Public Health. 2017;14:73. doi: 10.3390/ijerph14010073. - DOI - PMC - PubMed
MeSH terms
Substances
LinkOut - more resources
Full Text Sources
Research Materials
