. 2021 Oct 19;26(20):6310.
doi: 10.3390/molecules26206310.

d-Allulose Ameliorates Skeletal Muscle Insulin Resistance in High-Fat Diet-Fed Rats

Affiliations

d-Allulose Ameliorates Skeletal Muscle Insulin Resistance in High-Fat Diet-Fed Rats

Yang Gou et al. Molecules. .

Abstract

Background: d-Allulose is a rare sugar with antiobesity and antidiabetic activities. However, its direct effect on insulin sensitivity and the underlying mechanism involved are unknown.

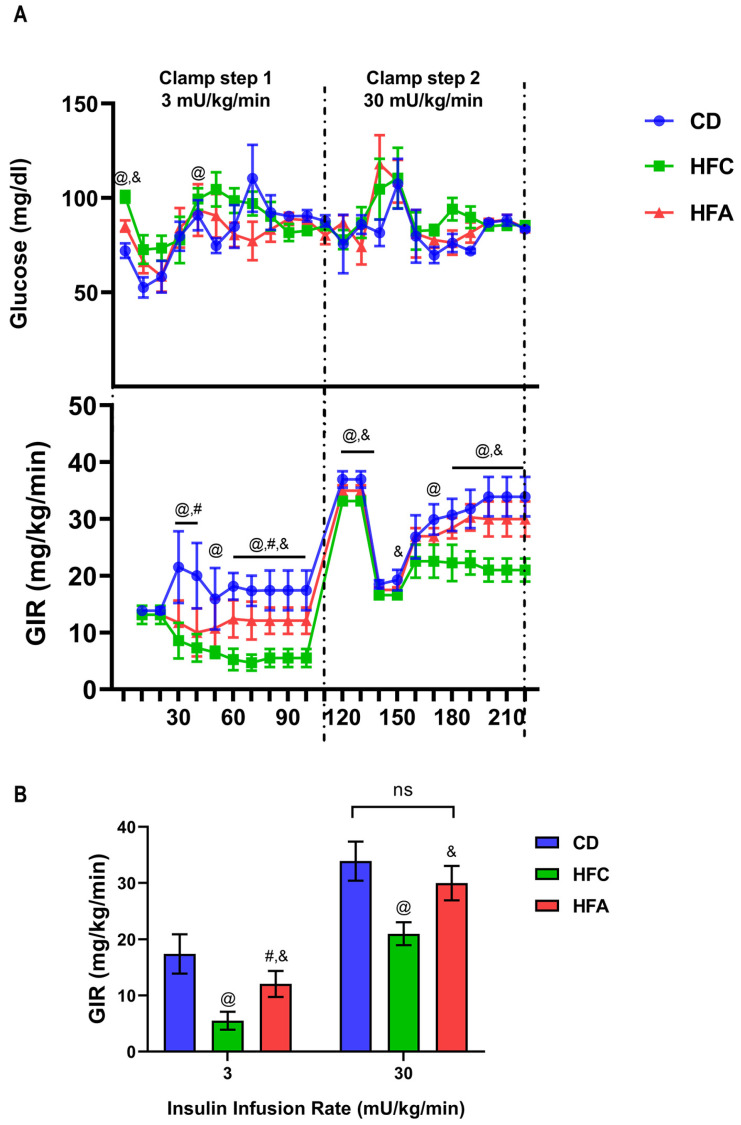
Objective: This study aimed to investigate the effect of d-allulose on high-fat diet (HFD)-induced insulin resistance using the hyperinsulinemic-euglycemic (HE)-clamp method and intramuscular signaling analysis.

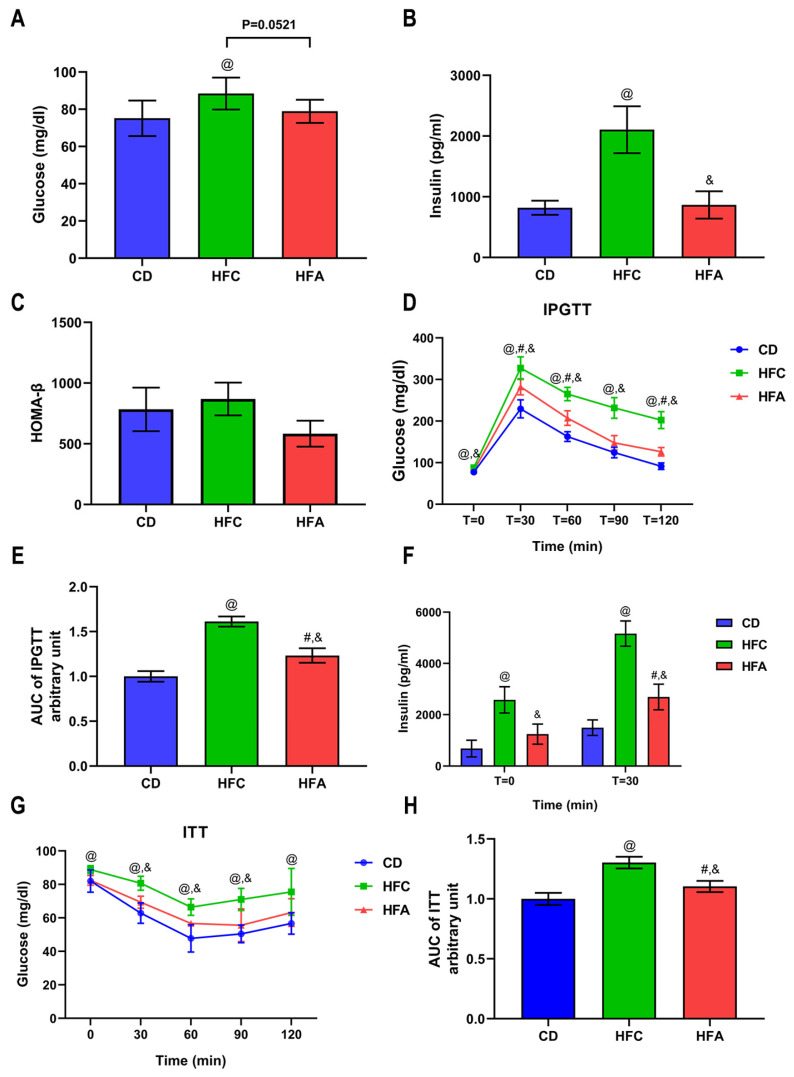
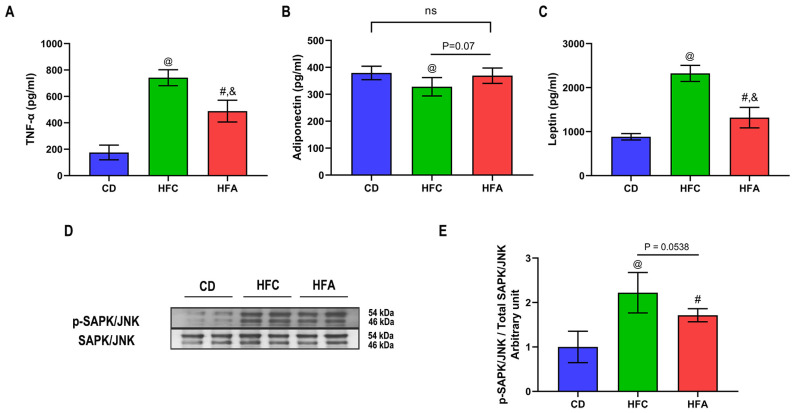
Methods: Wistar rats were randomly divided into three dietary groups: chow diet, HFD with 5% cellulose (HFC), and HFD with 5% d-allulose (HFA). After four weeks of feeding, the insulin tolerance test (ITT), intraperitoneal glucose tolerance test (IPGTT), and HE-clamp study were performed. The levels of plasma leptin, adiponectin, and tumor necrosis factor (TNF)-α were measured using the enzyme-linked immunosorbent assay. We analyzed the levels of cell signaling pathway components in the skeletal muscle using Western blotting.

Results: d-allulose alleviated the increase in HFD-induced body weight and visceral fat and reduced the area under the curve as per ITT and IPGTT. d-Allulose increased the glucose infusion rate in the two-step HE-clamp test. Consistently, the insulin-induced phosphorylation of serine 307 in the insulin receptor substrate-1 and Akt and expression of glucose transporter 4 (Glut-4) in the muscle were higher in the HFA group than HFC group. Furthermore, d-allulose decreased plasma TNF-α concentration and insulin-induced phosphorylation of stress-activated protein kinase/Jun N-terminal kinase in the muscle and inhibited adiponectin secretion in HFD-fed rats.

Conclusions: d-allulose improved HFD-induced insulin resistance in Wistar rats. The reduction of the proinflammatory cytokine production, amelioration of adiponectin secretion, and increase in insulin signaling and Glut-4 expression in the muscle contributed to this effect.

Keywords: d-allulose; glucose uptake; hyperinsulinemic–euglycemic clamp; inflammation; insulin resistance; skeletal muscle; white adipose tissue.


Conflict of interest statement

This study was partly funded by Matsutani Chemical Industry Co., Ltd. (Itami, Japan). T.Y. and T.I. are employees of the company. The funders had no role in the design of the study; in the collection, analysis, or interpretation of data; in the writing of the manuscript; or in the decision to publish the results.

Figures

Figure 1
Figure 1
Effects of d-allulose supplementation for 4 weeks on body composition and calorie intake. (A) Bodyweight, (B) food consumption, and (C) feed efficiency ratio. (D) Epididymal, (E) perirenal, and (F) visceral fat pad weights. Results are expressed as mean ± SD. @: CD vs. HFC, #: CD vs. HFA, &: HFC vs. HFA. p < 0.05, n = 6 per group; ns, no significant difference. The differences were determined using one-way ANOVA (AF). Skeletal muscle masses were presented in Supplementary Table S1. CD: chow diet, HFA: HFD + d-allulose, HFC: HFD + cellulose, and HFD: high-fat diet.
Figure 2
Figure 2
Effects of d-allulose supplementation for 4 weeks on glucose metabolism. (A) Fasting blood glucose level, (B) fasting plasma insulin level, (C) the value of HOMA-β, (D) blood glucose levels during IPGTT, (E) area under the curve during IPGTT, (F) insulin level at T = 0 and T = 30 min during IPGTT, (G) blood glucose levels during ITT, and (H) area under the curve during ITT. Results are expressed as mean ± SD. @: CD vs. HFC, #: CD vs. HFA, &: HFC vs. HFA, p < 0.05, n = 6 per group; and ns, no significant difference. Differences were determined using two-way ANOVA assessed for repeated measures (D,G) and one-way ANOVA (AC,E,F,H). CD: chow diet, HFA: HFD + d-allulose, HFC: HFD + cellulose, HFD: high-fat diet, HOMA-β: the homeostasis model assessment of β-cell function, IPGTT: intraperitoneal glucose tolerance test, and ITT: insulin tolerance test.
Figure 3
Figure 3
Changes in blood glucose level and glucose infusion rate (GIR) in the hyperinsulinemic–euglycemic clamp test: (A) The time course of glucose concentration and GIR. Low-dose insulin (3 mU/kg) was continuously infused during step 1 and high-dose insulin (30 mU/kg) during step 2; (B) differences in GIR at low and high insulin doses. Results are expressed as mean ± SD; n = 6 per group. @: CD vs. HFC, #: CD vs. HFA, &: HFC vs. HFA, p < 0.05; and ns, no significant difference. The difference was determined using one-way ANOVA assessed by each time point (A,B). CD: chow diet, HFA: HFD + d-allulose, HFC: HFD + cellulose, and HFD: high-fat diet.
Figure 4
Figure 4
Effects of d-allulose supplementation for 4 weeks on adipokines and JNK signaling. (A) Levels of plasma TNF-α, (B) adiponectin, and (C) leptin. (D) Western blot showing bands of SAPK/JNK phosphorylation at Thr183/Tyr185 and total SAPK/JNK. (E) The level of SAPK/JNK phosphorylation at Thr183/Tyr185 vs. SAPK/JNK protein expression in the soleus muscle. Results are expressed as mean ± SD; n = 6 per group. @: CD vs. HFC, #: CD vs. HFA, &: HFC vs. HFA, p < 0.05; ns, no significant difference. The difference was determined by one-way ANOVA. CD: chow diet, HFA: HFD + d-allulose, HFC: HFD + cellulose, HFD: high-fat diet, JNK: Jun N-terminal kinase, SAPK: stress-activated protein kinase, and TNF: tumor necrosis factor.
Figure 5
Figure 5
Effects of d-allulose on insulin signaling and Glut-4 expression in the soleus muscle. (A) Phosphorylation of IRS-1 at serine 307 and tyrosine vs. protein expression of IRS-1. (B) The level of insulin-stimulated phosphorylation of IRS-1 at serine 307 vs. IRS-1 protein expression. (C) The ratio of insulin-stimulated phosphorylation of IRS-1 at the tyrosine residue vs. IRS-1 protein expression. (D) The level of insulin-stimulated phosphorylation of Akt at serine 473 vs. total Akt, (E) Glut-4 protein expression. Results are expressed as mean ± SD; n = 6 per group, @: CD vs. HFC, &: HFC vs. HFA, p < 0.05; and ns, no significant difference. The difference was determined using one-way ANOVA. All the western blots used for the quantitative analysis are presented in Supplementary Figure S1. Akt: Protein kinase B, CD: chow diet, Glut-4: glucose transporter 4, HFA: HFD + d-allulose, HFC: HFD + cellulose, HFD: high-fat diet, and IRS-1: insulin receptor substrate-1.

References

    1. Kahn S.E., Cooper M.E., Del Prato S. Pathophysiology and treatment of type 2 diabetes: Perspectives on the past, present, and future. Lancet. 2014;383:1068–1083. doi: 10.1016/S0140-6736(13)62154-6. - DOI - PMC - PubMed
    1. Guo S. Insulin signaling, resistance, and the metabolic syndrome: Insights from mouse models into disease mechanisms. J. Endocrinol. 2014;220:T1–T23. doi: 10.1530/JOE-13-0584. - DOI - PMC - PubMed
    1. Barazzoni R., Gortan Cappellari G., Ragni M., Nisoli E. Insulin resistance in obesity: An overview of fundamental alterations. Eat Weight Disord. 2018;23:149–157. doi: 10.1007/s40519-018-0481-6. - DOI - PubMed
    1. Grice B.A., Barton K.J., Covert J.D., Kreilach A.M., Tackett L., Brozinick J.T., Elmendorf J.S. Excess membrane cholesterol is an early contributing reversible aspect of skeletal muscle insulin resistance in C57BL/6NJ mice fed a Western-style high-fat diet. Am. J. Physiol. Endocrinol. Metab. 2019;317:E362–E373. doi: 10.1152/ajpendo.00396.2018. - DOI - PMC - PubMed
    1. Volaco A., Cavalcanti A.M., Filho R.P., Précoma D.B. Socioeconomic Status: The Missing Link between Obesity and Diabetes Mellitus. Curr. Diabetes Rev. 2018;14:321–326. doi: 10.2174/1573399813666170621123227. - DOI - PubMed