. 2021 Oct 5;10(10):2658.
doi: 10.3390/cells10102658.

SP-1, a Serine Protease from the Gut Microbiota, Influences Colitis and Drives Intestinal Dysbiosis in Mice

Affiliations

SP-1, a Serine Protease from the Gut Microbiota, Influences Colitis and Drives Intestinal Dysbiosis in Mice

Aicha Kriaa et al. Cells. .

Abstract

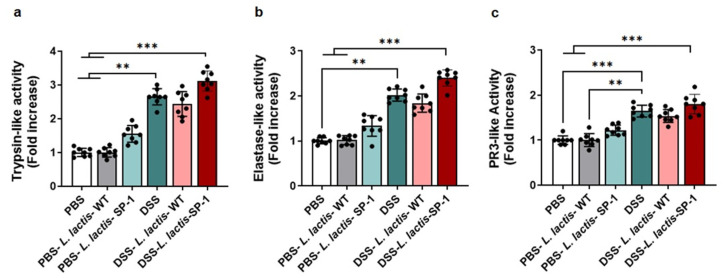
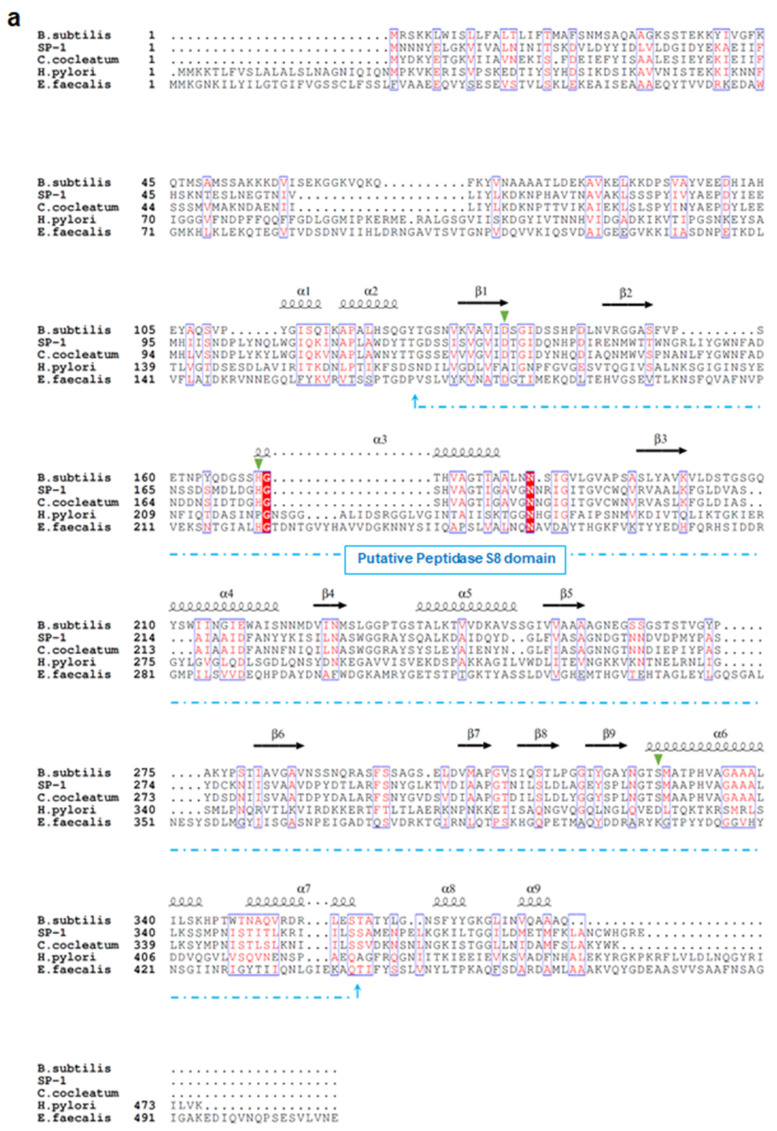
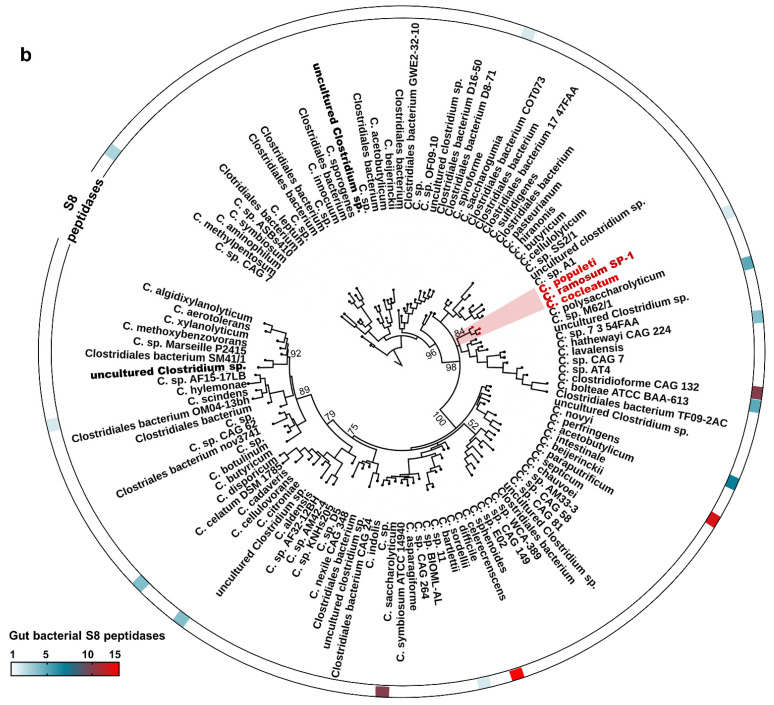
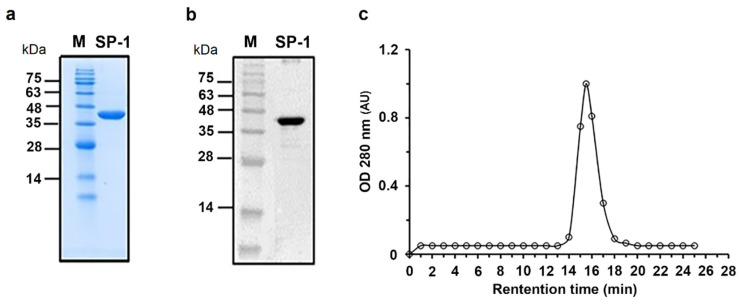
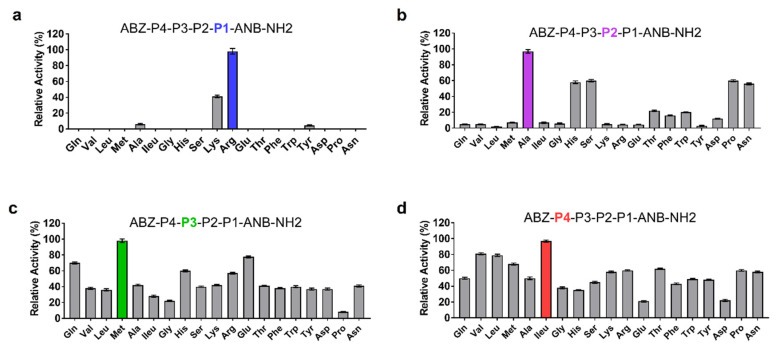
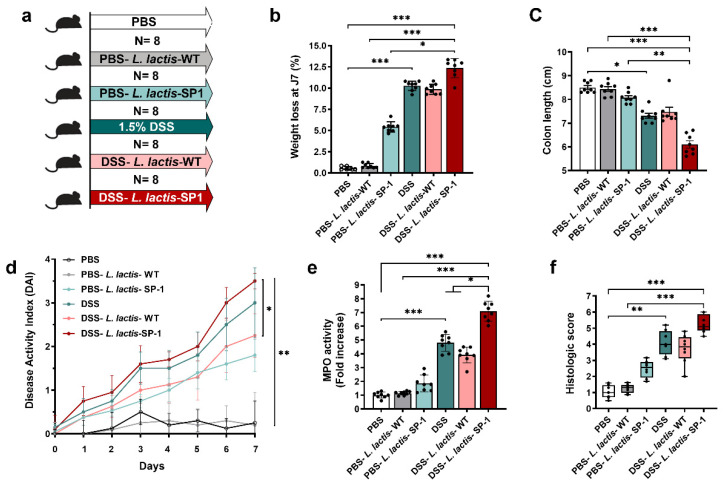
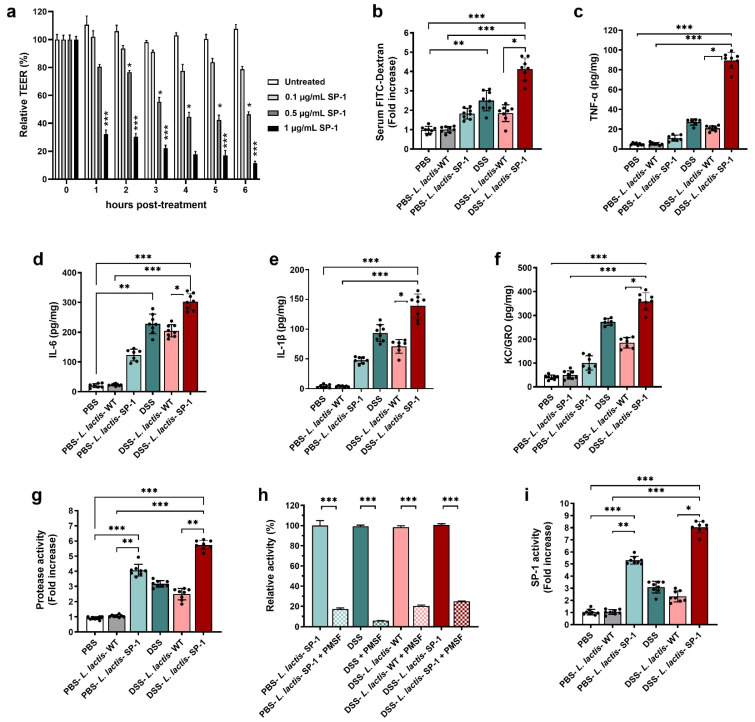
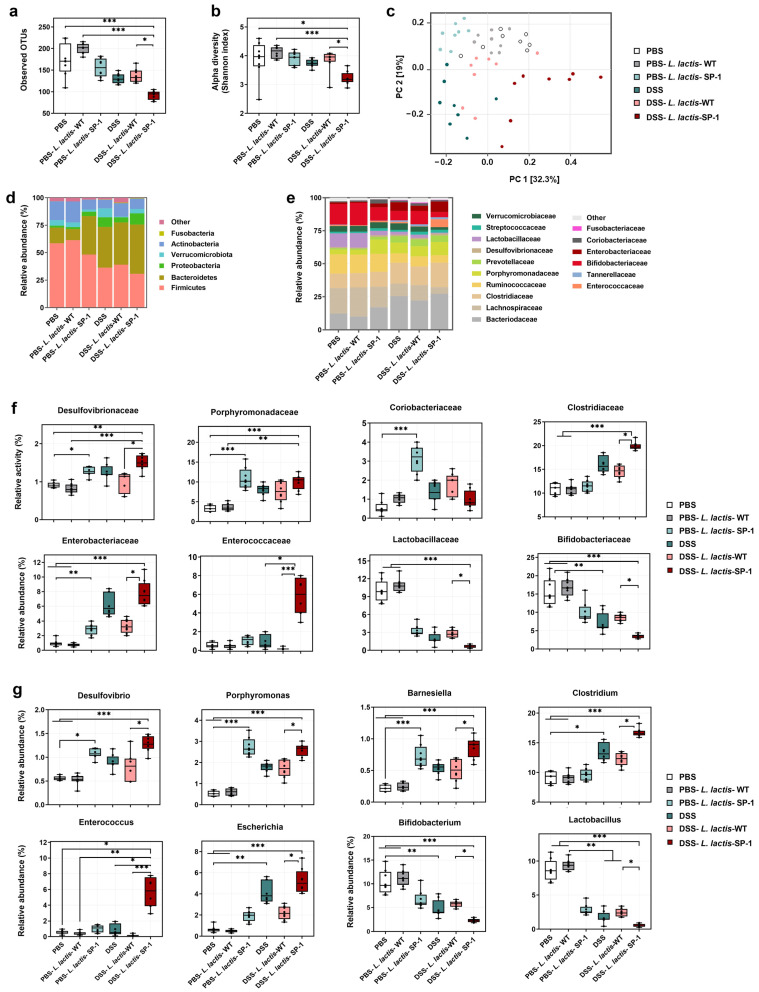
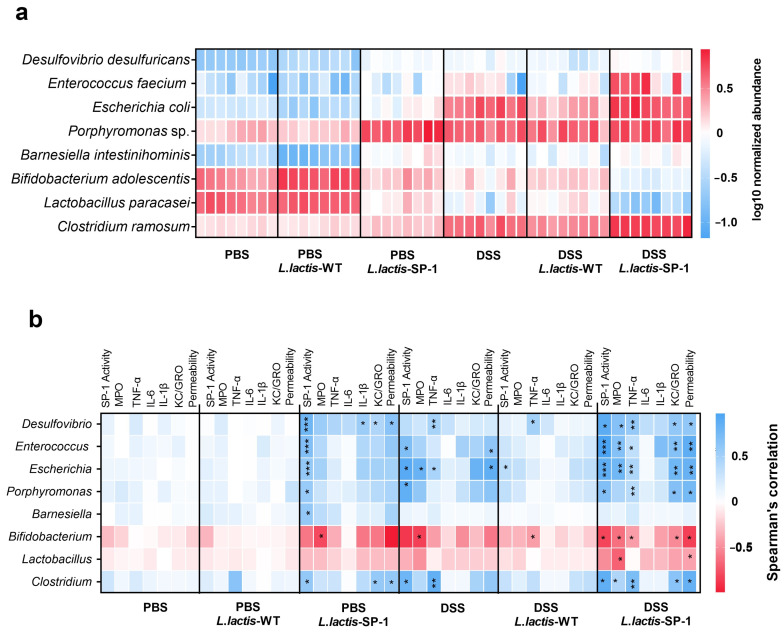
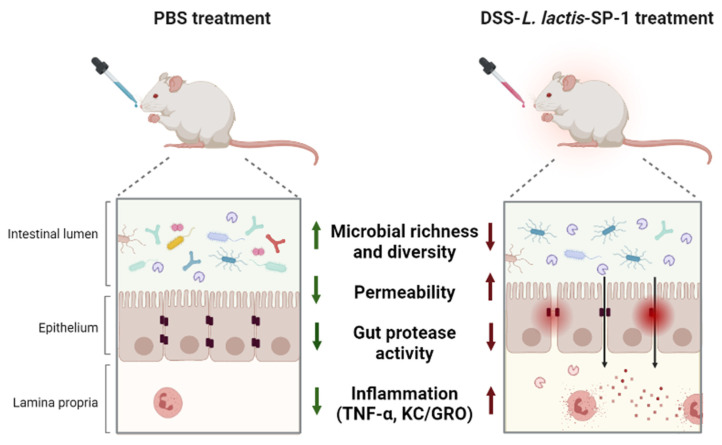
Increased protease activity has been linked to the pathogenesis of IBD. While most studies have been focusing on host proteases in gut inflammation, it remains unclear how to address the potential contribution of their bacterial counterparts. In the present study, we report a functional characterization of a newly identified serine protease, SP-1, from the human gut microbiota. The serine protease repertoire of gut Clostridium was first explored, and the specificity of SP-1 was analyzed using a combinatorial chemistry method. Combining in vitro analyses and a mouse model of colitis, we show that oral administration of recombinant bacteria secreting SP-1 (i) compromises the epithelial barrier, (ii) alters the microbial community, and (ii) exacerbates colitis. These findings suggest that gut microbial protease activity may constitute a valuable contributor to IBD and could, therefore, represent a promising target for the treatment of the disease.

Keywords: gut microbiota; holobiont; inflammatory bowel diseases; microbiome; serine proteases.


Conflict of interest statement

The authors declare no conflict of interest.

Figures

Figure A1
Figure A1
Profiling fecal serine protease activity. (a) Fecal trypsin-like activity detected in each group (PBS = 2.25 ± 0.12 U/mg, PBS-L. lactis-WT = 2.28 ± 0.14 U/mg, PBS-L. lactis-SP-1 = 3.5 ± 0.2 U/mg, DSS = 6.01 ± 0.3 U/mg, DSS-L. lactis-WT = 5.48 ± 0.15 U/mg, DSS-L. lactis-SP-1 = 7.04 ± 0.2 U/mg). (b) Fecal elastase-like activity measurement (PBS = 2.01 ± 0.08 U/mg, PBS-L. lactis-WT = 2.06 ± 0.07 U/mg, PBS-L. lactis-SP-1 = 2.79 ± 0.2 U/mg, DSS = 4.26 ± 0.13 U/mg, DSS-L. lactis-WT = 3.62 ± 0.2 U/mg, DSS-L. lactis-SP-1 = 4.81 ± 0.17 U/mg). (c) Fecal PR3-like activity measurement (PBS = 1.7 ± 0.09 U/mg, PBS-L. lactis-WT = 1.71 ± 0.14 U/mg, PBS-L. lactis-SP-1 = 2.05 ± 0.1 U/mg, DSS = 2.81 ± 0.1 U/mg, DSS-L. lactis-WT = 2.66 ± 0.15 U/mg, DSS-L. lactis-SP-1 = 3.03 ± 0.2 U/mg). The error bars represent the SEM. Data are presented as mean ± SEM. Statistical analyses were performed using Kruskal–Wallis followed by the multi comparison test of Dunn. ** p < 0.01 and *** p < 0.001.
Figure 1
Figure 1
Sequence analysis and phylogeny of Clostridium-producing proteases. (a) Structure-based sequence alignment of SP-1 and other selected bacterial proteases (UniProt accession numbers: E1S7U4, protease from H. pylori; Q833V7, gelatinase from E. faecalis; A0A1I0FUC9, protease from C. cocleatum and P04189, Subtilisin from B. subtilis). The structural elements shown above the alignment were generated using the Subtilisin structure (PDB ID: 6O44). Invariant residues between sequences are typed red on a white background, and conserved residues are shown as white letters on a red background. Green triangles represent conserved amino acids from the catalytic triad, Asp134, His175, and Ser327. (b) Distribution of subtilisin-like proteases across gut Clostridium species. Clostridium sequences with >40% identity to SP-1 are clustered into a subclade highlighted in red. Branch labels show bootstrap values. Outer tracks show the numbers of genes from each S8 subtilisin-like protease in each genome.
Figure 1
Figure 1
Sequence analysis and phylogeny of Clostridium-producing proteases. (a) Structure-based sequence alignment of SP-1 and other selected bacterial proteases (UniProt accession numbers: E1S7U4, protease from H. pylori; Q833V7, gelatinase from E. faecalis; A0A1I0FUC9, protease from C. cocleatum and P04189, Subtilisin from B. subtilis). The structural elements shown above the alignment were generated using the Subtilisin structure (PDB ID: 6O44). Invariant residues between sequences are typed red on a white background, and conserved residues are shown as white letters on a red background. Green triangles represent conserved amino acids from the catalytic triad, Asp134, His175, and Ser327. (b) Distribution of subtilisin-like proteases across gut Clostridium species. Clostridium sequences with >40% identity to SP-1 are clustered into a subclade highlighted in red. Branch labels show bootstrap values. Outer tracks show the numbers of genes from each S8 subtilisin-like protease in each genome.
Figure 2
Figure 2
Purification and western blotting of recombinant SP-1. (a) Coomassie blue staining of an SDS-PAGE gel. SP-1 is represented by one single band with a molecular mass of 42 kDa. Lane M protein marker (molecular mass in kilodaltons). (b) Western blot analysis of purified SP-1 with anti-His tag antibody. (c) Size exclusion chromatography analysis of purified SP-1 (retention time, RT, 15 min) using protein markers of 669 kDa (RT, 8.9 min), 440 kDa (RT, 11.3 min), 158 kDa (RT, 13.2 min), 75 kDa (RT, 14.1 min), 44 kDa (RT, 15.3 min) and 29 kDa (RT, 16.9 min).
Figure 3
Figure 3
Results of the deconvolution of the ABZ-P4-P3-P2-P1-ANB-NH2 library against SP-1. The x-axis indicates the amino acid fixed at each P position. P1, P2, P3, and P4 correspond to the mixture of 19 amino acid residues. (a) P1 position was fixed with the most active residue (b) P2, (c) P3 and (d) P4 profiling were performed in a similar manner. All measurements were performed in triplicate, and the y-axis indicates the activity (mean ± SEM) relative to the mean value of the highest signal detected for each P position.
Figure 4
Figure 4
Administration of L. lactis secreting SP-1 influences colitis. (a) C57BL/6 mice were provided with water or 1.5% DSS-containing water for 7 days (N = 8 in each group). Mice were orally administered with PBS, PBS-L. lactis-WT, PBS-L. lactis-SP-1, DSS alone, DSS-L. lactis-WT or DSS-L. lactis- SP-1 (5 × 10⁹ CFU L. lactis-WT or SP-1-expressing L. lactis were evaluated / day). (b) Body weight loss for each group. (ce) Mice were euthanized (day 8), and (c) colon length, (d) disease activity index, and (e) colonic MPO activity were measured. (f) Histological scores were determined. Data are presented as mean ± SEM from a representative experiment (N = 8 biologically independent animals). Analyzed by Kruskal–Wallis followed by the multi-comparison Dunn’s test. * p < 0.05; ** p < 0.01 and *** p < 0.001.
Figure 5
Figure 5
SP-1 supplementation impairs colonic epithelium and increases fecal protease activity. (a) Time-dependent means of relative changes (in %) of measured TEER ± SEM in the presence of increasing concentrations of recombinant SP-1 in comparison to untreated cells. (b) Epithelial barrier functions were assessed in mice by oral gavage of FITC-dextran on day 7, followed by measuring the FITC-dextran signal in blood after 3 h. (cf) Colon tissues were analyzed for the concentrations of pro-inflammatory cytokines. (gi) Fecal samples were analyzed for serine protease profiling. (g) Total fecal protease activity in each group. (h). Relative proteolytic activity without and with pretreatment with PMSF in PBS-L. lactis-SP-1, DSS-treated mice, DSS-L. lactis-WT and DSS-L. lactis-SP-1. The relative activity that reflects the maximal activity was defined as 100%. (i) Fecal SP-1 activity in PBS (N = 8), PBS-L. lactis-WT (N = 8), PBS-L. lactis-SP-1 (N = 8), DSS (N = 8), DSS-L. lactis-WT (N = 8) and DSS-L. lactis-SP-1 (N = 8). Data are presented as mean ± SEM. Statistical analyses were performed using Kruskal–Wallis, followed by the multi-comparison test of Dunn. * p < 0.05; ** p < 0.01 and *** p < 0.001.
Figure 6
Figure 6
SP-1 administration alters the composition of gut microbiota. (a) Estimation of microbial community observed OTU richness and (b) α-diversity (Shannon index). (c) PCoA plot illustrating the gut microbiota β-diversity. Each point represents each mouse based on a subsample of 12803 OTUs. (de) Relative abundance of gut microbiota. Phylum- and family-level taxonomy are presented as a percentage of total sequences. (f) Microbial families with significantly different abundance between studied groups. (g) Microbial genera with significantly different abundance between studied groups. Data are presented as mean ± SEM. Data were analyzed by the Kruskal–Wallis test followed by Dunn’s test. * p < 0.05; ** p < 0.01 and *** p < 0.001.
Figure 7
Figure 7
Taxa differentially abundant and correlation with inflammatory parameters. (a) Heat map showing the relative abundance (log-transformed) of differentially abundant species between studied groups. (b) Spearman correlations between microbial populations and host parameters. The colors denote the nature of the correlation, with dark blue indicating a strong positive correlation and dark red indicating a strong negative correlation.* p < 0.05; ** p < 0.01; *** p < 0.001 after FDR correction.
Figure 8
Figure 8
Graphic summary of the study design and main findings.

References

    1. Ananthakrishnan A.N., Bernstein C.N., Iliopoulos D., MacPherson A., Neurath M.F., Ali R.A.R., Vavricka S.R., Fiocchi C. Environmental triggers in IBD: A review of progress and evidence. Nat. Rev. Gastroenterol. Hepatol. 2018;15:39–49. doi: 10.1038/nrgastro.2017.136. - DOI - PubMed
    1. Kaplan G.G., Ng S.C. Understanding and Preventing the global increase of inflammatory bowel disease. Gastroenterology. 2017;152:313–321. doi: 10.1053/j.gastro.2016.10.020. - DOI - PubMed
    1. Ananthakrishnan A.N. Epidemiology and risk factors for IBD. Nat. Rev. Gastroenterol. Hepatol. 2015;12:205–217. doi: 10.1038/nrgastro.2015.34. - DOI - PubMed
    1. Xu X.R., Liu C.Q., Feng B.S., Liu Z.J. Dysregulation of mucosal immune response in pathogenesis of inflammatory bowel disease. World J. Gastroenterol. 2014;20:3255–3264. doi: 10.3748/wjg.v20.i12.3255. - DOI - PMC - PubMed
    1. Solà Tapias N., Vergnolle N., Denadai-Souza A., Barreau F. The interplay between genetic risk factors and proteolytic dysregulation in the pathophysiology of inflammatory bowel disease. J. Crohns. Colitis. 2020;33:1–33. doi: 10.1093/ecco-jcc/jjaa033. - DOI - PubMed

Publication types

MeSH terms

Supplementary concepts

LinkOut - more resources