. 2021 Oct 4;10(10):2100.
doi: 10.3390/plants10102100.

Environmental and Genetic Factors Affecting Apospory Expressivity in Diploid Paspalum rufum

Affiliations

Environmental and Genetic Factors Affecting Apospory Expressivity in Diploid Paspalum rufum

Mariano Soliman et al. Plants (Basel). .

Abstract

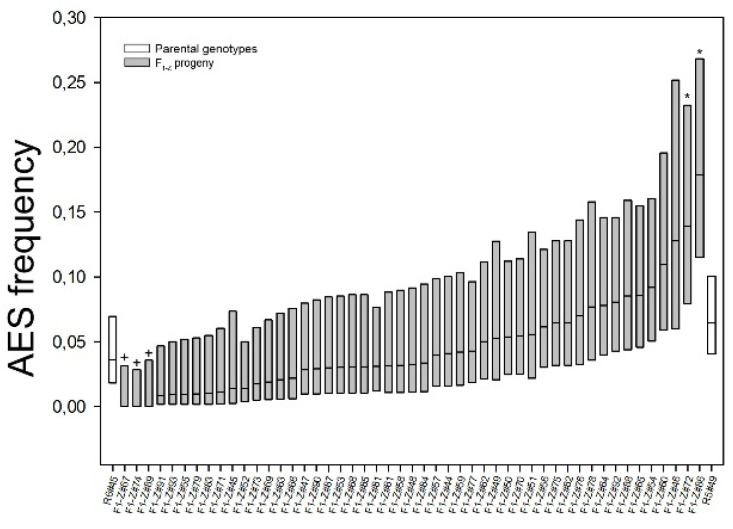
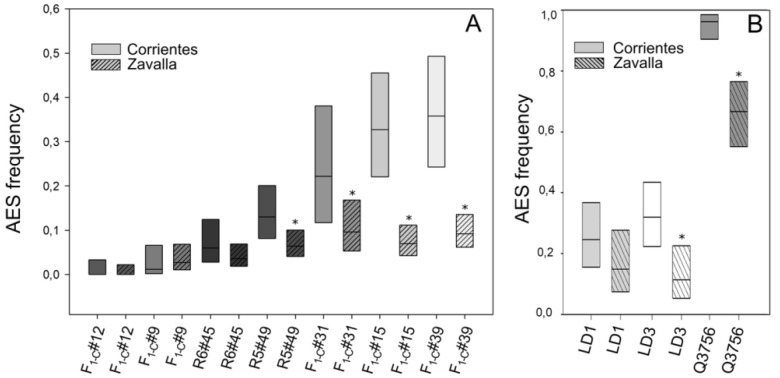
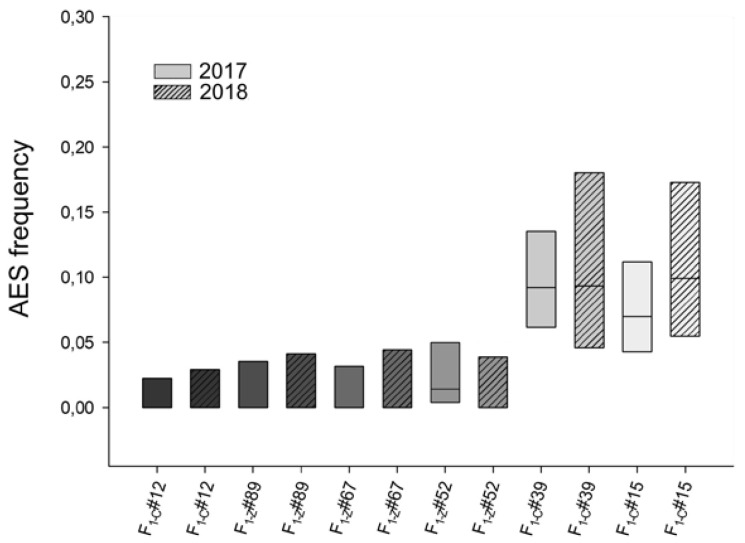
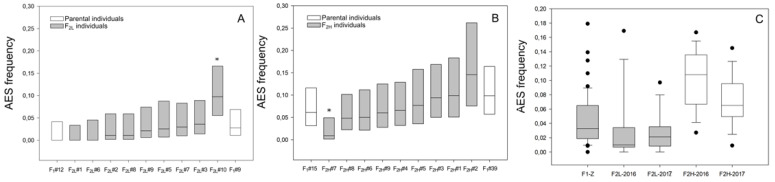
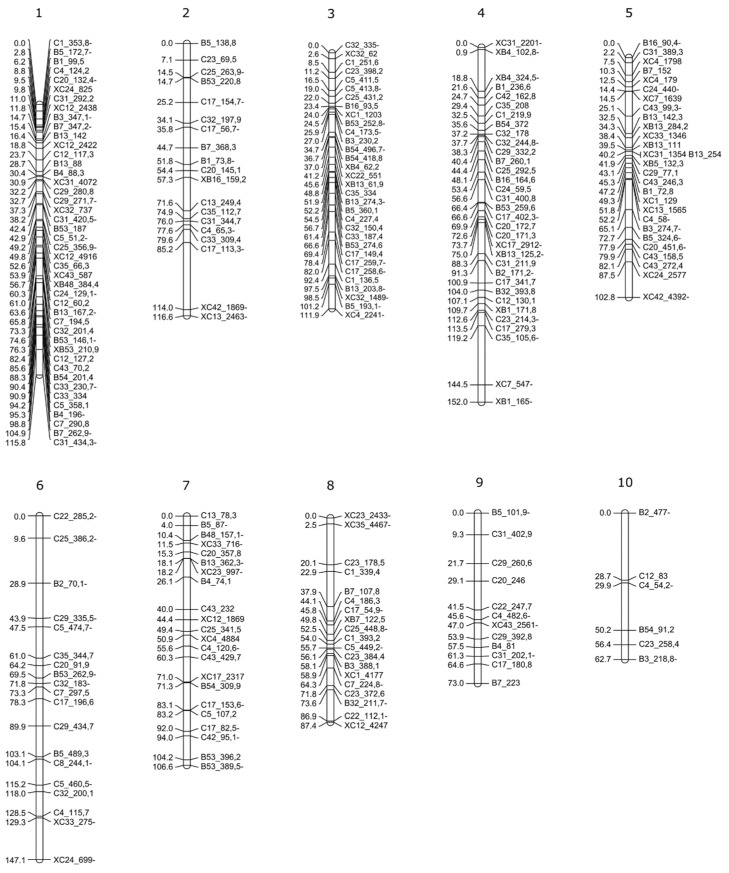
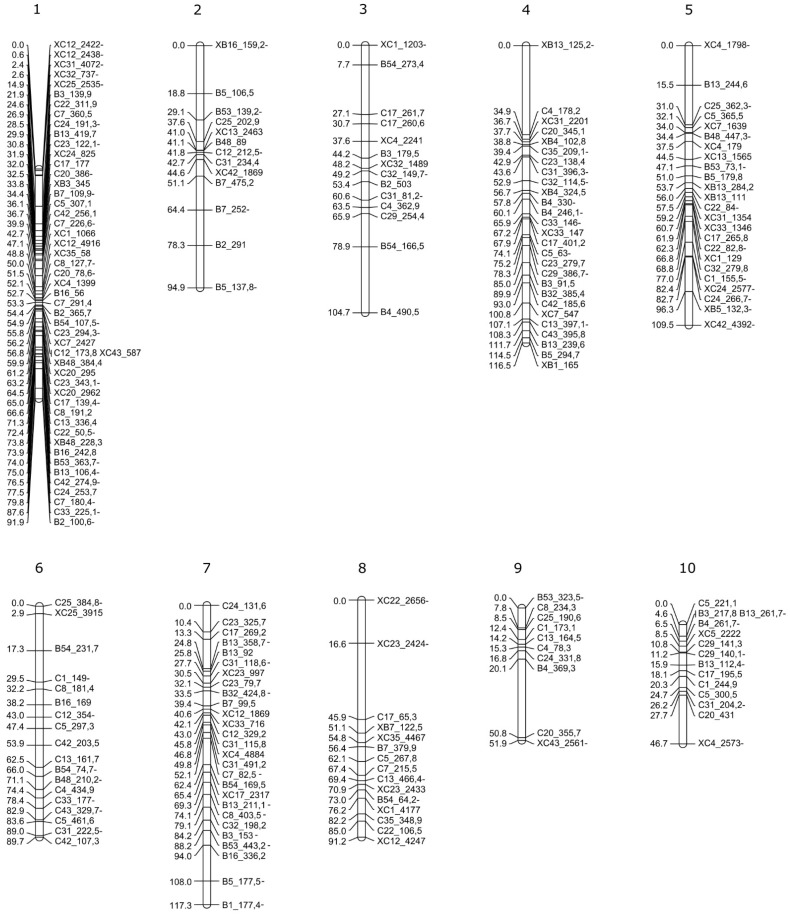
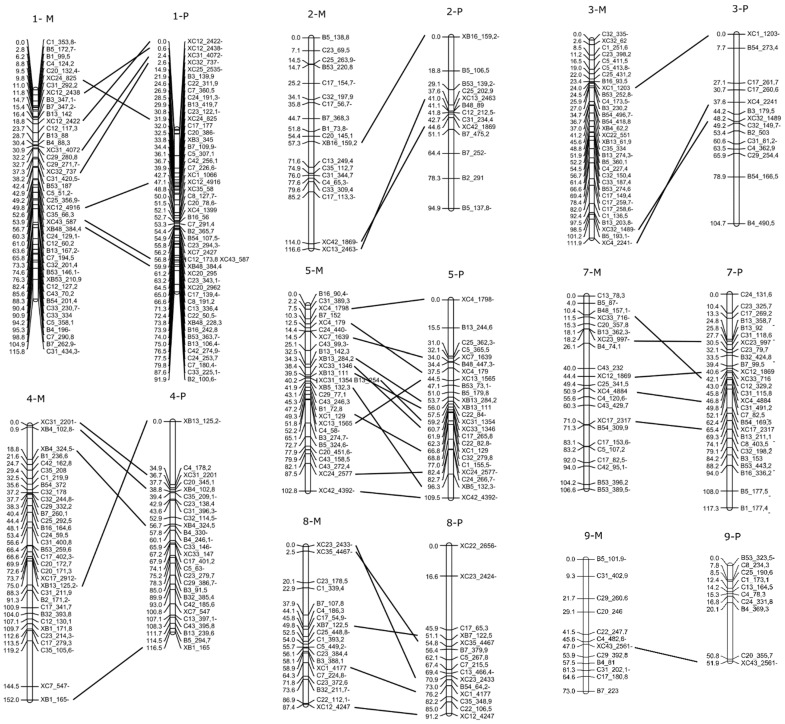
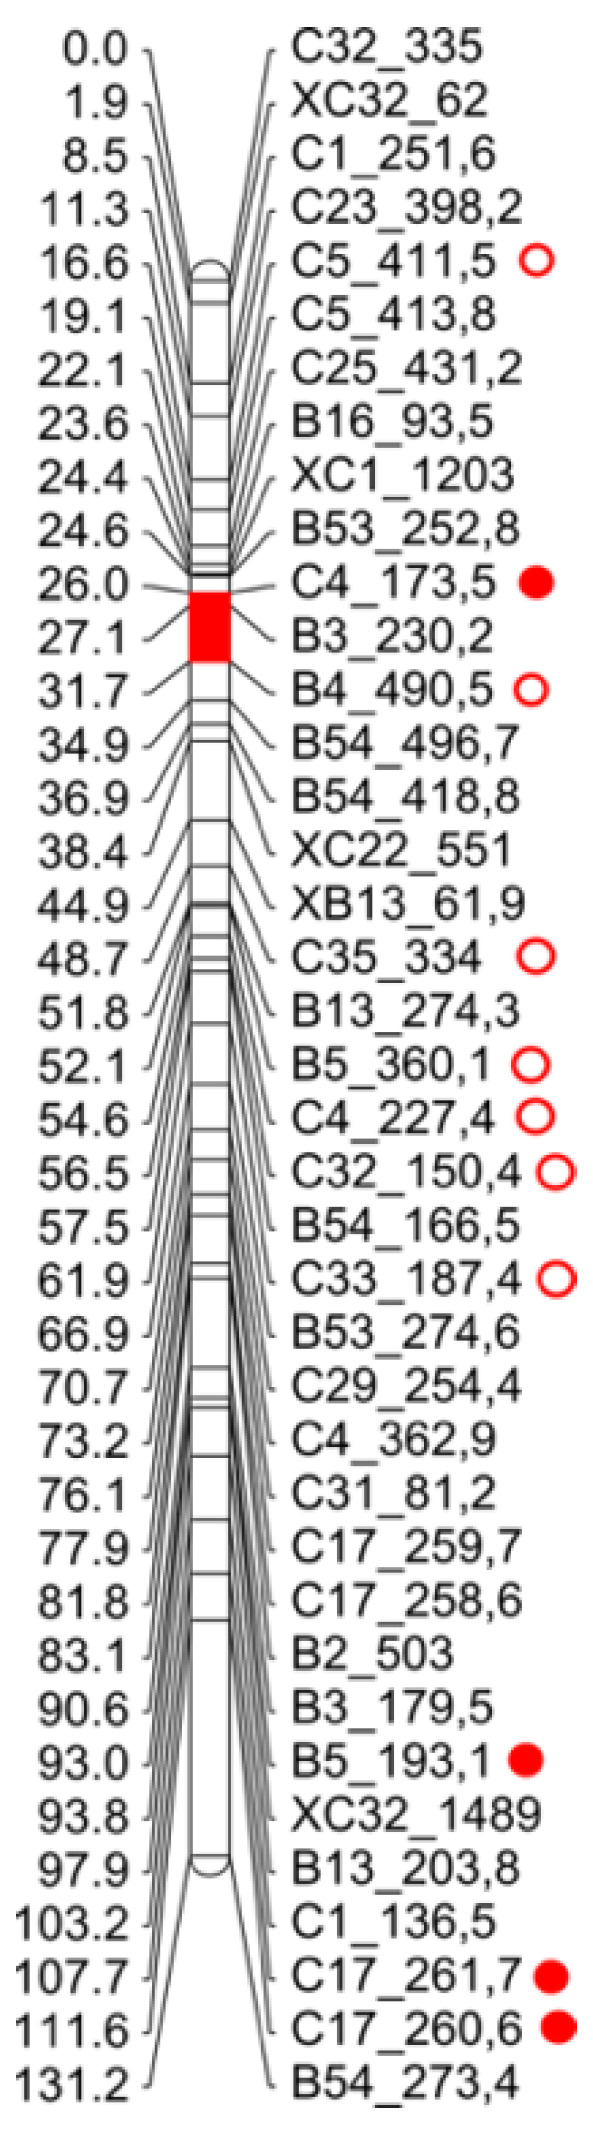
In angiosperms, gametophytic apomixis (clonal reproduction through seeds) is strongly associated with polyploidy and hybridization. The trait is facultative and its expressivity is highly variable between genotypes. Here, we used an F1 progeny derived from diploid apomictic (aposporic) genotypes of Paspalum rufum and two F2 families, derived from F1 hybrids with different apospory expressivity (%AES), to analyze the influence of the environment and the transgenerational transmission of the trait. In addition, AFLP markers were developed in the F1 population to identify genomic regions associated with the %AES. Cytoembryological analyses showed that the %AES was significantly influenced by different environments, but remained stable across the years. F1 and F2 progenies showed a wide range of %AES variation, but most hybrids were not significantly different from the parental genotypes. Maternal and paternal genetic linkage maps were built covering the ten expected linkage groups (LG). A single-marker analysis detected at least one region of 5.7 cM on LG3 that was significantly associated with apospory expressivity. Our results underline the importance of environmental influence in modulating apospory expressivity and identified a genomic region associated with apospory expressivity at the diploid level.

Keywords: Paspalum rufum; apospory expressivity; diploid level; environment; inheritance.


Conflict of interest statement

The authors declare no conflict of interest. The funders had no role in the design of the study; in the collection, analyses, or interpretation of data; in the writing of the manuscript, or in the decision to publish the results.

Figures

Figure 1
Figure 1
Apospory expressivity of the parental genotypes R6#45 and R5#49 (white boxes), and the F1-Z population (grey boxes), determined in Zavalla. The frequency of ovaries containing AES (box middle line) scored in each plant is plotted together with 95% confidence intervals (CI). The asterisks mark the hybrids that showed significant difference (p < 0.05) with respect to paternal genotype (p < 0.05), + symbol indicates genotypes without AES.
Figure 2
Figure 2
Apospory expressivity in P. rufum (A) diploid genotypes and (B) tetraploid individuals, assessed at the two locations. The frequency of ovaries containing AES (box middle line) scored in each plant is plotted together with 95% confidence intervals (CI). Boxes colored with different shades of grey indicate different genotypes; plain boxes represent measurements made in Corrientes, while striped boxes represent measurements made in Zavalla. Asterisks mark significant differences of the same genotype between different locations.
Figure 3
Figure 3
Apospory expressivity in diploid individuals of P. rufum measured during two annual periods in Zavalla. The frequency of ovaries containing AES (box middle line) scored in each plant is plotted together with 95% confidence intervals (CI). Boxes colored with different shades of grey indicate different genotypes; plain boxes represent measurements made during 2017, while striped boxes represent measurements made during 2018. No significant differences were detected between the two years.
Figure 4
Figure 4
Frequency of apospory expressivity of the two F2 offspring measured during 2017 (A) F2L and (B) F2H. The parental genotypes are in white boxes and hybrids in grey boxes. Asterisks indicate a significant difference (p < 0.05) of the progeny compared to the parental genotypes (p < 0.05). The frequency of ovaries containing AES (box middle line) scored in each plant is plotted together with 95% confidence intervals (CI). (C) Apospory expressivity variation of F1-Z (2016), F2L, and F2H progenies (2016 and 2017). Boxes represent the 95% confidence intervals (CI), the middle lines indicate the median value, outliers are marked by black circles, and different colors indicate significant differences between median values (p < 0.05).
Figure 5
Figure 5
Linkage map of the diploid (2n = 2x) maternal genotype of P. rufum (R6#45). Markers and distances in cM (Kosambi) are indicated on the right and left, respectively. Each co-segregation group includes SDAF and BSDF (starting with an X) markers in coupling and repulsion-phase (-).
Figure 6
Figure 6
Linkage map of the diploid (2n = 2x) paternal genotype of P. rufum (R5#49). Markers and distances in cM (Kosambi) are indicated on the right and the left respectively. Each co-segregation group includes SDAF and BSDF (starting with an X) markers in coupling and repulsion-phase (-).
Figure 7
Figure 7
Maternal (M) and paternal (P) homologous chromosomes identified by BSDF (starting with an X). Marker’s names and distances in cM (Kosambi) are indicated on the right and the left, respectively. The relative order of BSDF markers between both maps is indicated by horizontal lines.
Figure 8
Figure 8
Detail of the LG3 obtained after combining maternal and paternal LG3s. The circles indicate the markers associated with %AES, the open circles indicate the markers found in the F1-C, and the filled red circles are those found in the F1-Z. The red color on the LG marks a region delimited by a marker detected in F1-C and others detected in F1-Z.

Similar articles

Cited by

References

    1. Kumar S. Epigenetic control of apomixis: A new perspective of an old enigma. Adv. Plants Agric. Res. 2017;7:10-15406. doi: 10.15406/apar.2017.07.00243. - DOI
    1. Van Dijk P., Van Damme J. Apomixis technology and the paradox of sex. Trends Plant Sci. 2000;5:81–89. doi: 10.1016/S1360-1385(99)01545-9. - DOI - PubMed
    1. Koltunow A.M. Apomixis: Embryo sacs and embryos formed without meiosis or fertilization in ovules. Plant Cell. 1993;5:1425–1437. doi: 10.2307/3869793. - DOI - PMC - PubMed
    1. Toenniessen G.H. Feeding the world in the 21st century: Plant breeding, biotechnology, and the potential role of apomixis. In: Savidan Y., Carman J.G., Dresselhaus T., editors. The Flowering of Apomixis: From Mechanisms to Genetic Engineering. CIMMYT, IRD, European Commission DG VI (FAIR); Mexico City, Mexico: 2001. pp. 1–7.
    1. Whitton J., Sears C.J., Baack E.J., Otto S.P. The dynamic nature of apomixis in the angiosperms. Int. J. Plant Sci. 2008;169:169–182. doi: 10.1086/523369. - DOI

LinkOut - more resources