Comparative Study
. 2021 Oct 22;21(1):481.
doi: 10.1186/s12870-021-03271-4.

Genome wide association mapping for agronomic, fruit quality, and root architectural traits in tomato under organic farming conditions

Affiliations
Comparative Study

Genome wide association mapping for agronomic, fruit quality, and root architectural traits in tomato under organic farming conditions

Pasquale Tripodi et al. BMC Plant Biol. .

Abstract

Background: Opportunity and challenges of the agriculture scenario of the next decades will face increasing demand for secure food through approaches able to minimize the input to cultivations. Large panels of tomato varieties represent a valuable resource of traits of interest under sustainable cultivation systems and for genome-wide association studies (GWAS). For mapping loci controlling the variation of agronomic, fruit quality, and root architecture traits, we used a heterogeneous set of 244 traditional and improved tomato accessions grown under organic field trials. Here we report comprehensive phenotyping and GWAS using over 37,300 SNPs obtained through double digest restriction-site associated DNA (dd-RADseq).

Results: A wide range of phenotypic diversity was observed in the studied collection, with highly significant differences encountered for most traits. A variable level of heritability was observed with values up to 69% for morphological traits while, among agronomic ones, fruit weight showed values above 80%. Genotype by environment analysis highlighted the strongest genotypic effect for aboveground traits compared to root architecture, suggesting that the hypogeal part of tomato plants has been a minor objective for breeding activities. GWAS was performed by a compressed mixed linear model leading to 59 significantly associated loci, allowing the identification of novel genes related to flower and fruit characteristics. Most genomic associations fell into the region surrounding SUN, OVATE, and MYB gene families. Six flower and fruit traits were associated with a single member of the SUN family (SLSUN31) on chromosome 11, in a region involved in the increase of fruit weight, locules number, and fruit fasciation. Furthermore, additional candidate genes for soluble solids content, fruit colour and shape were found near previously reported chromosomal regions, indicating the presence of synergic and multiple linked genes underlying the variation of these traits.

Conclusions: Results of this study give new hints on the genetic basis of traits in underexplored germplasm grown under organic conditions, providing a framework for the development of markers linked to candidate genes of interest to be used in genomics-assisted breeding in tomato, in particular under low-input and organic cultivation conditions.

Keywords: Genome-wide association mapping; Genotype by environment; Organic farming; Phenotyping; Tomato.


Conflict of interest statement

The authors declare that they have no competing interests.

Figures

Fig. 1
Fig. 1
Overview of the phenotypic diversity of the collection studied. a Fruits on the plant and their diversity; b Leafy and not leafy inflorescence; c Flowers with exerted and inserted styles; d Variability for fruit size, shape, colour and green shoulder; e Puffiness and locules number; f Density of fine roots and radicular crown angle; g Type of inflorescence with mature fruits: uniparous and compound
Fig. 2
Fig. 2
Variation for morphological plant and fruit descriptors across cultivar groups in two locations. Stacked bars indicate the proportion of each class for the considered traits on a total scale 0–1. a-d Plant and flower traits; e-i Fruit traits. Details of measurement scale for each trait are in Supplementary Table 2. Locations: IT = Italy, ES = Spain; Cultivar groups: BL = breeding lines, CL = elite cultivars, LS = long shelf-life landraces, FC = landraces for fresh consumption, HL = heirloom varieties
Fig. 3
Fig. 3
Assessment of cultivar groups in Italy and Spain for (pseudo) qualitative agronomic traits. Histograms with error bars indicating ± standard deviations, showing average values for each cultivar group in each location. Qualitative measures are reported on the Y-axis for each trait. For all traits related to agronomic fruit quality, the scale varies from 1 (absent) to 7 (abundant); for pests and diseases in foliage, the scale varies from 1 (very scarce) to 9 (very severe). For cultivar group codes, see Fig. 2
Fig. 4
Fig. 4
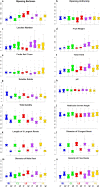
Quantitative agronomic and root trait characterization. Notched box-plots showing median values and quartiles for the different cultivar group in each location. The measurement scale for each trait is reported on the Y-axis, details in Supplementary Table 2. a-b ripening related traits; c-f yield related traits; g-i chemical traits; j-n root traits
Fig. 5
Fig. 5
Phenotypic variability of the 244 cultivated tomato genotypes. Scatter plot of the first (PC1) and second (PC2) principal components showing the variation for 31 pseudo-qualitative and quantitative morphological, agronomic and root traits scored in two environments. Based on cultivar groups, accessions are represented by different coloured symbols indicated in the legend. The first and second component centroids for each cultivar groups are indicated by filled yellow symbols with shape and edge colour according to cultivar groups (see legend). The direction from the centre of the biplot indicate how each trait contributes to the first two components. Trait acronyms are listed in Table 1
Fig. 6
Fig. 6
Spearman’s rank correlation coefficients between pairs of phenotypes. Correlation coefficients are indicated in each cell. Coloured correlations are those with P value < 0.05 after Bonferroni correction. Colour intensity is directly proportional to the coefficients. On the right side of the correlogram, the legend colour shows the correlation coefficients and the corresponding colours. Correlogram for traits scored in Spain is placed below the diagonal, the correlogram for traits scored in Italy is placed upside the diagonal. Trait acronyms are listed in Table 1
Fig. 7
Fig. 7
Genomic diversity of the cultivated tomato collection. a STRUCTURE analysis of 244 S. lycopersicum genotypes with 37,317 SNP markers in the case of five clusters (K). The vertical coordinates of each subpopulation indicate the membership coefficient for each individual; each vertical bar represents one genotype. The coloured blocks correspond to the different clusters. b Maximum likelihood phylogenetic tree (unrooted). The initial tree for the heuristic search was obtained automatically by applying Neighbor-Join and BioNJ algorithms to a matrix of pairwise distances estimated using the Tamura-Nei model, and then selecting the topology with superior log likelihood value. The tree with the highest log likelihood (− 1,427,221.59) is shown. Internal colours correspond to clusters K1 to K5 (see panel a). c PCoA visualization of the genetic relationships between members of the association panel. Coloured symbols in the phylogenetic tree and the PCoA represent accessions from different cultivar group indicated in the legend
Fig. 8
Fig. 8
Genome wide association analysis. a Circos plot diagram showing associations for 15 traits. The dashed red line indicates significant threshold (−log10 p-value). For each chromosome is showed the (SNP) density in the tomato collection. The legend scale indicates the number of SNPs within 1 Mbp window size. Significant peaks are represented by blue dots. Each trait is represented by a concentric circle: a) Growth Habit, b) Inflorescence, c) Style Position, d) Fruit Shape, e) Green Shoulder, f) Fruit Color, g) Puffiness, h) Ribbing Calyx End, i) Concentric Cracking, j) Blossom-end rot, k) Fruit fasciation, l) Locules Number, m) Fruit Weight, n) Soluble Solids, o) Diameter of the Main Root. b Significantly associated SNPs, their chromosomal position and cluster of variants on eight tomato chromosomes. Circles represent the association between one genetic variant and one trait. Colors distinguish phenotypes
Fig. 9
Fig. 9
The effect of SNPs falling within gene regions. Notched box-plots showing the phenotypic performances of traits due to associations within genes. Red boxplot indicates the major allele, green boxplot indicates the mutated minor allele

Similar articles

Cited by

References

    1. Anderson R, Bayer PE, Edwards D. Climate change and the need for agricultural adaptation. Curr Opin Plant Biol. 2020;56:197–202. - PubMed
    1. Le Campion A, Oury FX, Heumez E, Rolland B. Conventional versus organic farming systems: dissecting comparisons to improve cereal organic breeding strategies. Org Agr. 2020;10:63–74.
    1. The World of Organic Agriculture In: Statistics Sessions at BIOFACH 2020 Nürnberg, Germany. 2020. https://www.organic-world.net/yearbook/yearbook-2020.html. Accessed 20 June 2021.
    1. FAOSTAT 2019. http://www.fao.org/faostat/en/#home. Accessed 20 June 2021.
    1. Higashide T, Heuvelink E. Physiological and morphological changes over the past 50 years in yield components in tomato. J Am Soc Hortic Sci. 2009;134:460–465.

Publication types

LinkOut - more resources