Comparative Study
. 2021 Oct 19;37(3):109845.
doi: 10.1016/j.celrep.2021.109845.

Post-oral sensing of fat increases food intake and attenuates body weight defense

Affiliations
Comparative Study

Post-oral sensing of fat increases food intake and attenuates body weight defense

Molly R Gallop et al. Cell Rep. .

Abstract

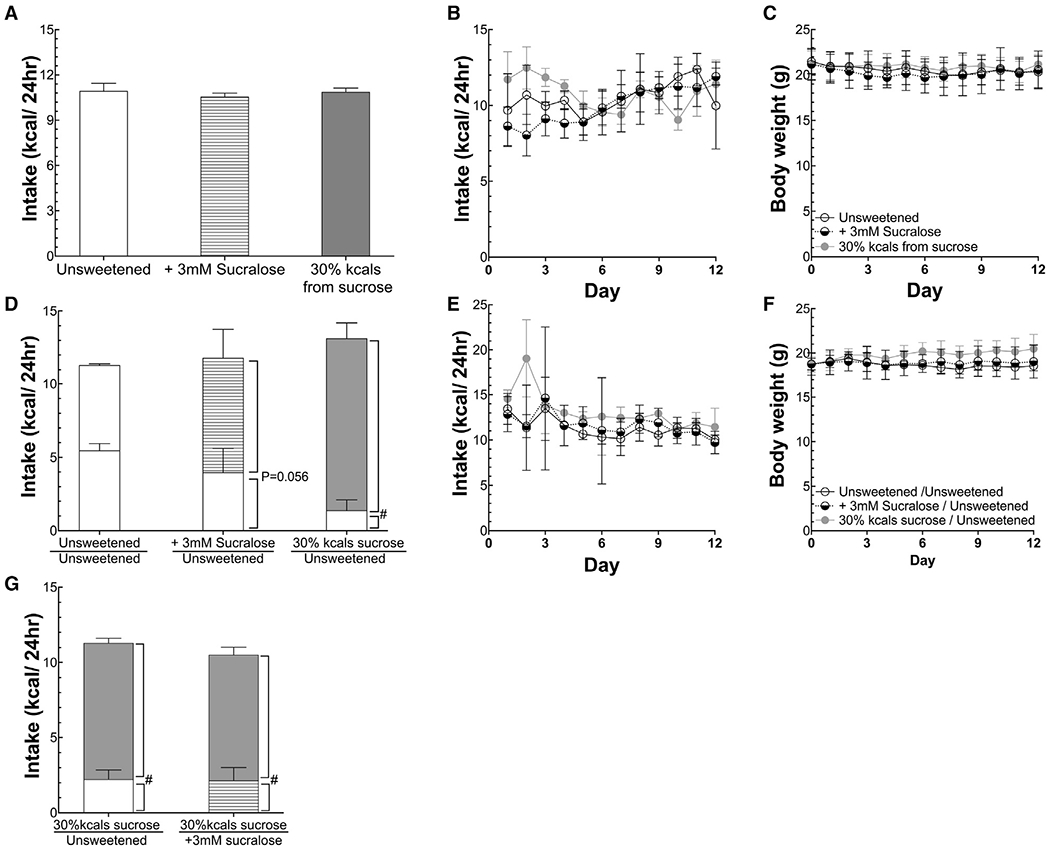
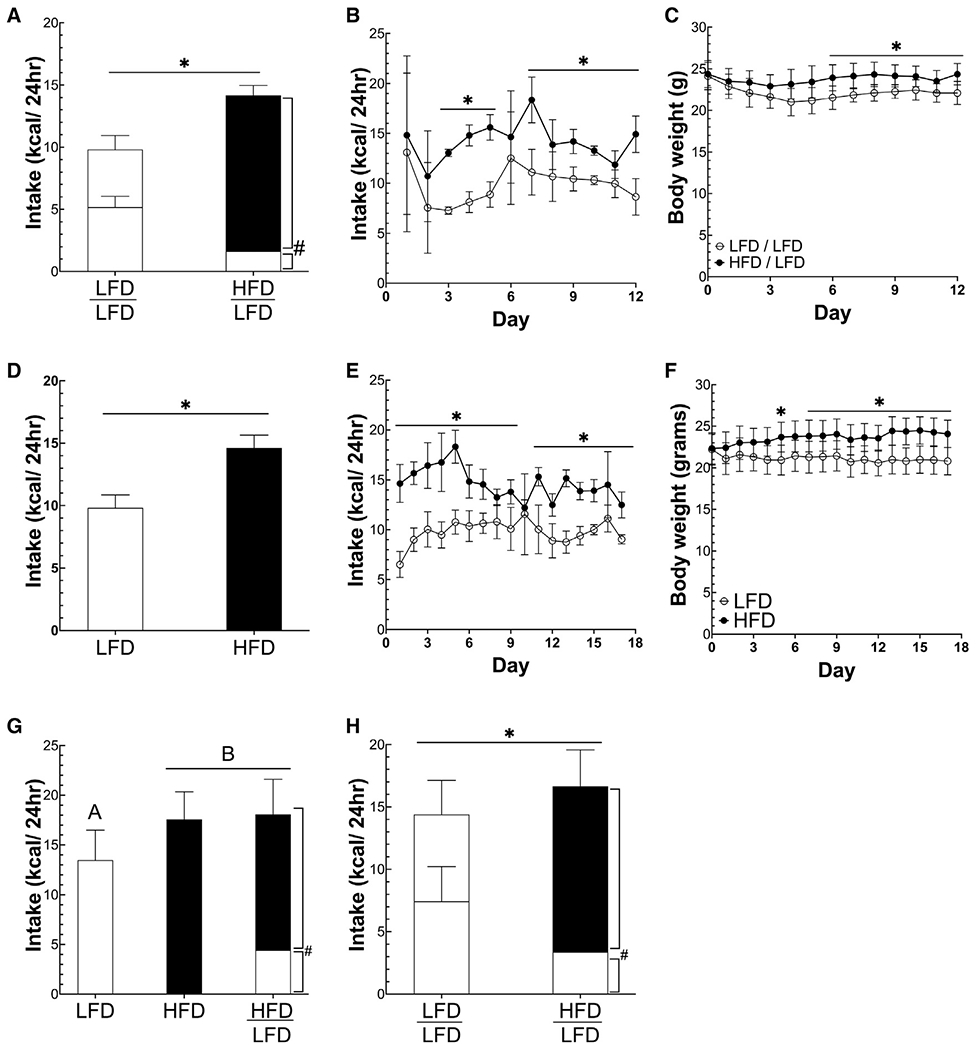
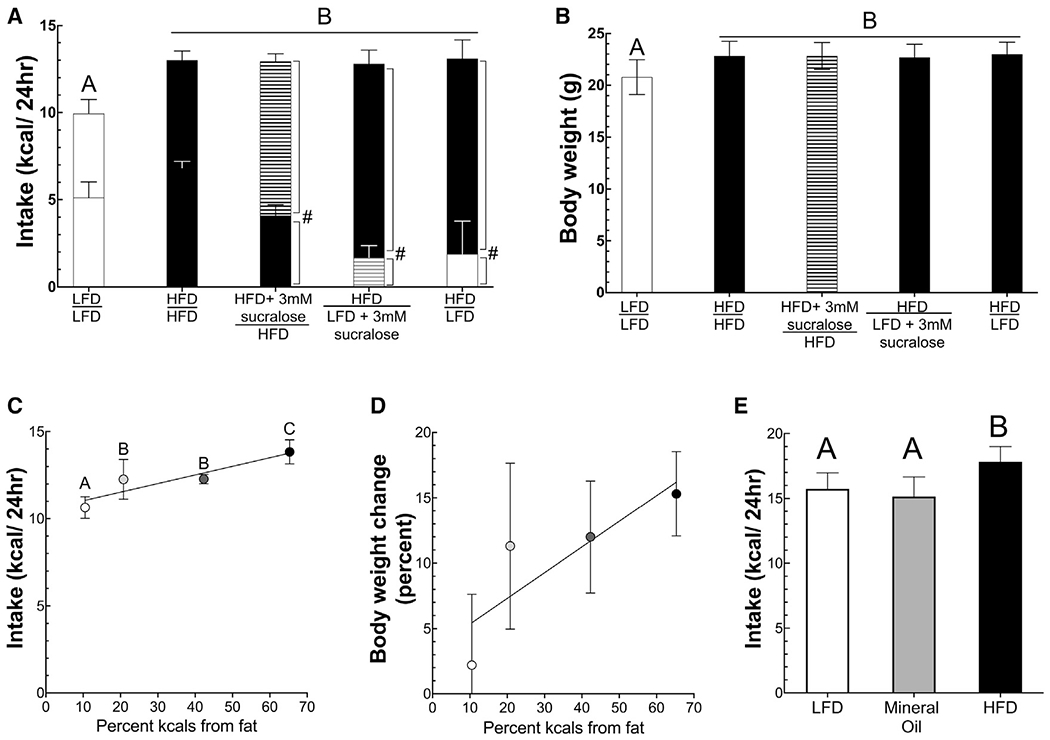
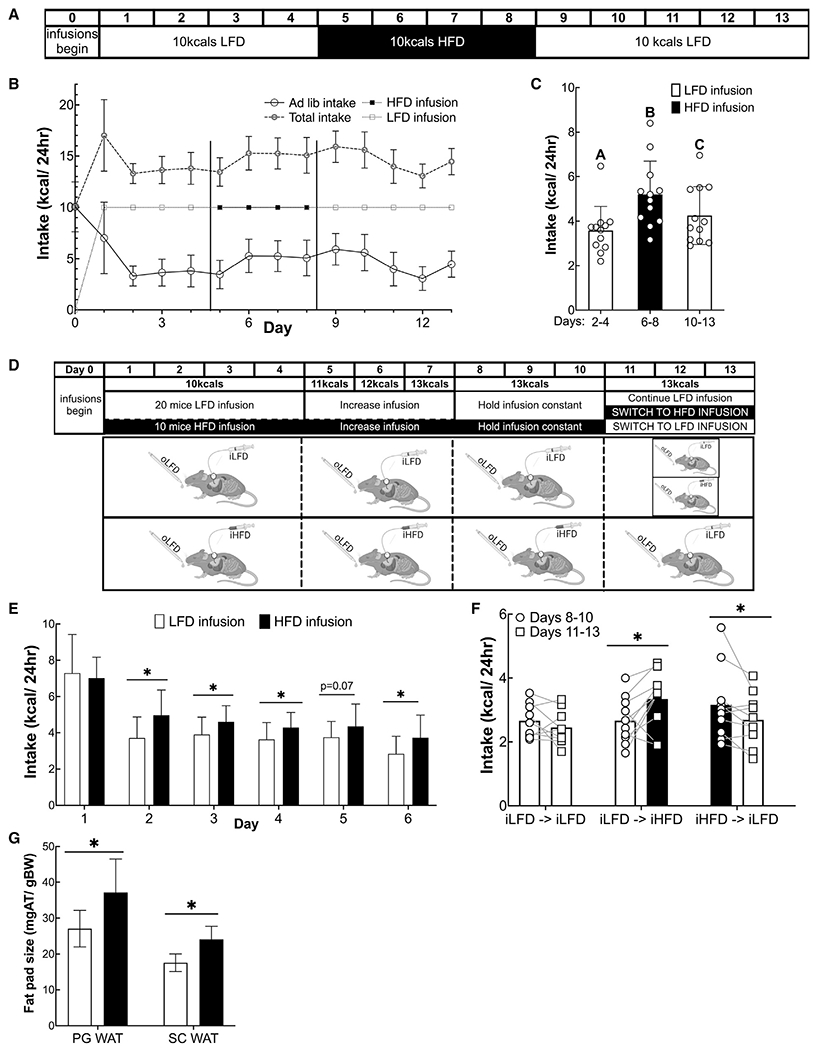
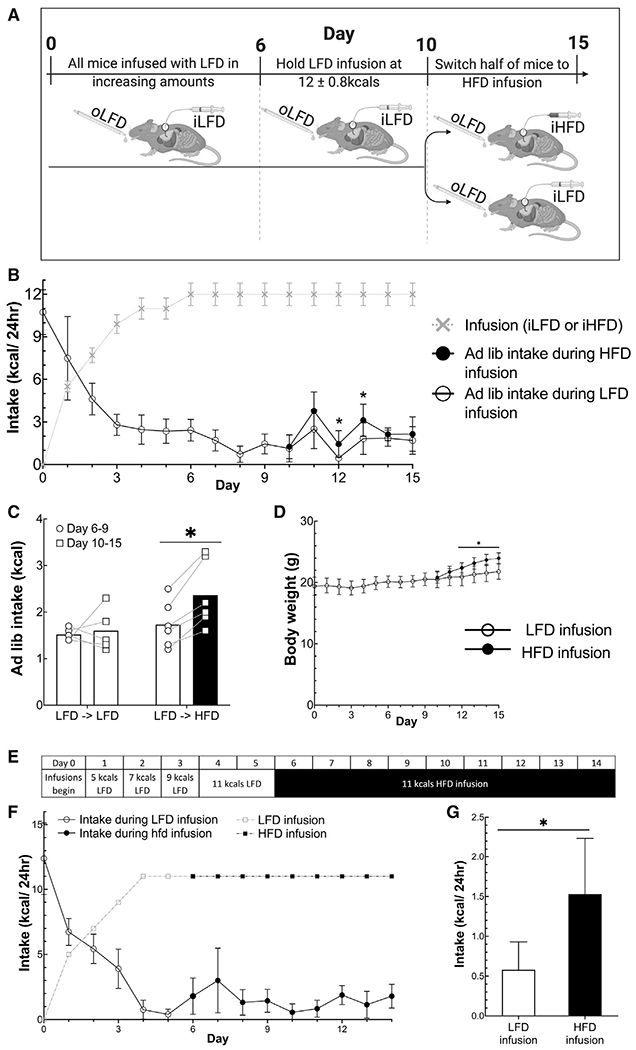
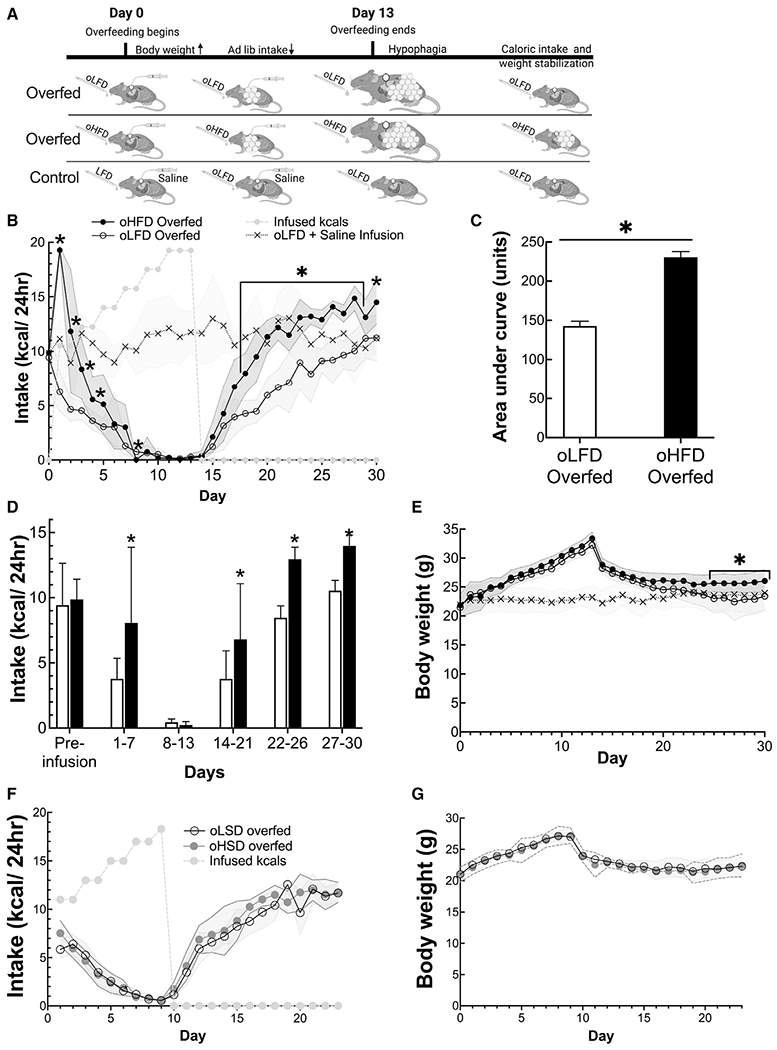
In mammals, changes in weight elicit responses that favor a return to one's previous weight and promote weight stability. It has been hypothesized that palatable sweet and high-fat foods disturb the defense of body weight, leading to weight gain. We find that increasing sweetness or percent calories from fat increases diet palatability but that only increases in nutritive fat content increase caloric intake and body weight. In a mouse model of overfeeding that activates weight defense, high-fat diets, but not sweetened diets, attenuate the defense of body weight, leading to weight gain. The ability of a palatable, high-fat diet to increase food intake does not require tasting or smelling the food. Instead, the direct infusion of a high-fat diet into the stomach increases the ad libitum intake of less palatable, low-fat food. Post-oral sensing of percent calories from fat modulates feeding behavior to alter weight stability.

Keywords: body weight defense; gastric infusion; high-fat diet; palatability; post-oral sensing; sweetened diet.


Conflict of interest statement

Declaration of interests A.W.F. is supported by a research grant from Boehringer-Ingelheim Pharmaceuticals. The authors declare no other competing interests.

Figures

Figure 1.
Figure 1.. Sweetened diets are more palatable than unsweetened diets but do not increase caloric intake or body weight
(A and B) Mean and daily caloric intake of mice provided sweetened and unsweetened diets ad libitum. (C) Body weight of mice in (A) and (B). (D) Mean caloric intake broken down by diet of mice simultaneously provided ad libitum both a sweetened and unsweetened diet. Mice offered only an unsweetened diet by two feeders served as controls. (E and F) Daily total caloric intake and body weight of mice in (D). (G) Mean caloric intake of mice simultaneously provided an unsweetened and sucrose-sweetened diet, and mean caloric intake of mice simultaneously provided dietssweetened with sucrose or the non-nutritive sweetener sucralose. Data are means ± standard deviation. #p < 0.05, comparing intake during the two-choice test. A paired t test was used for within-group analyses, and ANOVA was used for comparisons among groups. n = 5/group. The unshaded bars represent unsweetened intake; striped, gray bars represent sucralose-sweetened diet; and dark-gray bars represents 30% kcal sucrose diet.
Figure 2.
Figure 2.. Increasing percent calories from fat increases palatability and intake independent of protein or carbohydrate density
(A and B) Mean and daily caloric intake of mice offered either a low-fat diet (LFD; 10% of calories from fat) or a high-fat diet (HFD; 60% of calories from fat). (C) Daily body weight of mice offered either a LFD (10% of calories from fat) or a HFD (60% of calories from fat). (D and E) Mean and daily caloric intake of mice offered both a LFD and HFD or LFD. (F) Daily body weight of mice offered both a LFD and HFD or only LFD. (G) Caloric intake of mice offered either a LFD, HFD, or both HFD and LFD in which carbohydrate content was equal. (H) Caloric intake of mice offered both a HFD and LFD or only a LFD in which protein content was equal. *p < 0.05 between groups using Student’s t test, #p < 0.05 for diet within-group analyses using a paired t test. Different letters represent significant differences calculated using ANOVA to compare three groups. All data are presented as mean ± standard deviation. n = 5/group. Unshaded bars show LFD intake, and black bars represent HFD intake.
Figure 3.
Figure 3.. Density of digestible fat rather than taste preference regulates caloric intake
(A and B) Caloric intake and body weight among mice offered ad libitum access to several pairs of diets, including LFD and HFD supplemented with the sweetener sucralose. (A) Unshaded bars show unsweetened LFD intake, black bars show unsweetened HFD intake, striped black is sucralose-sweetened HFD, and striped gray is sucralose-sweetened LFD. (B) The bar shading corresponds to the more preferred diet as described above. (C and D) Caloric intake and percent change in body weight over 4 weeks on diets of differing fat content. (E) Caloric intake of mice fed either a LFD (10% calories from digestible fat), HFD (60% calories from digestible fat), or mineral oil diet (10% of calories from digestible fat but supplemented with mineral oil as described in the STAR Methods). Average intake from 6 days is shown. Bar shading in (E): unshaded is LFD, black is HFD, and gray is mineral oil diet. Data are presented as mean ± standard deviation. Different letters represent significant differences between groups. ANOVA with post hoc t tests using Benjamini-Hochberg correction was used for between-group statistical testing. #p < 0.05 for within-group diet preference by paired t test. .
Figure 4.
Figure 4.. Ad libitum caloric intake is regulated by percent calories from fat of food in the gastrointestinal tract
(A) Experimental design for data shown in (B) and (C) (n = 14). (B) Daily ad libitum and infused caloric intake, and total caloric intake. Vertical lines indicate when the infusion diets were switched. (C) Mean caloric intake during each infusion period excluding the first day of each period to allow for acclimation. Columns represent group averages, and open shapes are individual data points. Data are displayed as mean ± standard deviation. Different letters represent significantly different means as calculated with ANOVA and post hoc t test with a Benjamini-Hochberg correction. (D) Experimental design for data in (E)–(G) (n = 10–19/group in E and G; and in F, n = 9–10/group). Animals were infused with 10 kcals on days 1–4, and this amount was gradually increased to 13 kcals/day at which it remained for the rest of the experiment. On day 11, infused diets were switched from infused LFD (iLFD) to infused HFD (iHFD) or iHFD to iLFD, and the control group remained on iLFD. (E) Daily ad libitum intake over days 1–6. (F) Mean ad libitum intake days 8–10 compared to intake on days 11–13. (G) Epididymal fat mass as a fraction of total body weight. *p < 0.05 as calculated by Student’s t test in (E) and (G) or paired t test in (F).
Figure 5.
Figure 5.. Post-oral sensing of a HFD increases ad libitum caloric intake and body weight in the absence of oral taste sensing
(A) Design of the experiment for data in (B)–(E) in which all animals are given ad libitum access to oLFD. n = 5–6/group. (B) Infused kcals and ad libitum kcals consumed. (C) Average ad libitum intake during 11-kcals infusions with LFD or HFD. (D) Body weight during infusions. (E) Experimental design for (F) and (G) (n = 6). (F) Infused and ad libitum caloric intake. (G) Average intake of days 4–5 during iLFD compared with that of days 6–14 during iHFD. Data are displayed as mean ± standard deviation or as individual data points in (C). *p < 0.05, comparing iLFD diet group to iHFD using a Student’s t test except in (C) and (G) for which paired t tests were used for within-group comparisons. Unshaded bars show intake during iLFD while black bars show intake during iHFD.
Figure 6.
Figure 6.. Access to a HFD attenuates defense of body weight
(A) Experimental design showing the three groups and their ad libitum and infused diets. (B) Ad libitum caloric intake of overfed and control mice. (C) Total ad libitum caloric intake is greater in mice offered oHFD than mice offered oLFD as measured as area under the curves. (D) Ad libitum caloric intake during periods of overfeeding protocol. (E) Daily body weight of control, oLFD, and oHFD during overfeeding experiment. (F and G) Ad libitum caloric intake and body weight of mice that were overfed and had ad libitum oral access to low-sweetness diet (oLSD) or ad libitum access to an oral high-sweetness diet (oHSD). Data are presented as mean ± standard deviation shown by either error bars of the shaded regions in the line graphs. *p < 0.05, comparing the LFD and HFD overfed groups using a Student’s t test. Unshaded bars show oLFD intake, and black bars show intake during oHFD.

References

    1. Ackroff K, and Sclafani A (2014). Post-oral fat stimulation of intake and conditioned flavor preference in C57BL/6J mice: A concentration-response study. Physiol. Behav 129, 64–72. - PMC - PubMed
    1. Ahima RS, Prabakaran D, Mantzoros C, Qu D, Lowell B, Maratos-Flier E, and Flier JS (1996). Role of leptin in the neuroendocrine response to fasting. Nature 382, 250–252. - PubMed
    1. Alkerwi A, Crichton GE, and Hébert JR (2015). Consumption of readymade meals and increased risk of obesity: findings from the Observation of Cardiovascular Risk Factors in Luxembourg (ORISCAV-LUX) study. Br. J. Nutr 113, 270–277. - PMC - PubMed
    1. Bachmanov AA, Tordoff MG, and Beauchamp GK (2001). Sweetener preference of C57BL/6ByJ and 129P3/J mice. Chem. Senses 26, 905–913. - PMC - PubMed
    1. Baggio LL, and Drucker DJ (2007). Biology of incretins: GLP-1 and GIP. Gastroenterology 132, 2131–2157. - PubMed

Publication types