. 2021 Oct 19;37(3):109836.
doi: 10.1016/j.celrep.2021.109836.

Prolonged epigenomic and synaptic plasticity alterations following single exposure to a psychedelic in mice

Affiliations

Prolonged epigenomic and synaptic plasticity alterations following single exposure to a psychedelic in mice

Mario de la Fuente Revenga et al. Cell Rep. .

Abstract

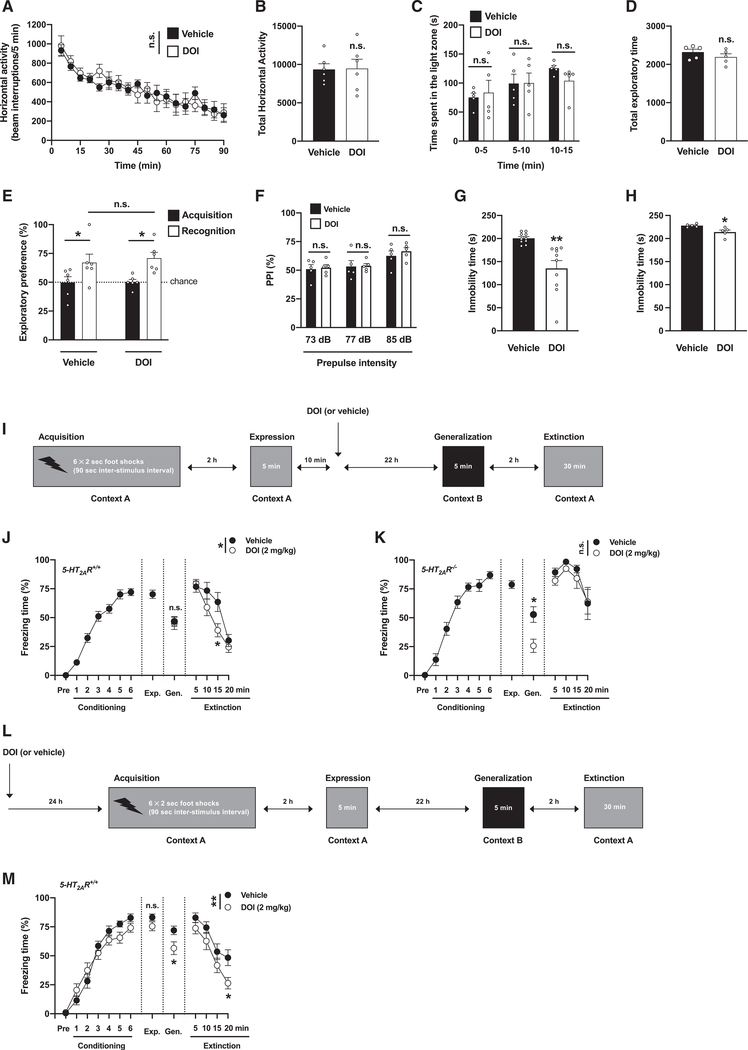
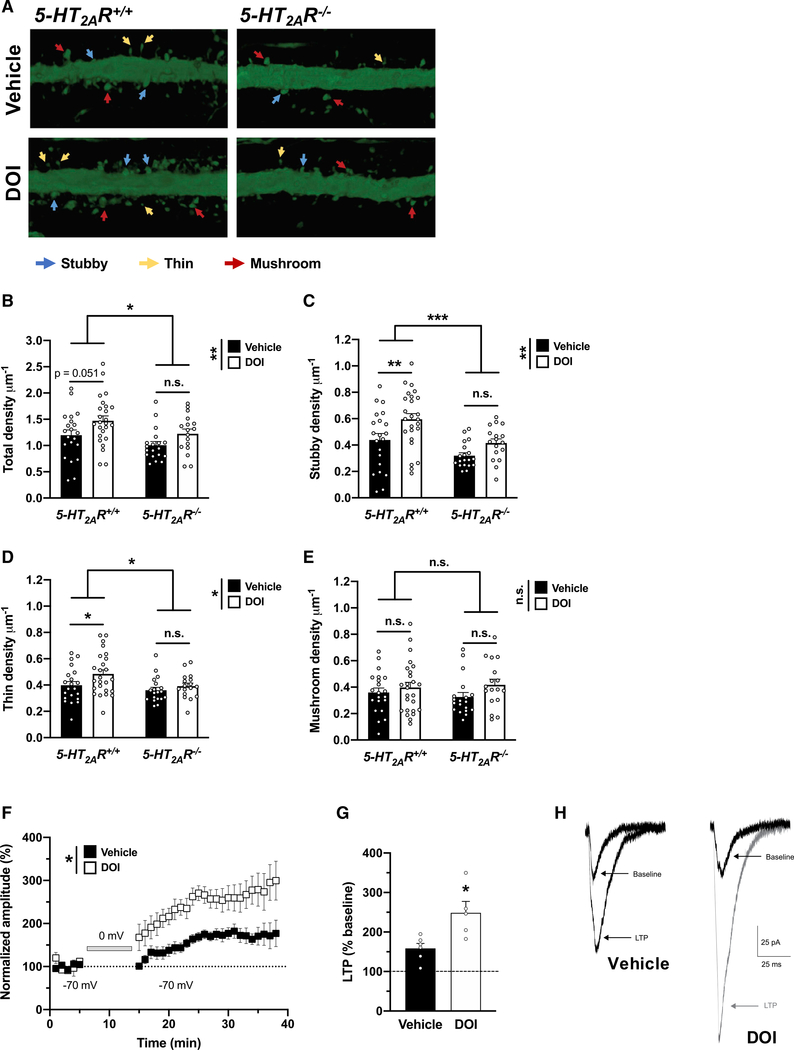
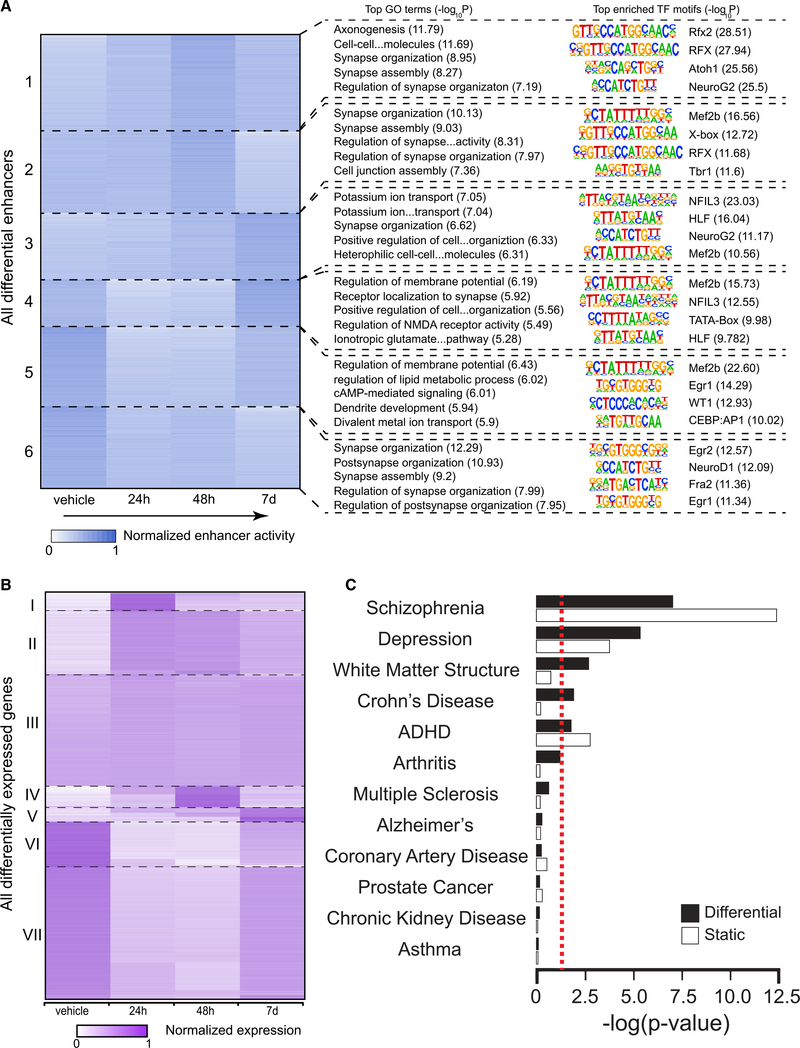
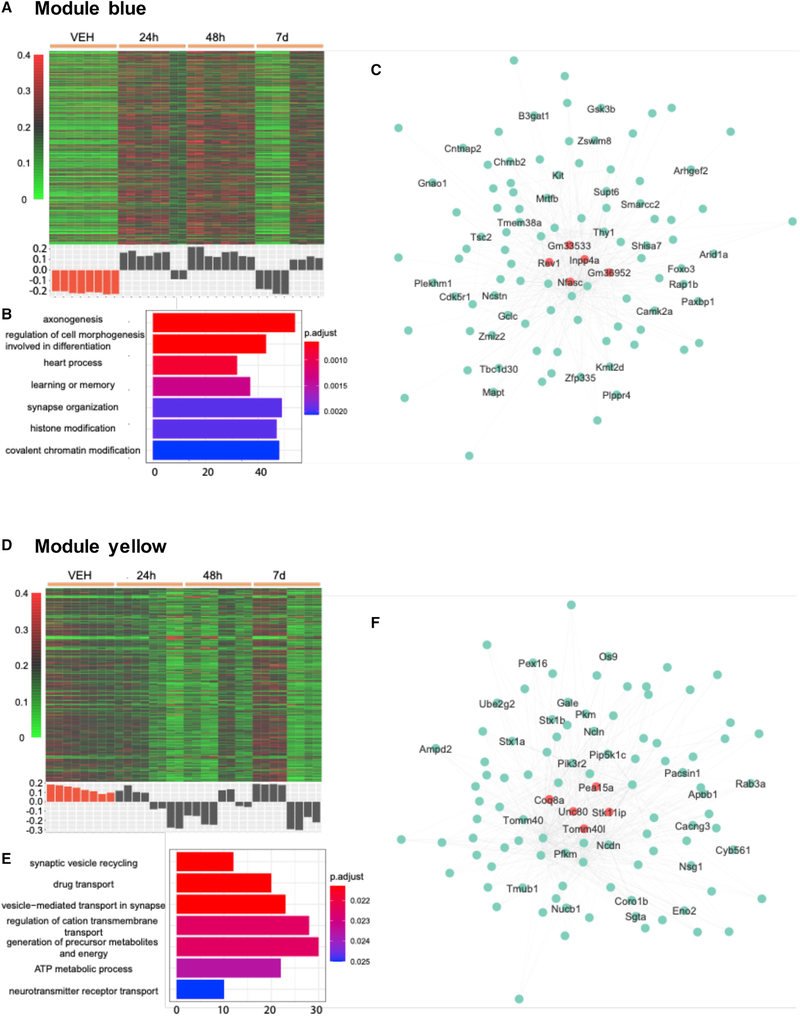
Clinical evidence suggests that rapid and sustained antidepressant action can be attained with a single exposure to psychedelics. However, the biological substrates and key mediators of psychedelics' enduring action remain unknown. Here, we show that a single administration of the psychedelic DOI produces fast-acting effects on frontal cortex dendritic spine structure and acceleration of fear extinction via the 5-HT2A receptor. Additionally, a single dose of DOI leads to changes in chromatin organization, particularly at enhancer regions of genes involved in synaptic assembly that stretch for days after the psychedelic exposure. These DOI-induced alterations in the neuronal epigenome overlap with genetic loci associated with schizophrenia, depression, and attention deficit hyperactivity disorder. Together, these data support that epigenomic-driven changes in synaptic plasticity sustain psychedelics' long-lasting antidepressant action but also warn about potential substrate overlap with genetic risks for certain psychiatric conditions.

Keywords: 5-HT2A receptor; GPCR; depression; epigenomics; hallucinogens; psychedelics; psychosis; schizophrenia; serotonin (5-HT); synaptic plasticity.


Conflict of interest statement

Declaration of interests J.G.-M. has a sponsored research contract with NeuRistic, and M.d.l.F.R. has a consulting agreement with Noetic. The remaining authors declare that they have no conflict of interest.

Figures

Figure 1.
Figure 1.. Post-acute effects of DOI on passivity and fear extinction
(A–H) Behavior was tested 24 h (A-G) or 7 days (H) after a single injection (i.p.) of DOI (2 mg/kg) or vehicle. (A and B) Lack of effect of DOI on exploratory behavior in an open field (n = 6 mice per group). Time-course (A, F[1,10] = 0.006, p > 0.05) and total horizontal activity (B, t10 = 0.07, p > 0.05). (C and D) Lack of effect of DOI on dark-light choice test (n = 5 mice per group). Time (s) spent in the light zone (C, F[1,8] = 0.08, p > 0.05) and total exploratory time during the 15-min test (D, t8 = 1.14, p > 0.05). (E) Lack of effect of DOI on the novel-object recognition test (n = 6 mice per group, acquisition versus recognition, F[1,20] = 13.06, p < 0.01; vehicle versus DOI, F[1,20] = 0.16, p > 0.05). (F) Lack of effect of DOI on the PPI of startle (n = 5 mice per group, F[1,24] = 0.41, p > 0.05). (G) Reduction of immobility time (s) during the last 4 min of the 6-min forced swimming test (10 mice per group, t18 = 3.80; p < 0.01). (H) Reduction of immobility time (s) during the last 4 min of the 6-min forced swimming test (5 mice per group, t8 = 2.96; p < 0.05). (I–K) Effect of DOI on contextual fear extinction in 5-HT2AR+/+ (J) and 5-HT2AR−/− (K) mice. Timeline of the experimental design (I). Fear conditioning (J, n = 26 mice, F[6, 175] = 73.69, p < 0.001; K, n = 12 mice, F[6, 77] = 58.76, p < 0.001), generalization (J, n = 11–15 mice per group, t24 = 0.24, p > 0.05; K, n = 6 mice per group, t10 = 3.04, p < 0.05), extinction (J, n = 11–15 mice per group, F[1, 96] = 5.51, p < 0.05; K, n = 6 mice per group, F[1, 40] = 2.29, p > 0.05). (L and M) Effect of DOI on fear acquisition. Timeline of the experimental design (L). Fear conditioning (n = 14–15 mice per group; conditioning, F[6,189] = 95.86, p < 0.001; vehicle versus DOI, F[1,189] = 0.91, p > 0.05), expression (n = 14–15 mice per group, t27 = 1.61, p > 0.05), generalization (n = 14–15 mice per group, t27 = 2.34, p < 0.05), extinction (n = 14–15 mice per group; extinction, F[3,104] = 20.17, p < 0.001; vehicle versus DOI, F[1,104] = 10.65, p < 0.01) (M). Statistical analysis was performed using two-way repeated-measures ANOVA (A), two-way ANOVA with Sidak’s multiple comparison test (C, E, F, J, K, and M), or Student’s t test (B, D, G, H, J, K, and M). *p < 0.05, **p < 0.01, ***p < 0.001, n.s., not significant. Error bars represent SEM.
Figure 2.
Figure 2.. Post-acute effects of DOI on frontal cortex synaptic plasticity
(A–E) Effect of DOI on synaptic structural elements in the frontal cortex of 5-HT2AR+/+ and 5-HT2AR−/− mice (n = 17–25 dendrites from independent neurons from both hemispheres in 3–4 mice per group). Samples were collected 24 h after a single injection (i.p.) of DOI (2 mg/kg) or vehicle. Representative three-dimensional reconstructions of AAV-injected cortical dendritic segments (A). Total (B), 5-HT2AR+/+ versus 5-HT2AR−/− mice, F[1,78] = 5.72, p < 0.05; vehicle versus DOI, F[1,78] = 7.31, p < 0.01), stubby (C), 5-HT2AR+/+ versus 5-HT2AR−/− mice, F[1,78] = 13.56, p < 0.001; vehicle versus DOI, F[1,78] = 9.65, p < 0.01), thin (D), 5-HT2AR+/+ versus 5-HT2AR−/− mice, F[1,78] = 5.27, p < 0.05; vehicle versus DOI, F[1,78] = 4.28, p < 0.05), mushroom (E), 5-HT2AR+/+ versus 5-HT2AR−/− mice, F[1,78] = 0.03, p > 0.05; vehicle versus DOI, F[1,78] = 2.90, p > 0.05). (F–H) A single dose (i.p) of DOI (2 mg/kg) significantly enhanced cortical LTP in comparison with saline-injected mice assayed 24-h post-injection. Normalized EPSC amplitudes obtained from whole-cell patch-clamp recordings of L2/3 neurons from either DOI-injected (n = 5 neurons from 5 mice) or vehicle-injected (n = 6 neurons from 5 mice) animals. LTP was induced by a protocol that pairs extracellular presynaptic stimulation of L4 neurons with brief (10 min) postsynaptic depolarization of overlying L2/3 neurons to 0 mV (gray bar). Symbols represent EPSCs averaged by 1-min bins (vehicle versus DOI, F[1,10] = 9.84, p < 0.05) (F). Average magnitude of LTP (normalized EPSCs recorded over the 15- to 40-min post-induction period) from DOI-treated mice and controls (t9 = 3.05, p < 0.05) (G). Representative traces of EPSCs recorded from L2/3 neurons from DOI- or vehicle-treated mice at baseline and following induction of LTP (H). Statistical analysis was performed using two-way ANOVA with Sidak’s multiple comparison test (B–E), two-way repeated-measures ANOVA (F), or Student’s t test (G). *p < 0.05, **p < 0.01, ***p < 0.001, n.s., not significant. Error bars represent SEM.
Figure 3.
Figure 3.. Post-acute effects of DOI on frontal cortex epigenomic and transcriptomic variations
(A) Effect of DOI on time-lapse epigenomic variations in neuronal nuclei of the mouse frontal cortex. K-means clustering of differential enhancers based on normalized H3K27ac signal (n = 3,995; Cluster sizes from top to bottom: 852, 718, 585, 419, 700, and 721). The top-five enriched biological process gene ontology (GO) terms identified by clusterprofiler are listed next to each cluster, and the top four motifs enriched in each cluster are listed next to the GO terms together with their sequences (n = 6 mice per group). (B) K-means clustering of normalized gene expression (n = 13,605). Cluster sizes from top to bottom: 604, 2,120, 3,748, 708, 497, 1,507, 4,421. (C) Significance of overlaps between differential and static H3K27ac peaks and NHGRI-EBI GWAS SNP sets. Significance is calculated using a null distribution and is shown as uncorrected –log(p value). The red dotted line denotes p < 0.05 cutoff. GWAS sets are ordered according to significance associated with the differential peaks.
Figure 4.
Figure 4.. Two gene co-expression modules (blue and yellow) associated with administration of DOI
(A and D) Heatmap of normalized gene expression profiles in the co-expression module (top). The module eigengene values across samples in four experimental groups (bottom). (B and E) Selected top categories from GO enrichment analysis. (C and F) Visualization of the intramodular connections among the top 100 hub genes in each module. The top 5 genes are in large size and colored orange. The genes involved in the top 15 GO terms are labeled.

References

    1. Anju TR, and Paulose CS (2011). Amelioration of hypoxia-induced striatal 5-HT(2A) receptor, 5-HT transporter and HIF1 alterations by glucose, oxygen and epinephrine in neonatal rats. Neurosci. Lett. 502, 129–132. - PubMed
    1. Babinski DE, Neely KA, Ba DM, and Liu G (2020). Depression and Suicidal Behavior in Young Adult Men and Women With ADHD: Evidence From Claims Data. J. Clin. Psychiatry 81, 19m13130. - PMC - PubMed
    1. Bale TL, Abel T, Akil H, Carlezon WA Jr., Moghaddam B, Nestler EJ, Ressler KJ, and Thompson SM (2019). The critical importance of basic animal research for neuropsychiatric disorders. Neuropsychopharmacology 44, 1349–1353. - PMC - PubMed
    1. Bastle RM, and Maze I (2019). Chromatin Regulation in Complex Brain Disorders. Curr. Opin. Behav. Sci. 25, 57–65. - PMC - PubMed
    1. Benjamini Y, and Hochberg Y (1995). Controlling the False Discovery Rate: A Practical and Powerful Approach to Multiple Testing. J. R. Stat. Soc. B 57, 289–300.

Publication types

MeSH terms