. 2021 Oct 22;12(1):6138.
doi: 10.1038/s41467-021-26410-9.

A human multi-lineage hepatic organoid model for liver fibrosis

Affiliations

A human multi-lineage hepatic organoid model for liver fibrosis

Yuan Guan et al. Nat Commun. .

Abstract

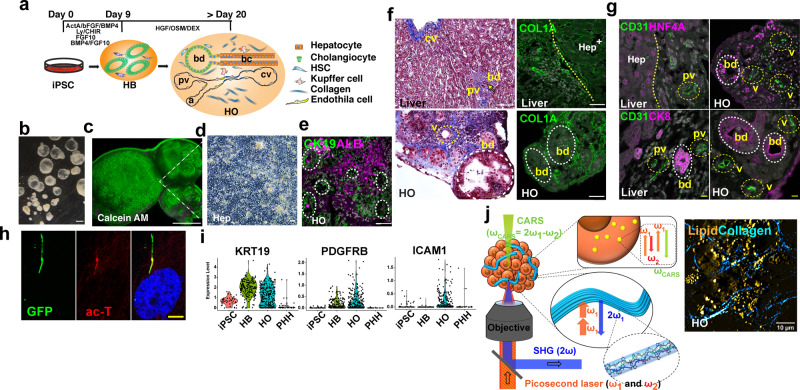
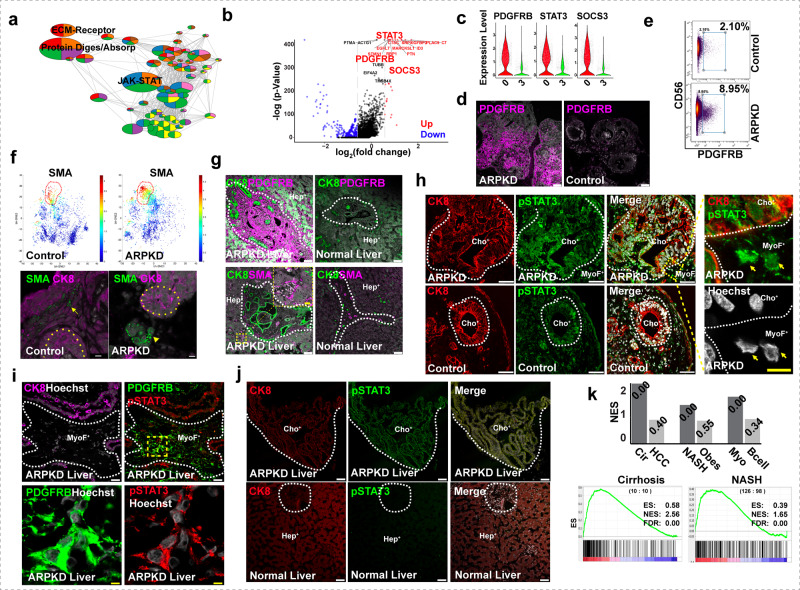
To investigate the pathogenesis of a congenital form of hepatic fibrosis, human hepatic organoids were engineered to express the most common causative mutation for Autosomal Recessive Polycystic Kidney Disease (ARPKD). Here we show that these hepatic organoids develop the key features of ARPKD liver pathology (abnormal bile ducts and fibrosis) in only 21 days. The ARPKD mutation increases collagen abundance and thick collagen fiber production in hepatic organoids, which mirrors ARPKD liver tissue pathology. Transcriptomic and other analyses indicate that the ARPKD mutation generates cholangiocytes with increased TGFβ pathway activation, which are actively involved stimulating myofibroblasts to form collagen fibers. There is also an expansion of collagen-producing myofibroblasts with markedly increased PDGFRB protein expression and an activated STAT3 signaling pathway. Moreover, the transcriptome of ARPKD organoid myofibroblasts resemble those present in commonly occurring forms of liver fibrosis. PDGFRB pathway involvement was confirmed by the anti-fibrotic effect observed when ARPKD organoids were treated with PDGFRB inhibitors. Besides providing insight into the pathogenesis of congenital (and possibly acquired) forms of liver fibrosis, ARPKD organoids could also be used to test the anti-fibrotic efficacy of potential anti-fibrotic therapies.


Conflict of interest statement

The authors declare no competing interests.

Figures

Fig. 1
Fig. 1. A human multi-Lineage Hepatic Organoid model forms complex structures that resemble those in human liver.
a A schematic representation of the in vitro culture system that directs IPSC to differentiate into HOs. The following structures are indicated in the images: cv, central vein; pv, portal vein; and bd, bile duct; bc, bile canaliculus; a, artery. b A low power, bright field view of HOs obtained after 21 days of differentiation. Scale bar is 500 μm. c Calcein AM staining indicates that cells within an organoid are viable, Scale bar is 500 μm. d A high-power bright field image of the region indicated in (c) shows the polygonal hepatocyte morphology of the cells within a HO. These cells also have lipid vesicles, which appear as bright areas. e Immunostaining shows Albumin+ hepatocytes and CK19+ cholangiocytes within the HOs. The dotted circles indicate bile ducts. Scale bar is 50 μm. f Left: Trichrome staining shows the some of the structures present in normal liver (top) are also present in HOs (bottom). Right: Immunostaining shows that collagen is present in peri-ductal and vascular areas. The yellow dotted line delineates an area with hepatocytes (Hep+) in normal liver. Scale bars are 50 μm. g HOs were immunostained with antibodies to endothelial cell (CD31), and hepato-biliary (HNF4A, CK8) markers. Structures resembling bile ducts (bd), portal vein (pv), and venules (v) are present in HOs. Scale bars are 50 μm. h A primary cilium in a day 21 HO was visualized with an ARL13B-GFP fusion protein (GFP), and by immunostaining with acetylated tubulin (ac-T). Scale bar is 5 μm. i scRNA-seq data indicates that HOs express multi-lineage markers, which include CK19 (Cholangiocyte), PDGFRB (hepatic stellate cells), and ICAM1 (endothelial cells). j Left: A schematic diagram of SHG and CARS microscopic imaging of a HO with collagen fibers (cyan). Two excitation beams at frequencies ω1 and ω2 were focused on the sample by a high-numerical aperture (1.45, ×100) objective. The endogenous SHG signal, constructively built up at double the 2ω1 frequency and emitted from the non-centrosymmetric collagen fibers (as shown in the inset), was collected in back-reflection mode. The CARS signal emitted at ωCARS = 2ω1 − ω2 by the intracellular lipid stores (as shown in the insert) was simultaneously collected in transmission mode. Right: A merged CARS/SHG image of a day 21 control hepatic organoid. The lipids are yellow, and the collagen fibers are cyan colored. Scale bar, 10 μm.
Fig. 2
Fig. 2. ARPKD organoids develop characteristic features of ARPKD liver disease.
a Left: A diagram shows how a piggyBac transposon and CRISPR/Cas9 were used to achieve seamless genome editing of iPSC lines to introduce a homozygous ARPKD mutation (PKHD136Met). Right: iPSCs from 3 normal donors were modified to produce isogenic ARPKD iPSC lines, which enable comparisons to be made between isogenic control and mutant lines as well as between the lines generated from different donors. b, d HOs prepared from control (C1–3) or corresponding ARPKD (A1–3) iPSCs were stained with H&E (b) or Trichrome (d). The trichrome stain shows the marked increase in collagen-rich connective tissue (blue regions, indicated by arrows) that appeared throughout all ARPKD HOs. Control organoids had a thin layer of connective tissue (indicated by arrowheads) located at the organoid periphery. The dotted circles surround bile ducts. Scale bars are 100 μm. c, e The total area fraction within control and ARPKD HOs occupied by bile ducts (H&E stain, n = 20 per group, C1 vs A1 p = 1.2 × 10−13, C2 vs A2 p = 4.5 × 10−13, C3 vs A3 p = 1.5 × 10−14) or collagen (trichrome, n = 20 per group, C1 vs A1 p = 2.2 × 10−13, C2 vs A2 p = 3.3 × 10−12, C3 vs A3 p = 7.2 × 10−14). f, g HOs were immunostained with COL1A, CK8, CK19, HNF4A, and Albumin (ALB) antibodies. A marked increase in collagen is seen in ARPKD organoids. CK8 counterstaining indicates the marked increase in the size and number of ductal structures within the ARPKD organoids. In (g), the ducts in control organoids have a simple columnar CK19+ epithelium (indicated by arrows), while the ductal epithelium in ARPKD organoids is thickened (arrowheads) and abnormal. Scale bars are 50 μm. h HOs were immunostained with antibodies to ZO-1 and HNF4A, EZRIN and CK19. While control organoids have a localized pattern of ZO-1 and EZRIN expression that surrounds the apical side of the duct lumen; expression in ARPKD organoids is diffuse and is not oriented around the ducts. i HOs were immunostained with antibodies to VANGL1 and CK19. VANGL1 is highly expressed in CK19+ cells in control HOs, but its expression is decreased, and it is expressed more diffusely in the cytoplasm of cells in ARPKD organoids. j The level of expression of multiple mRNAs associated with PCP (FZD6, CELSR1, VANGL2, PRICKLE2, DVL2) or primary cilium (ARL13B, PKD2, PKD1, PKDH1) are decreased in ARPKD organoids relative to their isogenic control organoids, while the percentages of cells expressing each of these mRNAs are not altered. k Top: Transverse views of ARL13B:GFP fusion protein expression were constructed from 10 stacked images obtained from each control and ARPKD organoid. Bottom: Representative images show the cilia structure within individual cells in control and ARPKD HOs. Scale bar is 5 μm. l A graph showing the percentage of cells with primary cilium in control (C1, C2, C3) and ARPKD organoids (A1, A2, A3). These box plots show measurements made on >100 stacked images (n = 3 per group, C1 vs A1 p = 0.0039, C2 vs A2 p = 0.016, C3 vs A3 p = 0.001). Box plots in c, e, and l (center line, median; box limits, upper and lower quartiles; whiskers, 1.5 × interquartile range). Statistical differences between the groups were determined by unpaired two-tailed t-test. *p < 0.05; **p < 0.01; and ***p < 0.001.
Fig. 3
Fig. 3. ARPKD liver tissue has enlarged bile ducts and increased collagen.
Liver sections were prepared from a normal and from two subjects with ARPKD liver disease. a In the H&E (upper) and trichrome-stained liver sections (middle), the marked increase in ECM (blue regions) in ARPKD liver tissue is readily apparent. Scale bars: 500 μm. Bottom panels: Higher power (scale bars, 50 μm) immunofluorescent images of liver sections stained with anti-CK8 and anti-collagen (COL1A) antibodies. CK8 is a marker for both hepatocytes and cholangiocytes. In normal liver, some collagen is deposited around the portal triads; and the inset shows an enlarged view of a portal triad. In ARPKD liver, there is a marked increase in the amount of collagen, which is diffusely distributed throughout the stroma; and the abnormal bile ducts lined by CK8+ cells are readily apparent. b SHG analysis of the collagen fibers in human HOs. (upper) Depth color-coded projections of collagen fibers within day 21 control and ARPKD organoids. Control organoids (left) have a few, isolated regions with relatively thin collagen fibers. ARPKD organoids (right) have a confluent network of thick collagen fibers that extend throughout the entire organoid. (lower) Quantitative comparison of SHG images from ARPKD and control organoids (n = 10 for C1, C2, C3; and for a mixed culture of all three) shows statistically significant increases in total collagen abundance (left), and in the fraction of thick collagen fiber bundles (right, diameter > 6.0 μm). Unpaired t-test results for collagen abundance (C1: ARPKD vs control p < 0.0001, C2: ARPKD vs control p < 0.0001, C3: ARPKD vs control p = 0.0136, Mix: ARPKD vs control p < 0.0001). Unpaired t-test results for fraction of thick collagen fiber bundles (C1: ARPKD vs control p < 0.0001, C2: ARPKD vs control p < 0.0001, C3: ARPKD vs control p = 0.006, Mix: ARPKD vs control p = 0.0003) c SHG analysis of liver tissue obtained from control and two ARPKD patients. In these images, the collagen fibers are blue; DAPI-stained nuclei are magenta; and CK8+ cholangiocytes are green. The amount of fibrous collagen is significantly increased in the ARPKD liver samples (13.3 ± 10.6%, n = 47) vs. normal liver tissue (1.8 ± 2.3%, n = 38). Unpaired t-test results p = 2 × 10−9. Also, the collagen fibers in the ARPKD liver tissue formed thick bundles (right, diameter > 6.0 μm, unpaired t-test ARPKD vs health liver p = 2 × 10−8), which are much larger than the ~1 micron-sized, isolated fibers present in the normal liver tissue (see insets). *p < 0.05, **p < 0.01, ***p < 0.001.
Fig. 4
Fig. 4. scRNA-Seq analysis of HOs.
a A combined t-SNE plot of the ARPKD and control organoid scRNA-Seq data shows the cell types within the 15 different clusters identified by k-nearest neighbor analysis, which include: various types of mesenchymal cells (Mes; clusters 0, 1, 3, 4, 6, 7), mesothelia (Meso; cluster 2), hepatocyte precursors (Hep pre; cluster 5), early endothelia (eEC, clusters 8, 9), cholangiocytes (Cho; cluster 10), and endothelia (EC; cluster 14). The heatmap compares the percentages of cells within each cluster present in control and ARPKD organoids. The colors represent the log-transformed percentage of cells within each cluster. The cell types are listed in Table S1 and were annotated as described in Table S2. b t-SNE plots separately show the 15 clusters identified in control and ARPKD organoids. c The developmental trajectories of ARPKD and isogenic control cells are similar at the iPSC (day 0) and hepatoblast (HB, day 9) stages, but differ significantly at the organoid (day 21) stage. The left graph shows the cells in ARPKD and isogenic control cultures at the iPSC, HB and hepatic organoid stages. The ARPKD and isogenic control cells are separately graphed (middle, right). Each cell cluster in the organoids is indicated by a color, while the iPSC and HB cells are gray. The ARPKD and isogenic control cells are very similar at the iPSC and HB stages, but significantly diverge at the organoid stage. As examples, clusters 0 and 1 are far more abundant in ARPKD than in control organoids; while clusters 3 and 4 are far more abundant in control organoids; and cluster 9 is present in ARPKD, but not in control organoids. d Violin plots show the increased level of expression of mRNAs for liver progenitor cell (SOX9, 2.1-fold; KRT17, 5.3-fold) and cell proliferation (CDKN1A, 3.2-fold; CDKN2B, 1.9-fold) markers in ARPKD relative to control cholangiocytes (cluster 10). e, f Control and ARPKD HOs were immunostained with antibodies to SOX9 and HNF4A or with anti-CK8 and anti-Ki67 antibodies. Scale bars are 50 μm. The dashed lines separate areas with hepatocytes (Hep+) or cholangiocytes (Cho+) from other regions. The boxplot shows the fraction of Ki67+ cholangiocytes within 3 pairs of ARPKD and isogenic control HOs (n = 20 per group, C1 vs A1 p < 2.22 × 10−16, C2 vs A2 p = 2.4 × 10−16, C3 vs A3 p < 2.22 × 10−16. ***p < 0.001). Box plots in f (center line, median; box limits, upper and lower quartiles; whiskers, 1.5 × interquartile range). g CK19 and JAG1 expression increased in ARPKD organoids. bhSNE maps of CyToF data generated using ARPKD and control HOs. The dotted circle shows the JAG1+ cell population.
Fig. 5
Fig. 5. ARPKD HOs have an expanded population of myofibroblasts that resemble those in fibrotic human liver tissue.
a KEGG pathway enrichment analysis identifies 3 gene networks whose expression is most increased in cluster 0 cells: protein digestion and adsorption, JAK-STAT signaling, and extracellular matrix (ECM)-receptor interactions. b A volcano plot showing the differentially expressed genes (fold change > 1.5, adjust p-value < 0.05) when the transcriptomes of cluster 0 and cluster 3 are compared. The 20 genes whose mRNAs exhibit the highest level of differential expression are highlighted, which include STAT3, PDGFRB, and SOCS3. The gray dashed line indicates the 1.5-fold cutoff for a differentially expressed gene. A red (or blue) color indicates that a gene is up (or down) regulated in cluster 0 (vs. cluster 3); a black color indicates that the expression level was not significantly different. The differentially expressed genes among the groups were determined using the Wald test in DESeq2. c Violin plots showing three genes (PDGFRB, STAT3, SOCS3) whose mRNAs were markedly increased in cluster 0 cells relative to cluster 3. d Day 21 control and ARPKD organoids were immunostained with an anti-PDGFRB antibody. PDGFRB is highly expressed in ARPKD, but not in control, HOs. Scale bar, 50 μm. e A scatter plot of CyToF data performed with anti-PDGRFΒ and anti-CD56 antibodies shows that ARPKD organoids have a markedly increased amount of PDGFRB+ cells (9.0%) relative to control organoids (2.1%). f bhSNE maps (upper) generated from CyToF data indicate that ARPKD HOs have an increased amount of SMA+ cells. (Lower) Representative images of HOs immunostained with anti-smooth muscle actin (SMA) and anti-CK8 antibodies. The yellow dotted lines indicate ductal structures. While only a few SMA+ cells were present at a limited number of sites within control organoids (indicated by an arrow); large clusters of SMA+ cells were present within ARPKD organoids (indicated by arrowhead) and were located near ductal structures. Scale bar, 10 μm. g Normal and ARPKD liver tissue was immunostained with antibodies to PDGFRB, CK8, and SMA. PDGFRB expression was much higher in ARPKD than in control liver tissue. Also, SMA+ cells were only located within perivascular regions of normal liver tissue; but they infiltrate the parenchyma of ARPKD liver tissue (as shown in the inset). The white dashed line separates epithelial and mesenchymal areas. Scale bar, 50 μm. h ARPKD and Control HOs were immunostained with anti-CK8 and anti-phospo-STAT3 (Tyr705) antibodies. Phospho-STAT3 was extensively expressed in bile duct and mesenchymal cells in ARPKD HOs. The right panels are enlargements of the boxed yellow area in the ARPKD organoid; the arrows indicate mesenchymal cells with Phospho-STAT3 within the nucleus. Scale bar, 5 μm. i, j ARPKD and normal liver tissues were immunostained with antibodies to CK8, Phospho-Stat3, and CK8, and were counterstained with Hoechst. i Low (top) and high (bottom) power views of ARPKD liver tissue immunostained with antibodies to CK8, PDGFRB, and Phospho-STAT3. A myofibroblast area with is within the dotted line. A high-power view of the yellow boxed area shows phospho-STAT3 is co-localized within PDGFRB+ myofibroblasts. Scale bar, 5 μm. j Phospho-STAT3 is extensively expressed in an enlarged bile duct within ARPKD liver tissue, but its level of expression is much weaker in normal bile ducts. k The bar graph shows the GSEA results (normalized enrichment score (NES)) obtained from each analysis; and the false discovery rate (FDR) for each comparison is shown at the top of each bar. The myofibroblast gene expression signature was very strongly associated with cirrhotic and NASH liver tissue, but this signature was not induced by obesity alone or by the presence of a HCC. GSEA was also performed by comparing the cluster 0 cell transcriptome with overlapping genes present in the expression signatures defined from the scRNA-Seq analysis of myofibroblasts and B cells present in cirrhotic human livers. Bottom: GSEA results for the correlation of the ARPKD myofibroblast gene expression signature with that in liver tissues obtained from: 10 normal and 10 cirrhotic subjects (Cirrhosis); 98 normal and 126 NASH subjects (NASH).
Fig. 6
Fig. 6. The PDGFRB-STAT3 pathway is activated in myofibroblasts in human liver cancer tissue.
a Resected liver tissue obtained from patients with hepatocellular carcinoma (HCC) or cholangiocarcinoma (CCC). The tumor and adjacent normal tissues were immunostained with antibodies to PDGFRB, smooth muscle actin (SMA), and collagen 1A (COL1A); or with pan cytokeratin (panCK), PDGFRB, and phospho-STAT3 (pSTAT3) antibodies. a PDGFRB expression was much higher in the tumor tissues than in the adjacent normal liver tissue. While pSTAT3 expression was undetectable in the normal liver tissue; low levels of pSTAT3 staining within/near PDGFRB+ cells were seen in the CCC tumor tissue. b An enlarged view of the dashed square region of the CCC tumor tissue (in a) is shown. This region has abundant PDGFRB expression within the CCC tumor, and pSTAT3 is detected in an area with PDGFRB+ cells (indicated by the arrows). Scale bar, 50 μm.
Fig. 7
Fig. 7. PDGFR inhibitors reduce fibrosis in ARPKD organoids.
Control or ARPKD organoid cultures were treated with vehicle or PDGFR inhibitors, and the extent of fibrosis developing in the cultures was measured by three different methods. a Whole-mount immunostaining of control HOs and of drug (10 μM) or vehicle-treated ARPKD organoids. Representative images of organoids stained with COL1A and CK8 antibodies, and counterstained with Hoechst 33342. Scale bar, 50 μm. b The fibrosis score was determined by measuring the ratio of the volume of COL1A and CK8 in 100 stacked images obtained from 4 whole-mount organoids per group. The PDGFR inhibitors (Crenolanib, Imatinib) decreased the fibrosis score in ARPKD organoids to levels that were similar to control organoids (n = 4 per group, ARPKD vs Imatinib p = 0.00089, ARPKD vs Crenolanib p = 0.0042, ARPKD vs DAPT p = 0.0014). c Representative images of COL1A and CK8 immunostained ARPKD organoids before and after treatment with 10 μM of the indicated inhibitor. For comparison, an image of an immunostained control organoid is also shown. Scale bar is 50 μm. d The fraction of the total area occupied by bile ducts (CK8+ area) within isogenic control (normal) and ARPKD organoids after treatment with 10 μM of the indicated drug (n = 5 per group, DMSO vs Crenolanib p = 0.37, DMSO vs Sunitinib p = 0.58, DMSO vs Imatinib p = 0.015, n.s. no significant difference). e COL1A1 mRNA levels in ARPKD organoids are significantly higher than in control organoids, and were decreased 17-fold after treatment with the PDGFR inhibitors. RT-PCR measurements made on 3 organoids per treatment group; and the values were normalized relative to simultaneously measured GAPDH mRNA levels (DMSO vs Crenolanib p = 0.00048, DMSO vs Sunitinib p = 0.0021, DMSO vs Imatinib p = 0.00071, ARPKD vs DAPT p = 0.00068). Box plots in b, d, and e (center line, median; box limits, upper and lower quartiles; whiskers, 1.5 × interquartile range). Statistical differences between the groups were determined by unpaired two-tailed t-test. *p < 0.05; **p < 0.01; and ***p < 0.001. f, g 4-OH Pro levels in ARPKD organoids are decreased by treatment with 10, 2, or 0.5 μM concentrations of PDGFRB inhibitors (Control vs DMSO p = 0.00097, DMSO vs Crenolanib p = 0.0046, DMSO vs Sunitinib p = 0.00082, DMSO vs Imatinib p = 0.0013; DMSO vs 2 μM Crenolanib p = 0.00047, DMSO vs 0.5 μM Crenolanib p = 0.0019, DMSO vs 2 μM Sunitinib p = 0.37, DMSO vs 0.5 μM Sunitinib p = 0.0014, DMSO vs 2 μM Imatinib p = 0.0064, DMSO vs 0.5 μM Imatinib p = 0.004). Box plots in b, d and e (center line, median; box limits, upper and lower quartiles; whiskers, 1.5 × interquartile range). Statistical differences between the groups were determined by unpaired two-tailed t-test. *p < 0.05; **p < 0.01; and ***p < 0.001.

References

    1. Yoon YJ, Friedman SL, Lee YA. Antifibrotic therapies: where are we now? Semin Liver Dis. 2016;36:87–98. doi: 10.1055/s-0036-1571295. - DOI - PubMed
    1. Hernandez-Gea V, Friedman SL. Pathogenesis of liver fibrosis. Annu. Rev. Pathol. 2011;6:425–456. doi: 10.1146/annurev-pathol-011110-130246. - DOI - PubMed
    1. Pinzani M, Luong TV. Pathogenesis of biliary fibrosis. Biochim. Biophys. Acta Mol. Basis Dis. 2018;1864:1279–1283. doi: 10.1016/j.bbadis.2017.07.026. - DOI - PubMed
    1. Pinzani M. Pathophysiology of liver fibrosis. Dig. Dis. 2015;33:492–497. doi: 10.1159/000374096. - DOI - PubMed
    1. Zhang CY, Yuan WG, He P, Lei JH, Wang CX. Liver fibrosis and hepatic stellate cells: etiology, pathological hallmarks and therapeutic targets. World J. Gastroenterol. 2016;22:10512–10522. doi: 10.3748/wjg.v22.i48.10512. - DOI - PMC - PubMed

Publication types

MeSH terms

Substances