. 2021 Oct 22;12(1):6147.
doi: 10.1038/s41467-021-26364-y.

The flashfm approach for fine-mapping multiple quantitative traits

Affiliations

The flashfm approach for fine-mapping multiple quantitative traits

N Hernández et al. Nat Commun. .

Abstract

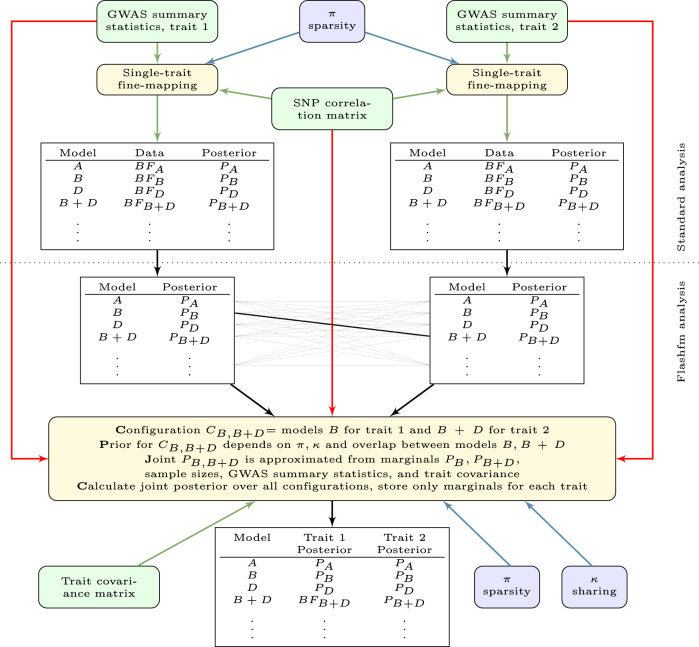
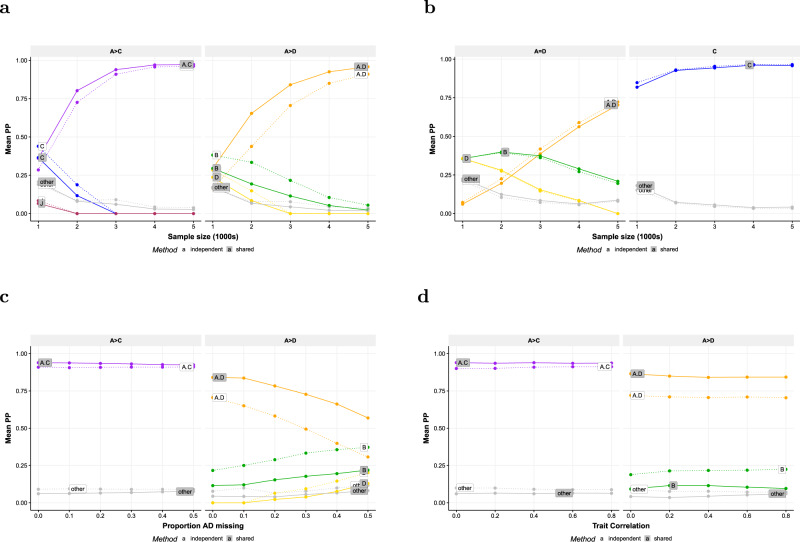
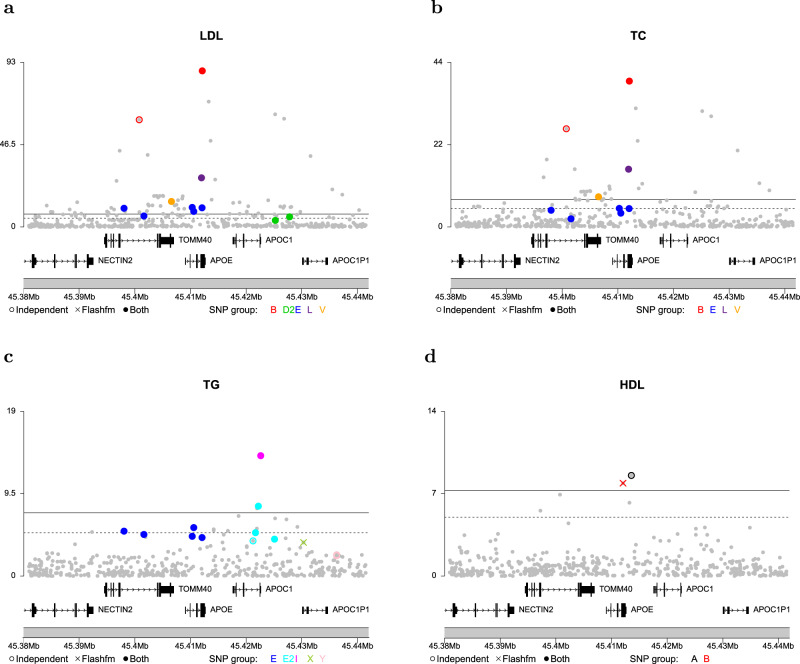
Joint fine-mapping that leverages information between quantitative traits could improve accuracy and resolution over single-trait fine-mapping. Using summary statistics, flashfm (flexible and shared information fine-mapping) fine-maps signals for multiple traits, allowing for missing trait measurements and use of related individuals. In a Bayesian framework, prior model probabilities are formulated to favour model combinations that share causal variants to capitalise on information between traits. Simulation studies demonstrate that both approaches produce broadly equivalent results when traits have no shared causal variants. When traits share at least one causal variant, flashfm reduces the number of potential causal variants by 30% compared with single-trait fine-mapping. In a Ugandan cohort with 33 cardiometabolic traits, flashfm gave a 20% reduction in the total number of potential causal variants from single-trait fine-mapping. Here we show flashfm is computationally efficient and can easily be deployed across publicly available summary statistics for signals in up to six traits.


Conflict of interest statement

The authors declare no competing interests.

Figures

Fig. 1
Fig. 1. Schematic diagram for flashfm.
Flashfm is used for multiple quantitative traits that are measured in the same studies, allowing for missing measurements and family data. First, standard analysis of single-trait fine-mapping is needed for each trait. Then the model posterior probabilities (PPs) from each of these marginal fine-mapping analyses are combined in flashfm, using an approximation to the joint PP, based on an approximation of the joint Bayes’ factor. In addition to a SNP correlation matrix, a trait covariance approximation is also needed. Information is shared between traits via a sharing prior that upweights joint models with shared causal variants by a factor of Ҝ. Memory requirements are reduced by storing only the trait-adjusted marginal PPs for each trait.
Fig. 2
Fig. 2. Comparison of fine-mapping from flashfm and single-trait analyses.
When traits share a causal variant, flashfm has higher accuracy than single-trait finemapping, regardless of amount of missing data and trait correlation; both methods have similar accuracy when there are no shared causal variants. Causal variants were simulated for two traits with models defined by SNP groups from the IL2RA region. We vary sample size when the traits share a causal variant (a) and do not share any causal variants (b). At fixed sample size N = 3000, we vary the proportion of missing data for one trait (c) and vary the trait correlation (d). In a, c and d Trait 1 has causal variants A+C, while trait 2 has A+D causal variants, both A causal variants with the same effect size: βA = log(1.4) and βD = βC = log(1.25). In a and b there are no missing data and the sample size varies from 1000 to 5000. In c the sample size is fixed at 3000 and the proportion of missing data for trait A+D varies from 0 to 0.5. In d the sample size is fixed as 3000 and the correlation between traits varies. In b Trait 1 has causal variants A+D with βA = log(1.25) and βD = (1.25), while trait 2 has a single causal variant C with βC = log(1.25). Results are based on 300 replications. Source data are provided in Supplementary Data 1, Supplementary Data 1.2, 1.3, 1.6, 1.7.
Fig. 3
Fig. 3. Fine-mapping of signals for four lipid traits in region 19:45380937-45441453.
The -log10p for SNPs in the top SNP groups for a LDL; b total cholesterol (TC); c triglycerides (TG); d HDL are shown for both FINEMAP and flashfm. The two methods agree on a 5-SNP model for LDL (a) and a 4-SNP model for TC (b). The top model for TG (c) has 4 SNPs under both methods but differ in one SNP group; FINEMAP prefers 3-SNP group Y (very near one another so appear as one) and flashfm selected single SNP group X (mean r2 of SNPs in Y with X is 0.315). For HDL (d), a different single-SNP model was selected by the two methods; FINEMAP favoured group A, whereas flashfm selected group B. The solid coloured circles show SNPs that belong to the SNP groups constructed by both methods, the empty coloured circles represent SNPs that are only in the FINEMAP SNP group; solid grey circles show all other SNPs in the region. In c and d an X represents a SNP that appeared in a top model for flashfm and not FINEMAP and empty circles indicate SNPs that appeared in top models for FINEMAP and not flashfm. Position is given according to hg19/build 37. Some of the genes in this region include APOE, APOC1 and TOMM40.

References

    1. Buniello A, et al. The NHGRI-EBI GWAS Catalog of published genome-wide association studies, targeted arrays and summary statistics 2019. Nucleic Acids Res. 2019;47:D1005–D1012. doi: 10.1093/nar/gky1120. - DOI - PMC - PubMed
    1. Sivakumaran S, et al. Abundant pleiotropy in human complex diseases and traits. Am. J. Hum. Genet. 2011;89:607–618. doi: 10.1016/j.ajhg.2011.10.004. - DOI - PMC - PubMed
    1. Wallace C, et al. Dissection of a complex disease susceptibility region using a Bayesian stochastic search approach to fine mapping. PLoS Genet. 2015;11:e1005272. doi: 10.1371/journal.pgen.1005272. - DOI - PMC - PubMed
    1. Newcombe PJ, Conti DV, Richardson S. JAM: a scalable Bayesian framework for joint analysis of marginal SNP effects. Genet. Epidemiol. 2016;40:188–201. doi: 10.1002/gepi.21953. - DOI - PMC - PubMed
    1. Benner C, et al. FINEMAP: efficient variable selection using summary data from genome-wide association studies. Bioinformatics. 2016;32:1493–1501. doi: 10.1093/bioinformatics/btw018. - DOI - PMC - PubMed

Publication types