. 2021 Oct 22;12(1):6149.
doi: 10.1038/s41467-021-26349-x.

Harmonizing corporate carbon footprints

Affiliations

Harmonizing corporate carbon footprints

Lena Klaaßen et al. Nat Commun. .

Abstract

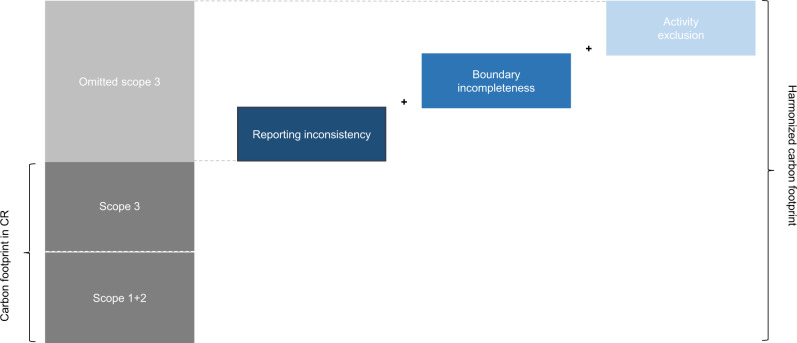
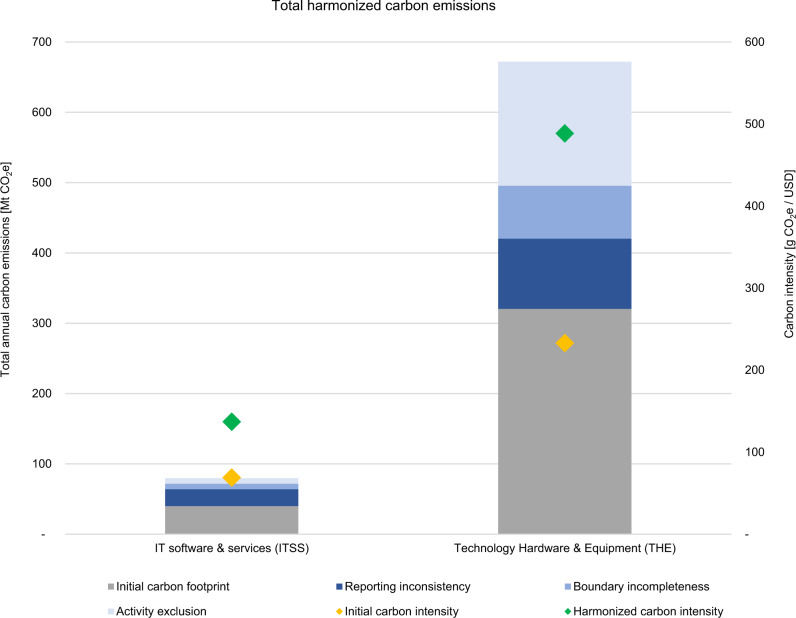
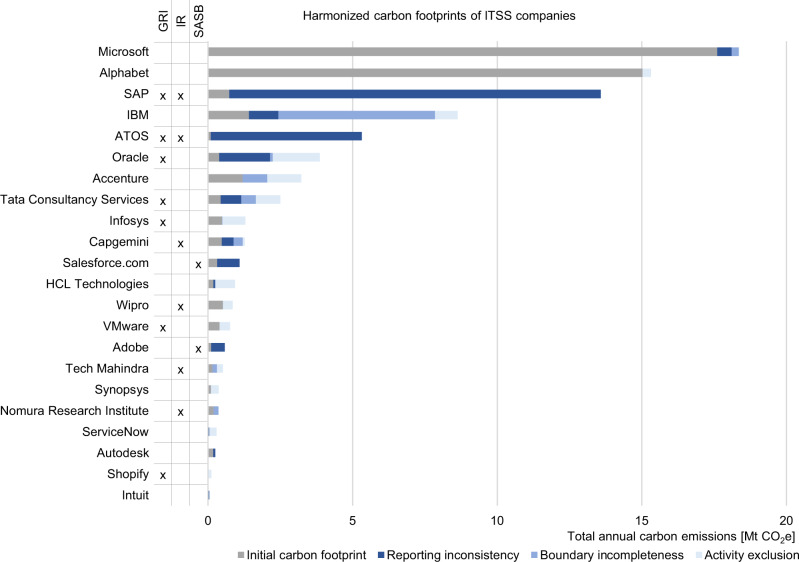
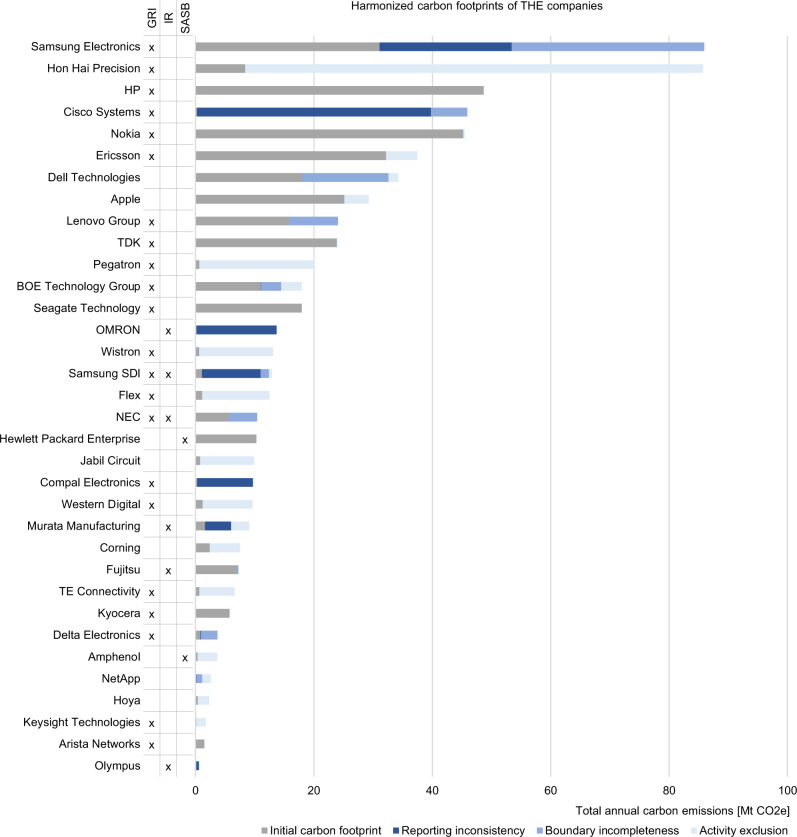
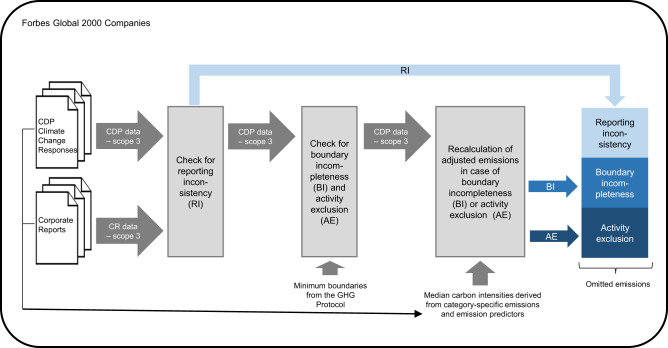
Global greenhouse gas emissions need to reach net-zero around mid-century to limit global warming to 1.5 °C. This decarbonization challenge has, inter alia, increased the political and societal pressure on companies to disclose their carbon footprints. As a response, numerous companies announced roadmaps to become carbon neutral or even negative. The first step on the journey towards carbon neutrality, however, is to quantify corporate emissions accurately. Current carbon accounting and reporting practices remain unsystematic and not comparable, particularly for emissions along the value chain (so-called scope 3). Here we present a framework to harmonize scope 3 emissions by accounting for reporting inconsistency, boundary incompleteness, and activity exclusion. In a case study of the tech sector, we find that corporate reports omit half of the total emissions. The framework we present may help companies, investors, and policy makers to identify and close the gaps in corporate carbon footprints.


Conflict of interest statement

The authors declare no competing interests.

Figures

Fig. 1
Fig. 1. Visualization of the framework to harmonize corporate carbon footprints.
The dark gray parts represent the carbon footprint as provided in the corporate report (CR). The blue parts represent potential sources of errors which together form the sum of all omitted scope 3 emissions. The correction of these errors leads to a harmonized carbon footprint.
Fig. 2
Fig. 2. Total harmonized carbon emissions of the IT software and service (ITSS) and the technology hardware and equipment (THE) sample in 2019.
The different sample sizes need to be considered when comparing absolute figures (ITSS: n = 22; THE: n = 34). The analysis is based on CDP responses of 2019 and corporate reports of the corresponding reporting period. Carbon intensities are calculated by dividing total carbon emissions by total revenues of the sample. See supplementary data: sheet 2.1–2.3 for calculations.
Fig. 3
Fig. 3. Harmonized carbon footprints of IT software and service (ITSS) companies.
Analysis is based on CDP responses of 2019 and corporate reports of the corresponding reporting period. For each company the sum of the initial carbon footprint, as provided in the corporate report, and the omitted emissions form the harmonized carbon footprint. Omitted emissions results from sources of errors such as reporting inconsistency, boundary incompleteness, and activity exclusion. See supplementary data: sheet 2.1–2.3 for calculations. The Global Reporting Initiative (GRI) standards, Integrated Reporting (IR) framework, or Sustainability Accounting Standards Board (SASB) standards are ticked in case the corporate report was prepared in accordance with them.
Fig. 4
Fig. 4. Harmonized carbon footprints of technology hardware and equipment (THE) companies.
Analysis is based on CDP responses of 2019 and corporate reports of the corresponding reporting period. For each company the sum of the initial carbon footprint, as provided in the corporate report, and the omitted emissions form the harmonized carbon footprint. Omitted emissions results from sources of errors such as reporting inconsistency, boundary incompleteness, and activity exclusion. See supplementary data: sheet 2.1–2.3 for calculations. The Global Reporting Initiative (GRI) standards, Integrated Reporting (IR) framework, or Sustainability Accounting Standards Board (SASB) standards are ticked in case the corporate report was prepared in accordance with them.
Fig. 5
Fig. 5. Distribution of omitted emissions by scope 3 category of the IT software and service (ITSS) and the technology hardware and equipment (THE) sample.
Analysis is based on CDP responses of 2019 and corporate reports of the corresponding reporting period. See supplementary data: sheet 2.1-2.3 for calculations.
Fig. 6
Fig. 6. Overview of the framework with key input and output flows.
Input data is provided by CDP Climate Change Responses and corporate reports. Throughout the process, the framework checks and adjusts for reporting inconsistency, boundary incompleteness and activity exclusion. The sum of these three sources of errors forms the omitted scope 3 emissions.

References

    1. IPCC. Global Warming of 1.5 °C. Available at https://www.ipcc.ch/sr15/ (2018).
    1. Deloitte. Sustainability Disclosure Goes Mainstream. Available at https://www2.deloitte.com/us/en/pages/audit/articles/hu-sustainability-d... (2020).
    1. Amazon. Sustainability: Thinking Big. Available at https://sustainability.aboutamazon.com/ (2019).
    1. Apple. Apple commits to carbon neutrality for supply chain and products by 2030. Available at https://www.apple.com/newsroom/2020/07/apple-commits-to-be-100-percent-c... (2020).
    1. Microsoft. Microsoft Will Be Carbon Negative by 2030. Available at https://www.https://blogs.microsoft.com/blog/2020/01/16/microsoft-will-b... (2020).