. 2021 Nov;22(11):1367-1374.
doi: 10.1038/s41590-021-01043-8. Epub 2021 Oct 22.

Dichotomous metabolic networks govern human ILC2 proliferation and function

Affiliations

Dichotomous metabolic networks govern human ILC2 proliferation and function

Laura Surace et al. Nat Immunol. 2021 Nov.

Abstract

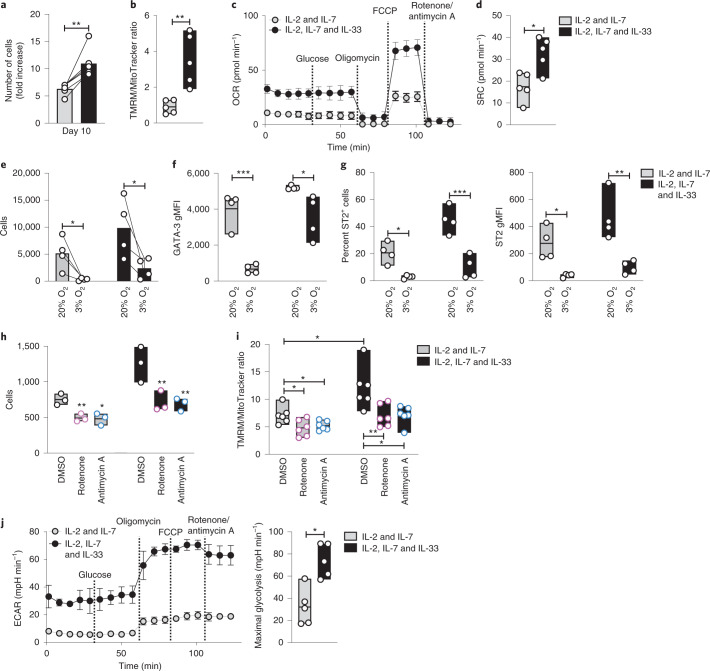
Group 2 innate lymphoid cells (ILC2s) represent innate homologs of type 2 helper T cells (TH2) that participate in immune defense and tissue homeostasis through production of type 2 cytokines. While T lymphocytes metabolically adapt to microenvironmental changes, knowledge of human ILC2 metabolism is limited, and its key regulators are unknown. Here, we show that circulating 'naive' ILC2s have an unexpected metabolic profile with a higher level of oxidative phosphorylation (OXPHOS) than natural killer (NK) cells. Accordingly, ILC2s are severely reduced in individuals with mitochondrial disease (MD) and impaired OXPHOS. Metabolomic and nutrient receptor analysis revealed ILC2 uptake of amino acids to sustain OXPHOS at steady state. Following activation with interleukin-33 (IL-33), ILC2s became highly proliferative, relying on glycolysis and mammalian target of rapamycin (mTOR) to produce IL-13 while continuing to fuel OXPHOS with amino acids to maintain cellular fitness and proliferation. Our results suggest that proliferation and function are metabolically uncoupled in human ILC2s, offering new strategies to target ILC2s in disease settings.


Conflict of interest statement

The authors declare no competing interests.

Figures

Fig. 1
Fig. 1. Complex I and III of the electron transport chain (ETC) support ILC2 survival.
a, TMRM and MitoTracker measurement in freshly sorted ILC2s and NKdim cells. Representative plots show MitoTracker and TMRM geometric mean fluorescence intensity (gMFI) and the ratio between the gMFI of TMRM and MitoTracker (n = 7). bd, Comparison of healthy donors (HD; black) and individuals with MD (PT; green). Representative plots show the percentage of ILC2s in live CD45+ cells (b), GATA-3 gMFI in circulating ILC2s (c) (HD = 7; PT = 7) and MitoTracker and TMRM gMFI and the ratio between the geometric mean of TMRM and MitoTracker (d) (HD = 5; PT = 4). eh, Freshly sorted ILC2s and NKdim cells were cultured without additional cytokines for 18 h in DMSO, rotenone (1 µM), antimycin A (1 µM), 2-thenoyltriflouroacetone (TTFA; 1 µM) or oligomycin (1 µM). Representative TMRM and MitoTracker FACS plots (e), percentage of MitoTracker+TMRM+ cells in live CD45+ cells (f), the ratio between the geometric mean of TMRM and MitoTracker (g) and cell counts calculated by FACS (h) are shown (n = 5). The data in a are representative of five independent experiments with two to five donors each. Each dot in b represents one donor. The data in c and d are representative of two independent experiments with two to five healthy donors and two to four individuals with MD. The data in eh are representative of three independent experiments with at least three donors each. Floating bars in ah indicate the mean, minimum and maximum values within the dataset. Statistics were assessed by one-way analysis of variance (ANOVA) with a Dunnett correction; NS, not significant (P > 0.05); *P < 0.05; **P < 0.01; ***P < 0.001; ****P < 0.0001. Source data
Fig. 2
Fig. 2. BCAA and arginine metabolism fuel OXPHOS in steady-state ILC2s.
a, Heat map of amino acid intensities quantified by label-free mass spectrometry in freshly sorted ILC2s. b, Nutrient receptor analysis in fresh ILC2s by RNA sequencing (RNA-seq) (median value among three donors; relative expression). c, Representative plots of ASCT2 (glutamine transporter), CD98 (LAT1; large amino acid transporter), GLUT1 (glucose transporter) and CD36 (FA receptor) and MFI quantification of each receptor versus isotype control (n = 3). dg, Freshly sorted ILC2s were cultured without additional cytokines for 18 h in DMSO, Nω-hydroxy-nor-arginine (nor-NOHA; 1 µM), BCAA transferase inhibitor (BCATi; 1 µM), bis-2-(5-phenylactamido-1,3,4-thiadiazol-2-yl)ethyl sulfide (BPTES; 1 µM) or 2-deoxy-d-glucose (2DG; 1 µM) to selectively inhibit the pathways depicted in the schematic in d; ARGI, arginase-1; GSL, glutaminase. A representative TMRM and MitoTracker FACS plot in ILC2s (e), the percentage of MitoTracker+TMRM+ cells (f) and the ratio between TMRM and MitoTracker MFI (g) (n = 6) are shown. The data in a are summarized from four donors, and a minimum of two technical replicates were analyzed per run. Data in b were extracted from an RNA-seq dataset, and the median was calculated from the values of three healthy donors. Data in c are representative of three independent experiments with at least three donors each. Data in dg are summarized from two independent experiments with at least two donors, and plots are representative of a total of four independent experiments. The floating bars in c, f and g indicate the mean, minimum and maximum values within the dataset. Statistics were assessed by two-tailed t-test (c) and one-way ANOVA with Dunnett correction (f and g); NS, not significant (P > 0.05); *P < 0.05; **P < 0.01; ***P < 0.001. Source data
Fig. 3
Fig. 3. Activated ILC2s increase oxygen consumption and glycolytic capacity.
ad and hj, ILC2s were expanded for 7 d in the presence of IL-2 and IL-7, and then IL-33 was added or not for 72 h. a, Number of cells at day 10 (n = 6). b, Ratio between TMRM and MitoTracker MFI (n = 5). c,d, Seahorse measurements following the addition of glucose, oligomycin, fluoro-carbonyl cyanide phenylhydrazone (FCCP) and a combination of rotenone and antimycin A, including OCR (c) and SRC (maximal respiratory capacity after FCCP – basal respiratory capacity) (d) (n = 5). eg, Cells were cultured at 20% or 3% oxygen in IL-2 and IL-7 or IL-2, IL-7 and IL-33 for 5 d. Cell count (e), GATA-3 expression (f), percent ST2+ cells and ST2 expression (g) were analyzed by FACS. h,i, Cells were treated for the last 18 h with 1 µM rotenone, 1 µM antimycin A or DMSO (n = 5). The total cell counts (h) (n = 3) and the ratio between TMRM and MitoTracker MFI (i) (n = 6) were calculated by FACS. j, Extracellular acidification rate (ECAR) and maximal glycolysis were analyzed by Seahorse, performed as in c and d (n = 5). Data in ad and j are representative of five independent experiments with three to five donors each. Data in ei are representative of three independent experiments with at least three donors each. The bars in a, c, e and j (left plot) represent mean ± s.e.m., and the floating bars in b, d, fi and j (right plot) indicate the mean, minimum and maximum values within the dataset. Statistics were assessed by two-tailed t-test (ad and j) and one-way ANOVA with Tukey correction (ei); NS, not significant (P > 0.05); *P < 0.05; **P < 0.01; ***P < 0.001. Source data
Fig. 4
Fig. 4. IL-33-stimulated ILC2s use amino acid metabolism to sustain cellular fitness and glucose for cytokine production.
ac, ILC2s were expanded for 7 d in IL-2 and IL-7, and IL-33 was added or not for 72 h. a, A heat map of amino acid intensities quantified by label-free mass spectrometry in naive cells and in ILC2s treated with either IL-2 and IL-7 or IL-2, IL-7 and IL-33 is shown. b, Percentage increase of nutrient receptors in primed (IL-2 and IL-7) or activated (IL-2, IL-7 and IL-33) cells versus in naive ILC2s (n = 3). c, ILC2s were cultured for 18 h with 1 µM BPTES, 1 µM 2DG, 1 µM nor-NOHA, 1 µM BCATi or DMSO in the indicated cytokine combinations. TMRM and MitoTracker were measured by FACS (n = 6). d,e, Cells were cultured for 6 d with IL-2 and IL-7 (d) or with IL-2, IL-7 and IL-33 (e) and 1 µM rotenone, 1 µM antimycin A, 1 µM BPTES, 1 µM 2DG, 1 µM nor-NOHA, 1 µM BCATi or DMSO. The cell counts at day 6 are shown (n = 6). f, Expression of IL-13. ILC2s were expanded in IL-2 and IL-7 for 7 d with or without inhibitors as described in d and e, and IL-33 was added for the last 6 h. g, ILC2s were expanded in IL-2 and IL-7 for 7 d, and IL-33 was added for the last 6 h to cells starved for 1 h and under a glucose add-back condition. IL-13 expression was monitored by FACS (f,g) (n = 4). Data in a are summarized from four donors, and a minimum of two technical replicates were analyzed per run. Data in b are representative of three independent experiments with three donors each. Data in c are summarized from two experiments with three donors each and are representative of a total of four independent experiments. Data in d and e are summarized from two experiments with three donors each and are representative of a total of three independent experiments. Data in f and g are representative of a total of three independent experiments with at least three donors. Floating bars in bg indicate the mean, minimum and maximum values within the dataset. Bars in d and e (left plots) represent mean ± s.e.m. Statistics were assessed by two-tailed t-test (b) and one-way ANOVA (cg) with Dunnett correction; NS, not significant (P > 0.05); *P < 0.05; **P < 0.01; ***P < 0.001. Source data
Extended Data Fig. 1
Extended Data Fig. 1. Human ILC2 have fused and polarized mitochondria.
a, ILC2 Gating strategy Live CD45+ CD7+ Lin- CD94- NKG2A- CD56- CD16- CD127+ CRTh2+ (ILC2) and Live CD45+ CD7+ Lin- CD94+ CD16+ (NKDim). b, Percentage of ILC2 and NKDim in live CD45+ cells. c, FACS measurement of TMRM and MitoTracker in healthy donors of fresh ILC2 and NKDim (n = 12). d, Confocal microscopy in fresh ILC2 and NKDim (n = 7). e, MitoTracker and TMRM intensity (SD/Mean). f, ATP and ADP intensities quantified by label-free mass spectrometry in freshly sorted ILC2 and NKDim cells (n = 3). a-b, Data representative of 10 independent experiments with 2 to 4 donors each. c, Data from 12 healthy donors from at least 5 independent experiments. d-e, Data representative of 2 independent experiments with at least 3 donors. Dots are single cells in the analyzed field. Scale bar 5μm. f, Each dot represents a donor. A minimum of 2 technical replicates were analyzed per run. b, e, f, Floating bars indicate the mean, minimum and maximum values within the dataset. Statistics were assessed by two tailed t-test (b,e,f), not significant (ns), p > 0.05; **p < 0.01; ****p < 0.0001. Source data
Extended Data Fig. 2
Extended Data Fig. 2. ILC2 have enhanced mitochondrial activity compared to naïve T cells.
a, Gating strategy for CD4+ T cells subsets in the blood of healthy donors. FACS measurement of TMRM and MitoTracker gMFI in the indicated subsets (n = 4). b-f, Paired blood and tonsil samples were collected from pediatric donors. The percentage of ILC2 (b), GATA-3 gMFI (c), CRTH2 gMFI (d), representative plots of CD127, CD161, ST2 (e), TMRM and Mitotracker gMFI (f) were monitored by FACS (n = 3). a, Data representative of 2 experiments with at least 3 donors each. b-f, Data are representative of 2 independent experiments with 3 donors each. a, Floating bars indicate the mean, minimum and maximum values within the dataset. b-f, Bars are ± s.e.m. Statistics were assessed by one-way ANOVA with Dunnett correction (a) and two tailed t-test (b-f), not significant (ns), p > 0.05; *p < 0.05; **p < 0.01; ****p < 0.0001. Source data
Extended Data Fig. 3
Extended Data Fig. 3. ILC2 are reduced in patients with mitochondrial diseases.
a-c, Comparison of healthy donors (HD, black) and patients with mitochondrial diseases (PT, green). The percentage of live CD45+ cells, total ILC (a) CD8+ and CD4+ T cells (b) and live Annexin-V+ cells (c) was measured by FACS (HD = 7, PT = 7). d-e, Freshly sorted ILC2 and NKDim were cultured with no additional cytokines for 18h in DMSO, Rotenone (1uM), Antimycin A (1uM), TTFA (1uM) or Oligomycin (1uM), as indicated in the inhibition strategy (d). TMRM and MitoTracker gMFI were measured by FACS (e) (n = 3). a-c, Each dot represents a donor. d-e, Data representative of 3 independent experiments with at least 3 donors each. a-c, e, Floating bars indicate the mean, minimum and maximum values within the dataset. Statistics were assessed by two tailed t-test (a-c), and one-way ANOVA with Dunnett correction (e), not significant (ns), p > 0.05; *p < 0.05; **p < 0.01; ***p < 0.001; ****p < 0.0001. Source data
Extended Data Fig. 4
Extended Data Fig. 4. Branched amino acid and Arginine metabolism support OXPHOS in circulating ILC2.
a, Enrichment analysis done by Metaboanalyst. Metabolite intensities were used as input and human metabolome was used as reference. b, Paired blood and tonsil samples were collected from pediatric donors. GLUT1, CD36, CD98 and ASCT2 were measured by FACS (n = 3). c-d, Freshly sorted ILC2 were cultured w/o additional cytokines for 18h in DMSO, nor-NOHA (1uM), BCATi (1uM), BPTES (1uM) or 2DG (1uM). Cell counts (c) (n = 6) and TMRM and MitoTracker MFI (d) (n = 3) were measured by FACS. e, FACS analysis of TMRM and Mitotracker staining in ILC2 cultured w/o additional cytokines for 18h in DMSO, Rotenone (1uM), Antimycin A (1uM), nor-NOHA (1uM) and BCATi (1uM). a, Data summarized from 4 donors. A minimum of 2 technical replicates were analyzed per run. b, Data are representative of 2 independent experiments with 3 donors each. c-d, Data are representative of 4 independent experiments with at least 2 donors each. e, Data are shown for 4 donors from 2 independent experiments. b-d, Floating bars indicate the mean, minimum and maximum values within the dataset. Statistics were assessed by two tailed t-test (b) and one-way ANOVA with Dunnett correction (c-d), not significant (ns), p > 0.05; *p < 0.05. Source data
Extended Data Fig. 5
Extended Data Fig. 5. Branched amino acid and Arginine are used as building blocks to sustain TCA cycle and OXPHOS.
Enzyme analysis comparing RNA-seq data to published NK cell dataset for the calculation of the fold change. Data extracted from RNA-seq dataset. Median calculated from values of 3 healthy donors. Source data
Extended Data Fig. 6
Extended Data Fig. 6. Activated ILC2 upregulate ST2 and enhance OXPHOS.
a, Representative FACS plots of CRTh2 and ST2 in blood ILC2. b, ILC2 were cultured for 18h with IL-2, IL-7 or IL-2-7 and levels of ST2 were monitored by FACS. c, ILC2 were expanded for 3, 5 or 7 days in IL-2-7 and ST2 was measured by FACS (n = 7). d,e, ILC2 were expanded for 7 days in the indicated cytokine combinations. Cell number was assessed by trypan blue (d), TMRM and MitoTracker gMFI were measured by FACS (e) (n = 3). f-h, ILC2 were expanded for 7 days in IL-2-7 and then IL-33 was added or not for 72h. Levels of IL-13 (f) (n = 4), TMRM and MitoTracker (g) were measured at d10 by FACS (n = 5). h, Maximal and basal respiration were measured by seahorse upon addition of Glucose, Oligomycin, FCCP and a combination of Rotenone + Antimycin A (n = 5). a,b Plot representative of 3 different donors. c-e, Data are representative of two experiments with 3 to 4 donors each. f, Data are representative of 3 experiments with at least 3 donors each. g-h, Data are representative of 5 independent experiments with 3 to 5 donors each. c-h, Floating bars indicate the mean, minimum and maximum values within the dataset. Statistics were assessed by one-way ANOVA with Tukey correction (d,e) and two tailed t-test (f-h), not significant (ns), p > 0.05; *p < 0.05; **p < 0.01; ***p < 0.001; ****p < 0.0001. Source data
Extended Data Fig. 7
Extended Data Fig. 7. Oxygen consumption is crucial upon ILC2 activation.
a-c, Cells were cultured at 20% or 3% oxygen in IL-2-7 or IL-2-7-33 for 5 days. The gMFI of the indicated makers in the heatmap (a) and HIF1a gMFI (b) were analyzed by FACS (n = 3). The level of expression of PKM, ST2 and GATA-3 transcripts was measured by Biomark (c) (n = 15). d-e, 1uM RO, or 1uM AA or with DMSO were added for 18h to the culture. Annexin V and L/D (d) (n = 3), Mitotracker and TMRM MFI (e) (n = 6) were analyzed by FACS. a, Data pooled from 3 independent experiments with 3 donors each. b, Data representative of 3 independent experiments. c, Data pooled from 2 independent experiments. d-e, Data are representative of a total of 4 independent experiments with 3 donors each. b-c, Bars are ± s.e.m.; d-e, Floating bars indicate the mean, minimum and maximum values within the dataset. Statistics were assessed by one-way ANOVA with Tukey correction (b-e), not significant (ns), p > 0.05; *p < 0.05; **p < 0.01; ***p < 0.001; ****p < 0.0001. Source data
Extended Data Fig. 8
Extended Data Fig. 8. Activated ILC2 use different nutrients to sustain proliferation.
a-e, ILC2 were expanded for 7 days in IL-2-7 and then IL-33 was added or not for 72h. Inhibitors or DMSO were added at the concentrations indicated in Fig. 4 for 18h. MitoTracker and TMRM (a-b) (n = 6), cell counts and AnnexinV (c) were monitored by FACS (n = 3). d-e, Bodipy (d) (n = 4), MitoTracker and TMRM (e) (n = 6) were analyzed by FACS in naïve, IL-2-7 and IL-2-7-33 stimulated ILC2. f, Cells were cultured for 6 days in IL-2-7 and 1uM RO, 1uM AA, 1uM BPTES, or 1uM 2DG, or 1uM nor-NOHA, or 1uM BCATi or DMSO. Annexin V was measured by FACS (n = 6). a-b Data are summarizing 2 experiments with 3 donors each. Representative of a total of 4 independent experiments. c-e, Data are representative of 3 independent experiments with at least 3 donors each. f, Data are summarizing 2 experiments with 3 donors each. Representative of a total of 3 independent experiments. Floating bars indicate the mean, minimum and maximum values within the dataset. Statistics were assessed by one-way ANOVA with Dunnett correction (a-d, f) and two tailed t-test in (e), not significant (ns), p > 0.05; *p < 0.05; **p < 0.01; ***p < 0.001; ****p < 0.0001. Source data
Extended Data Fig. 9
Extended Data Fig. 9. Activated ILC2 use different pathways to sustain function and proliferation.
a-c, ILC2 were expanded in IL-2-7 for 7 days ± inhibitors as described in (Fig. 4d-e). IL-33 was added for the last 6 hours. Percentage of IL-13+ cells (a) IL-5+ cells and gMFI (b) and amphiregulin+ cells and gMFI (c) were measured by FACS (n = 4). d, ILC2 were expanded in IL-2-7 for 7 days and then IL-33 was added for the last 6 hours on cells starved for 1 hour and on glucose add-back condition. Percentage of IL-13+ cells was measured by FACS (n = 4). e, ILC2 were expanded for 7 days in IL-2-7 and then IL-33 was added or not for 72h. Levels of ROS was measured by FACS (n = 4). f, ILC2 were expanded in IL-2-7 for 7 days in the presence or not of the inhibitors MitoTempo (1uM) and Rapamycin (25nM). IL-33 was added for 6 hours. Percentage of IL-13+ cells was measure by FACS (n = 4). a-d, Data are representative of 3 independent experiments with at least 3 donors each. e-f, Data are representative of 2 independent experiments with at least 3 donors each. Floating bars indicate the mean, minimum and maximum values within the dataset. Statistics were assessed by one-way ANOVA with Dunnett correction (a-f), not significant (ns), p > 0.05; *p < 0.05; **p < 0.01; ***p < 0.001; ****p < 0.0001. Source data

References

    1. Eberl, G., Colonna, M., Di Santo, J. P. & McKenzie, A. N. J. Innate lymphoid cells: a new paradigm in immunology. Science348, aaa6566 (2015). - PMC - PubMed
    1. Spits H, et al. Innate lymphoid cells—a proposal for uniform nomenclature. Nat. Rev. Immunol. 2013;13:145–149. - PubMed
    1. Vivier E, et al. Innate lymphoid cells: 10 years on. Cell. 2018;174:1054–1066. - PubMed
    1. Serafini N, et al. Gata3 drives development of RORγt+ group 3 innate lymphoid cells. J. Exp. Med. 2014;211:199–208. doi: 10.1084/jem.20131038. - DOI - PMC - PubMed
    1. Cupedo T, et al. Human fetal lymphoid tissue-inducer cells are interleukin 17-producing precursors to RORC+ CD127+ natural killer-like cells. Nat. Immunol. 2009;10:66–74. doi: 10.1038/ni.1668. - DOI - PubMed

Publication types

MeSH terms