. 2022 Feb;50(1):17-31.
doi: 10.1007/s10827-021-00802-8. Epub 2021 Oct 23.

Computational modeling of seizure spread on a cortical surface

Affiliations

Computational modeling of seizure spread on a cortical surface

Viktor Sip et al. J Comput Neurosci. 2022 Feb.

Abstract

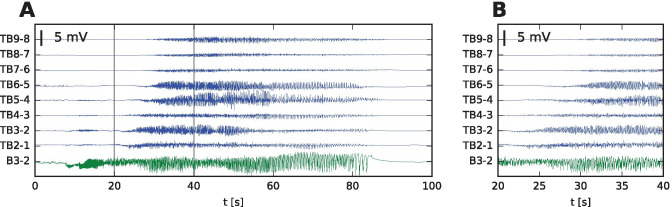
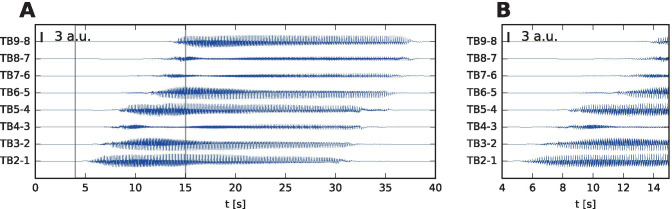
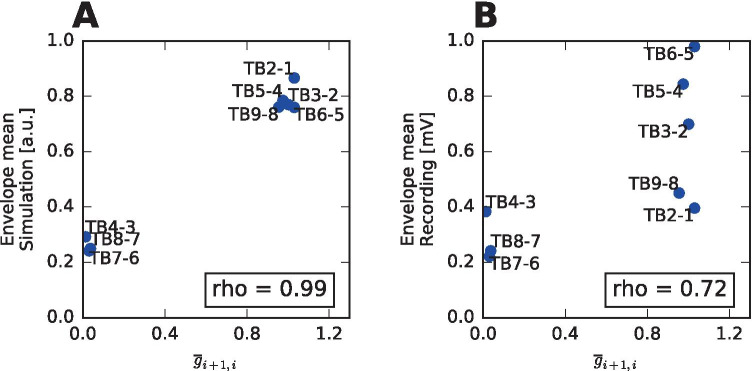
In the field of computational epilepsy, neural field models helped to understand some large-scale features of seizure dynamics. These insights however remain on general levels, without translation to the clinical settings via personalization of the model with the patient-specific structure. In particular, a link was suggested between epileptic seizures spreading across the cortical surface and the so-called theta-alpha activity (TAA) pattern seen on intracranial electrographic signals, yet this link was not demonstrated on a patient-specific level. Here we present a single patient computational study linking the seizure spreading across the patient-specific cortical surface with a specific instance of the TAA pattern recorded in the patient. Using the realistic geometry of the cortical surface we perform the simulations of seizure dynamics in The Virtual Brain platform, and we show that the simulated electrographic signals qualitatively agree with the recorded signals. Furthermore, the comparison with the simulations performed on surrogate surfaces reveals that the best quantitative fit is obtained for the real surface. The work illustrates how the patient-specific cortical geometry can be utilized in The Virtual Brain for personalized model building, and the importance of such approach.

Keywords: Computational modeling; Epilepsy; Seizure propagation.


Conflict of interest statement

The authors declare no competing interests.

Figures

Fig. 1
Fig. 1
TAA pattern recorded in a patient with temporal lobe epilepsy. A Stereo-electroencephalographic (SEEG) traces of the recorded seizure in bipolar representation. B Detail of the seizure onset, delimited by the gray lines in A. The onset of ictal activity is first recorded on B3-2 (in green) located in the right hippocampus. The seizure then spreads to the TB contacts (in blue) located in the right temporal lobe. There the onset shows the distinguishing features of the TAA pattern: oscillating activity with frequency of 8 Hz and slowly increasing amplitude. It is worth noting that at the time of the initial oscillations in the right hippocampus (8 - 18 s), some oscillatory activity appears also on the mesial contacts of TB electrode, but soon disappears. We assume that this initial activity visible on TB electrode is due to the volume conduction from the hippocampus, and does not reflect the source activity close to the TB contacts (see Fig. S1 for details), and we exclude this initial period from the analysis presented later
Fig. 2
Fig. 2
A Hypothesized mechanism behind the TAA pattern, for clarity shown schematically on a two-dimensional brain slice. Left: The seizure spreads across the cortical surface and recruits the cortical tissue from the normal (blue) to the seizing state (red). The generated local field potentials are measured by the contacts (TB1, TB2) of the implanted electrode (green). Right: Time series of the source activity and recorded signals from the SEEG sensors. Dashed vertical line indicates the time of the snapshot in panel A. Every unit (S1, S2) on the cortical surface enters the seizure state through a rapid transition. Due to the spatial averaging of the source activity performed by the SEEG sensors (via the LFP summation), the recorded seizure onset on the sensors (TB1, TB2) is gradual with slowly increasing amplitude of the oscillations. B Outline of the workflow. From patient’s imaging data the structural model of the brain is built and the surface patch around the electrode of interest is extracted. On this and three surrogate surfaces the simulations of seizure spread are performed, and simulated SEEG signals are compared qualitatively and quantitatively with the recorded SEEG
Fig. 3
Fig. 3
A Position of the modeled patches in the whole brain: Real (green) and S-Realistic (blue) surfaces. Axes notation: R - Right, A - Anterior, S - Superior. B Detail of the real and three surrogate surfaces. Electrode contacts (in yellow) are numbered from the 1 on the mesial side to 9 on the lateral side. The distance between the neighboring contacts is 3.5 mm. Surface coloring shows the position of the epileptogenic zone (EZ). C Minimal distance of every electrode contact from the part of the cortical surfaces included in the simulation (green) and from the subcortical structures or the part of the cortical surface not included in the simulation (gray). D Spatial representation of the gain matrix row for contact 3. Blue colors marks the positive weighting, red color negative. E Fraction of the gain matrix associated with the area of given size for monopolar (blue) and bipolar (red) referencing. See the main text (Sect. 3.3) for further details. Inset: area associated with 50% of the gain matrix for monopolar (blue) and bipolar (red) referencing. Note the different scales for monopolar and bipolar referencing
Fig. 4
Fig. 4
Evolution of the simulated seizure. A Extent of the oscillatory activity over time. Blue color represents the normal state (u1<-0.8) and red the seizure state (u1-0.8). B Source activity s(t) in two points on the cortical surface shows the typical Epileptor dynamics with oscillations on two time scales. All points on the cortical surface follow qualitatively similar dynamics. C Snapshots of source activity s(t) over interval of 0.1 s during the seizure reveal the fast wave propagating across the cortical surface
Fig. 5
Fig. 5
Traces of the simulated SEEG signals in bipolar representation. A Full simulated seizure. B Detail of the seizure onset, delimited by gray lines in A
Fig. 6
Fig. 6
Quantitative analysis of the SEEG signals. A For all bipolar signals the envelope of the signal was calculated, and the onset time was determined (see Methods). The signals were shifted so that the onset time of the first bipolar signal was at zero. B Comparison of the onset times for the recorded SEEG and the SEEG simulated on the real surface. In the box two measures of fit are reported: root mean square error RMSE=1ni=1n(ti-t~i)2 and mean absolute error MAE=1ni=1n|ti-t~i|. The red point corresponds to the signals shown in panel A. C Comparison of the mean value of the signal envelope for the recorded SEEG and the SEEG simulated on the real surface. The correlation coefficient ρ is reported in the box
Fig. 7
Fig. 7
Influence of the gain matrix on the signal amplitude. A Correspondence between the term g¯i+1,i=|jGi+i,j-Gi,j| and the envelope mean of the simulated signals. The term g¯i+1,i is the proportionality term between the source activity and the bipolar signal between (i+1)th and ith contact assuming the source activity is spatially homogeneous on the whole cortical patch. Correlation coefficient close to one indicates that the amplitude of the simulated signals can be largely explained by the geometry of the sources and sensors. B Same as A for the recorded signals.
Fig. 8
Fig. 8
Geometry of the sources and sensors affects the spectral properties of the simulated SEEG signals. A Monopolar and bipolar view of seizure onset on selected contacts, as simulated on real surface. B Spectrogram of the two bipolar signals. 1/f normalization (spectral flattening) was applied to the spectrogram. The two bipolar signals differ notably in amplitude and its dominant frequencies. The low frequencies, present in TB6-5, are suppressed on TB7-6 due to the geometrical configuration of the cortical surface

Similar articles

Cited by

References

    1. Alarcon G, Binnie CD, Elwes RDC, Polkey CE. Power spectrum and intracranial EEG patterns at seizure onset in partial epilepsy. Electroencephalography and Clinical Neurophysiology. 1995;94(5):326–337. doi: 10.1016/0013-4694(94)00286-t. - DOI - PubMed
    1. Bartolomei F, Chauvel P, Wendling F. Epileptogenicity of brain structures in human temporal lobe epilepsy: A quantified study from intracerebral EEG. Brain. 2008;131(7):1818–1830. doi: 10.1093/brain/awn111. - DOI - PubMed
    1. Buzsáki G, Anastassiou CA, Koch C. The origin of extracellular fields and currents -EEG, ECoG LFP and spikes. Nature Reviews Neuroscience. 2012;13(6):407–420. doi: 10.1038/nrn3241. - DOI - PMC - PubMed
    1. Doležalová I, Brázdil M, Hermanová M, Horáková I, Rektor I, Kuba R. Intracranial EEG seizure onset patterns in unilateral temporal lobe epilepsy and their relationship to other variables. Clinical Neurophysiology. 2013;124(6):1079–1088. doi: 10.1016/j.clinph.2012.12.046. - DOI - PubMed
    1. Fischl B. FreeSurfer. NeuroImage. 2012;62(2):774–781. doi: 10.1016/j.neuroimage.2012.01.021. - DOI - PMC - PubMed

Publication types