. 2022 Feb;23(1):95-118.
doi: 10.1007/s10162-021-00809-z. Epub 2021 Oct 22.

Access and Polarization Electrode Impedance Changes in Electric-Acoustic Stimulation Cochlear Implant Users with Delayed Loss of Acoustic Hearing

Affiliations

Access and Polarization Electrode Impedance Changes in Electric-Acoustic Stimulation Cochlear Implant Users with Delayed Loss of Acoustic Hearing

Viral D Tejani et al. J Assoc Res Otolaryngol. 2022 Feb.

Abstract

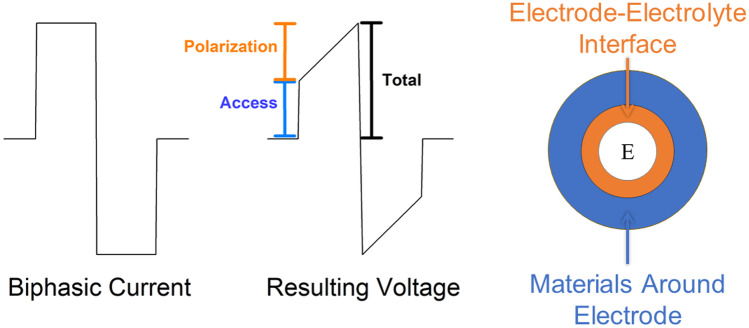
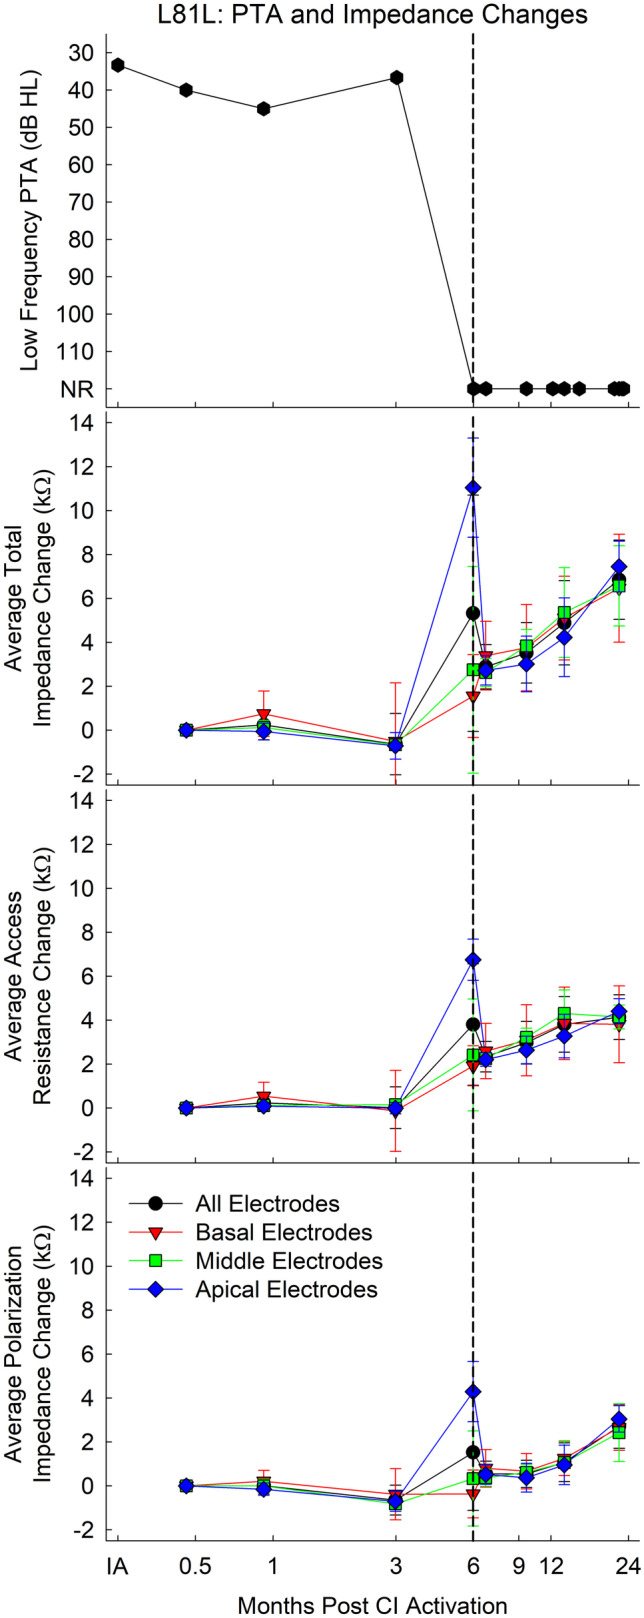
Acoustic hearing can be preserved after cochlear implant (CI) surgery, allowing for combined electric-acoustic stimulation (EAS) and superior speech understanding compared to electric-only hearing. Among patients who initially retain useful acoustic hearing, 30-40 % experience a delayed hearing loss that occurs 3 or more months after CI activation. Increases in electrode impedances have been associated with delayed loss of residual acoustic hearing, suggesting a possible role of intracochlear inflammation/fibrosis as reported by Scheperle et al. (Hear Res 350:45-57, 2017) and Shaul et al. (Otol Neurotol 40(5):e518-e526, 2019). These studies measured only total impedance. Total impedance consists of a composite of access resistance, which reflects resistance of the intracochlear environment, and polarization impedance, which reflects resistive and capacitive properties of the electrode-electrolyte interface as described by Dymond (IEEE Trans Biomed Eng 23(4):274-280, 1976) and Tykocinski et al. (Otol Neurotol 26(5):948-956, 2005). To explore the role of access and polarization impedance components in loss of residual acoustic hearing, these measures were collected from Nucleus EAS CI users with stable acoustic hearing and subsequent precipitous loss of hearing. For the hearing loss group, total impedance and access resistance increased over time while polarization impedance remained stable. For the stable hearing group, total impedance and access resistance were stable while polarization impedance declined. Increased access resistance rather than polarization impedance appears to drive the increase in total impedances seen with loss of hearing. Moreover, access resistance has been correlated with intracochlear fibrosis/inflammation in animal studies as observed by Xu et al. (Hear Res 105(1-2):1-29, 1997) and Tykocinski et al. (Hear Res 159(1-2):53-68, 2001). These findings thus support intracochlear inflammation as one contributor to loss of acoustic hearing in our EAS CI population.

Keywords: Hybrid; access resistance; electric-acoustic stimulation; hearing preservation; impedance; polarization impedance.


Conflict of interest statement

BJG is a consultant for Cochlear Ltd. MRH is co-founder and Chief Medical Officer for iotaMotion, Inc. VDT is a consultant for iotaMotion, Inc. All other authors declare that they have no conflict of interest.

Figures

Fig. 1
Fig. 1
Schematic of a voltage recording in response to a biphasic current pulse. Resulting voltages are used to calculate access resistance and polarization impedance via Ohm’s law
Fig. 2
Fig. 2
Example of subject grouping based on low-frequency audiometric hearing for four subjects. Filled circles indicate thresholds in the implanted ear while open upside-down triangles represent thresholds in the contralateral ear. PTA indicates pure tone average. IA indicates initial activation
Fig. 3
Fig. 3
(A) Mean unaided audiometric thresholds obtained preoperatively and at CI initial activation for 84 ears. Error bars represent ± 1 standard deviation (SD). Panels (B, C) Mean ± 1 SD threshold shifts at 125, 250, and 500 Hz for subjects implanted via cochleostomy (B), round window (C). Panels (D, E) Mean ± 1 SD threshold shifts at 125, 250, and 500 Hz for subjects in the stable/symmetrical group (D) and in the precipitous hearing loss group (E). Shifts greater than 0 dB indicate a loss of hearing
Fig. 4
Fig. 4
The left panel shows the duration of follow-up appointments for subjects in the stable group (dark circles), symmetrical group (light circles), and precipitous group (upside-down triangle) for the clinical impedance dataset. The right panel shows the time point at which hearing loss was discovered for subjects in the precipitous hearing loss group. For both plots, white squares represent mean ± 1 standard deviation, while the thick horizontal line represents the median. The star in the right plot indicates a subject who was an outlier and excluded from calculation of mean and median
Fig. 5
Fig. 5
The left panel shows the recorded voltage (left y-axis) and the calculated impedance (right y-axis) for one electrode. The access voltage (at 6 µs) was used to calculate the access resistance while the total voltage (at 56 µs) was used to calculate total impedance. The mathematical difference of the two was the polarization voltage and impedance. The middle and right panels show the resulting access and polarization voltage matrices for the same subject, which are used to calculate the respective impedances. Note that electrodes 1–4 were disabled, resulting in the rise in polar voltages for those electrodes on the right matrix
Fig. 6
Fig. 6
Example of precipitous loss of hearing (top graph) and rises in electrode impedances (bottom graph) for one Hybrid patient (subject L15L). Error bars indicate ± 1 standard deviation. The vertical dashed line indicates the time point at which hearing loss was discovered. PTA indicates pure tone average. IA indicates initial activation
Fig. 7
Fig. 7
Longitudinal changes in total electrode impedances averaged over all electrodes (first row), basal electrodes (second row), middle electrodes (third row), and apical electrodes (last row), measured via clinical software. The first three columns represent hearing profile (stable/symmetrical, gradual, and precipitous). The last column plots the estimated marginal mean (EMM) change in total impedance over time. Error bars represent standard error of the mean. The thick black horizontal line in each panel represents zero change in impedance
Fig. 8
Fig. 8
Example of precipitous loss of hearing (top graph) and rises in electrode impedances (bottom graphs) for one Hybrid patient (subject L81L). Error bars indicate standard deviation. The vertical dashed line indicates the time point at which hearing loss was discovered. For the y-axis on the top plot, PTA indicates pure tone average and NR indicates no response at the limits of the audiometer. IA on x-axis indicates initial activation
Fig. 9
Fig. 9
Longitudinal changes in total electrode impedances collected via EVT software averaged over all electrodes (first row), basal electrodes (second row), middle electrodes (third row), and apical electrodes (last row) as measured via the EVT research software. The first three columns represents hearing profile (stable/symmetrical, gradual, and precipitous). The last column plots the estimated marginal mean (EMM) total impedance changes over time. The thick black horizontal line in each panel represents zero change in impedance
Fig. 10
Fig. 10
Longitudinal changes in polarization impedances averaged over all electrodes (first row), basal electrodes (second row), middle electrodes (third row), and apical electrodes (last row) measured via the EVT research software. The first three columns represent hearing profile (stable/symmetrical, gradual, and precipitous). The last column plots the estimated marginal mean (EMM) polarization impedance changes over time. Error bars represent standard error of the mean. The thick black horizontal line in each panel represents zero change in impedance
Fig. 11
Fig. 11
Longitudinal changes in access resistance averaged over all electrodes (first row), basal electrodes (second row), middle electrodes (third row), and apical electrodes (last row) measured via the EVT research software. The first three columns represent hearing profile (stable/symmetrical, gradual, and precipitous). The last column plots the estimated marginal mean (EMM) access resistance changes over time. Error bars represent standard error of the mean. The thick black horizontal line in each panel represents zero change in access resistance
Fig. 12
Fig. 12
Estimated marginal mean (EMM) changes in total impedance, polarization impedance, and access resistance for the stable/symmetrical group (left) and the precipitous group (right) at different electrode locations. The thick black horizontal line in each panel represents zero change in impedance. Error bars represent standard error of the mean. Note the differing time scales for the clinical impedance dataset (panels A, B) and the EVT impedance dataset (panels CH)

References

    1. Abbas PJ, Tejani VD, Scheperle RA, Brown CJ. Using neural response telemetry to monitor physiological responses to acoustic stimulation in hybrid cochlear implant users. Ear Hear. 2017;38(4):409–425. doi: 10.1097/AUD.0000000000000400. - DOI - PMC - PubMed
    1. Adunka O, Gstoettner W, Hambek M, Unkelbach MH, Radeloff A, Kiefer J. Preservation of basal inner ear structures in cochlear implantation. ORL J Otorhinolaryngol Relat Spec. 2004;66(6):306–312. doi: 10.1159/000081887. - DOI - PubMed
    1. Adunka OF, Pillsbury HC, Buchman CA. Minimizing intracochlear trauma during cochlear implantation. Adv Otorhinolaryngol. 2010;67:96–107. doi: 10.1159/000262601. - DOI - PubMed
    1. Bester C., Razmovski T, Collins A., Mejia O, Foghsgaard S, Mitchell-Innes A., Shaul C, Campbell L, Eastwood H, O’Leary S (2020). Four-point impedance as a biomarker for bleeding during cochlear implantation. Sci Rep 10, 2777. 10.1038/s41598-019-56253-w - DOI - PMC - PubMed
    1. Briggs Robert, O’Leary Stephen, Birman Catherine, Plant Kerrie, English Ruth, Dawson Pamela, Risi Frank, Gavrilis Jason, Needham Karina, Cowan Robert (2020) Comparison of electrode impedance measures between a dexamethasone-eluting and standard CochlearTM Contour Advance® electrode in adult cochlear implant recipients. Hear Res 390:107924. 10.1016/j.heares.2020.107924 - PubMed

Publication types