. 2022 Mar 4;68(3):450-460.
doi: 10.1093/clinchem/hvab202.

Standardized Workflow for Precise Mid- and High-Throughput Proteomics of Blood Biofluids

Affiliations

Standardized Workflow for Precise Mid- and High-Throughput Proteomics of Blood Biofluids

Angela Mc Ardle et al. Clin Chem. .

Abstract

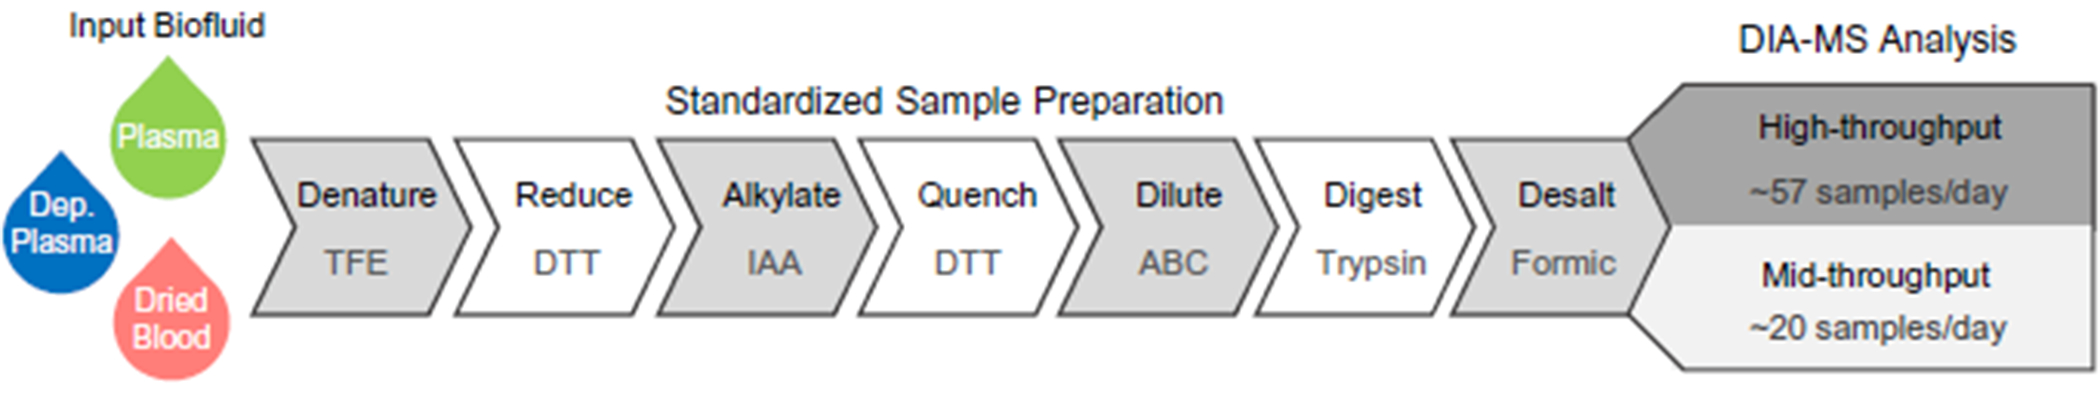
Background: Accurate discovery assay workflows are critical for identifying authentic circulating protein biomarkers in diverse blood matrices. Maximizing the commonalities in the proteomic workflows between different biofluids simplifies the approach and increases the likelihood for reproducibility. We developed a workflow that can accommodate 3 blood-based proteomes: naive plasma, depleted plasma and dried blood.

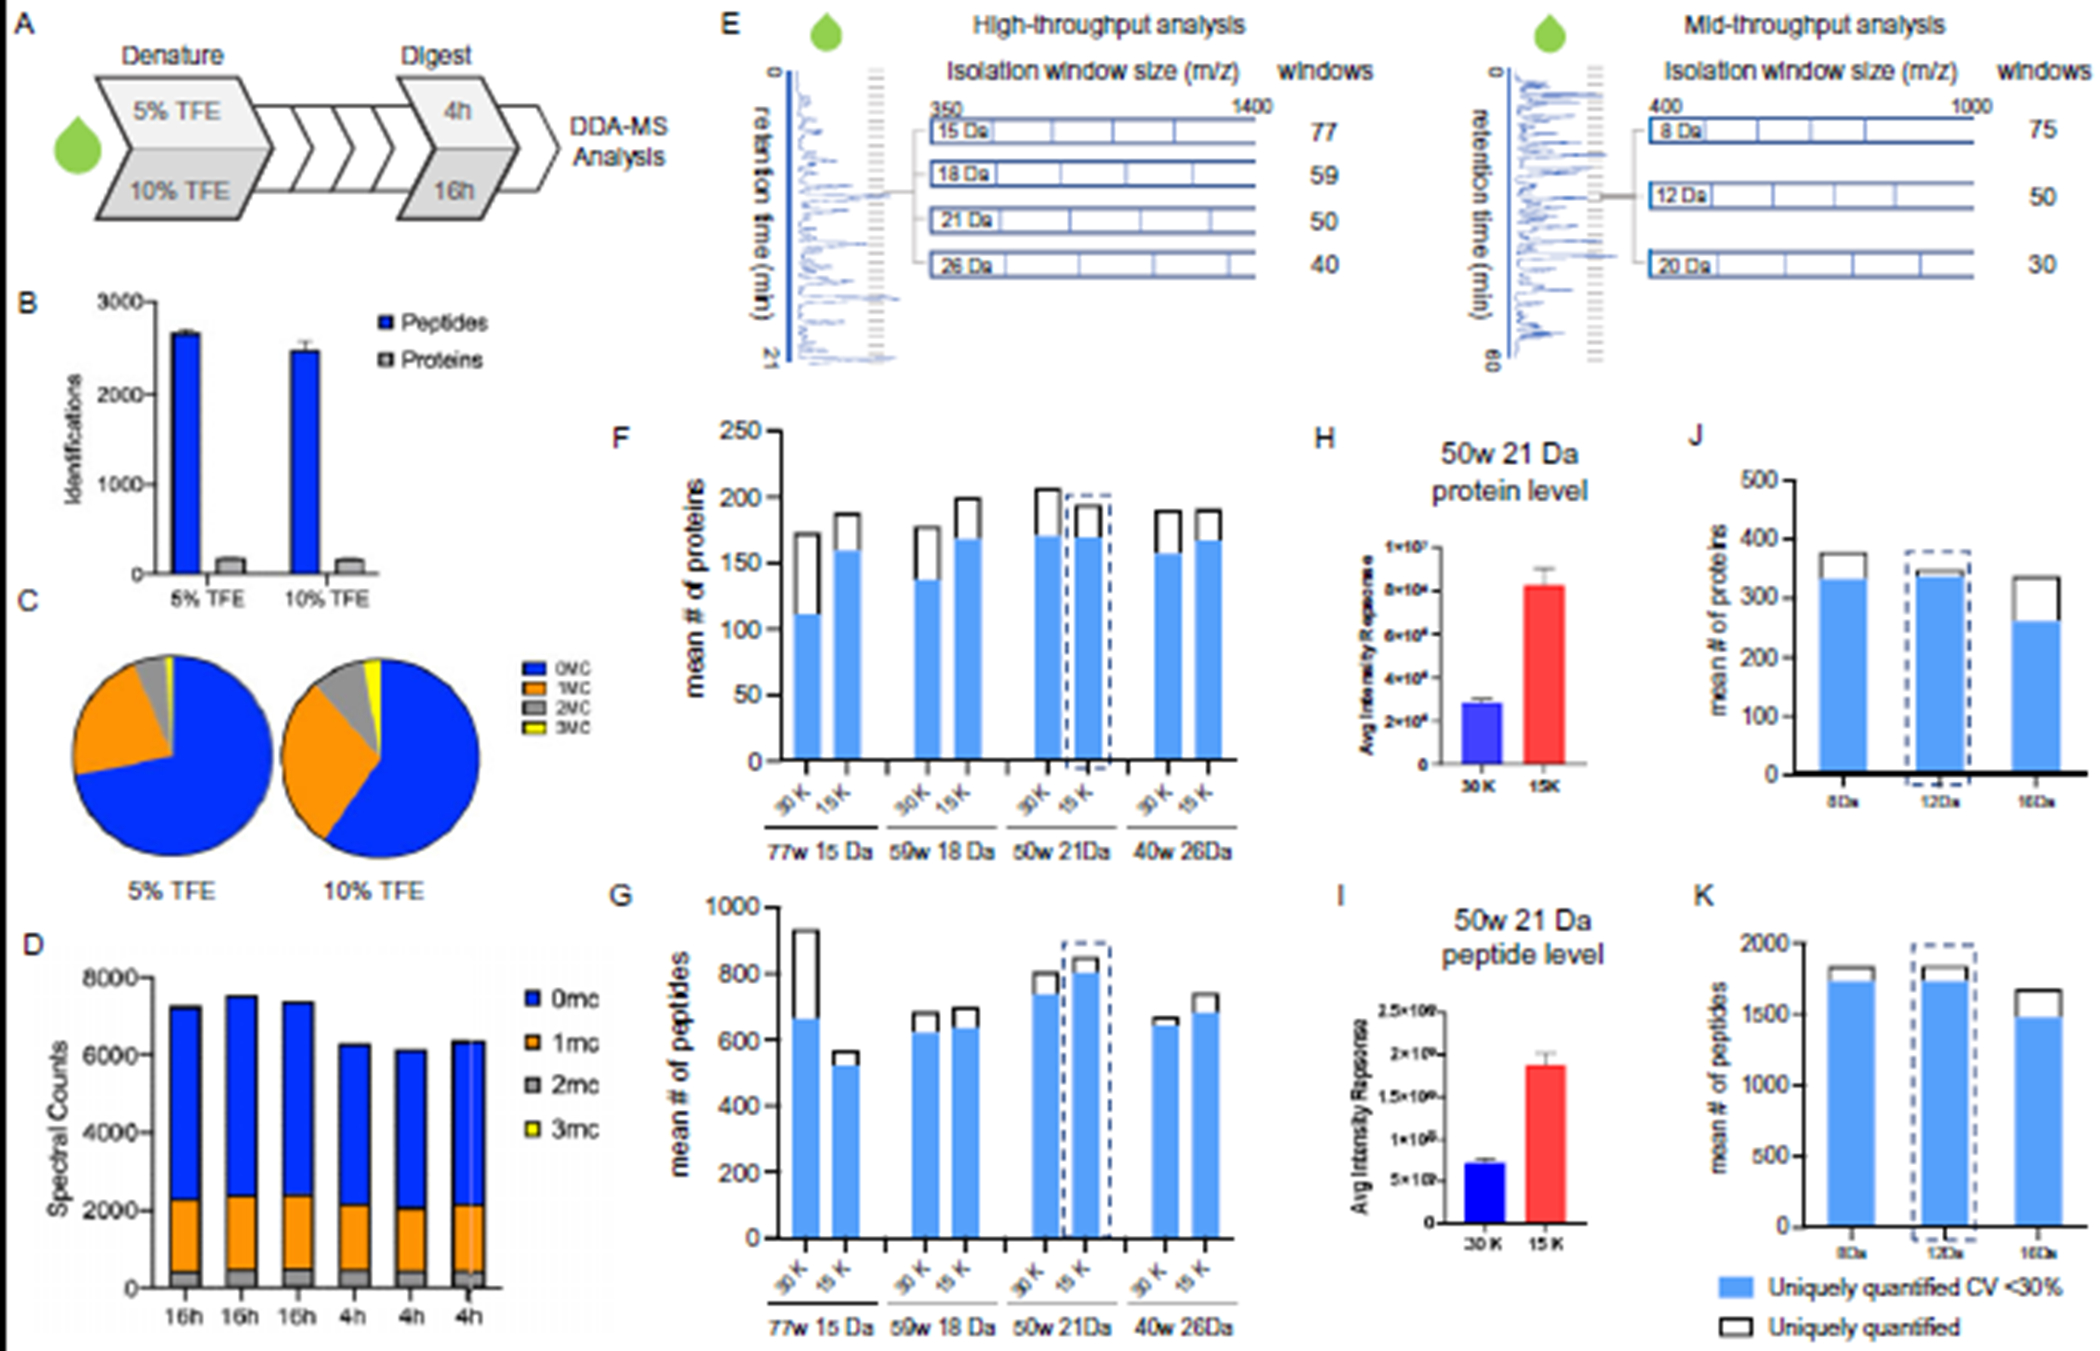
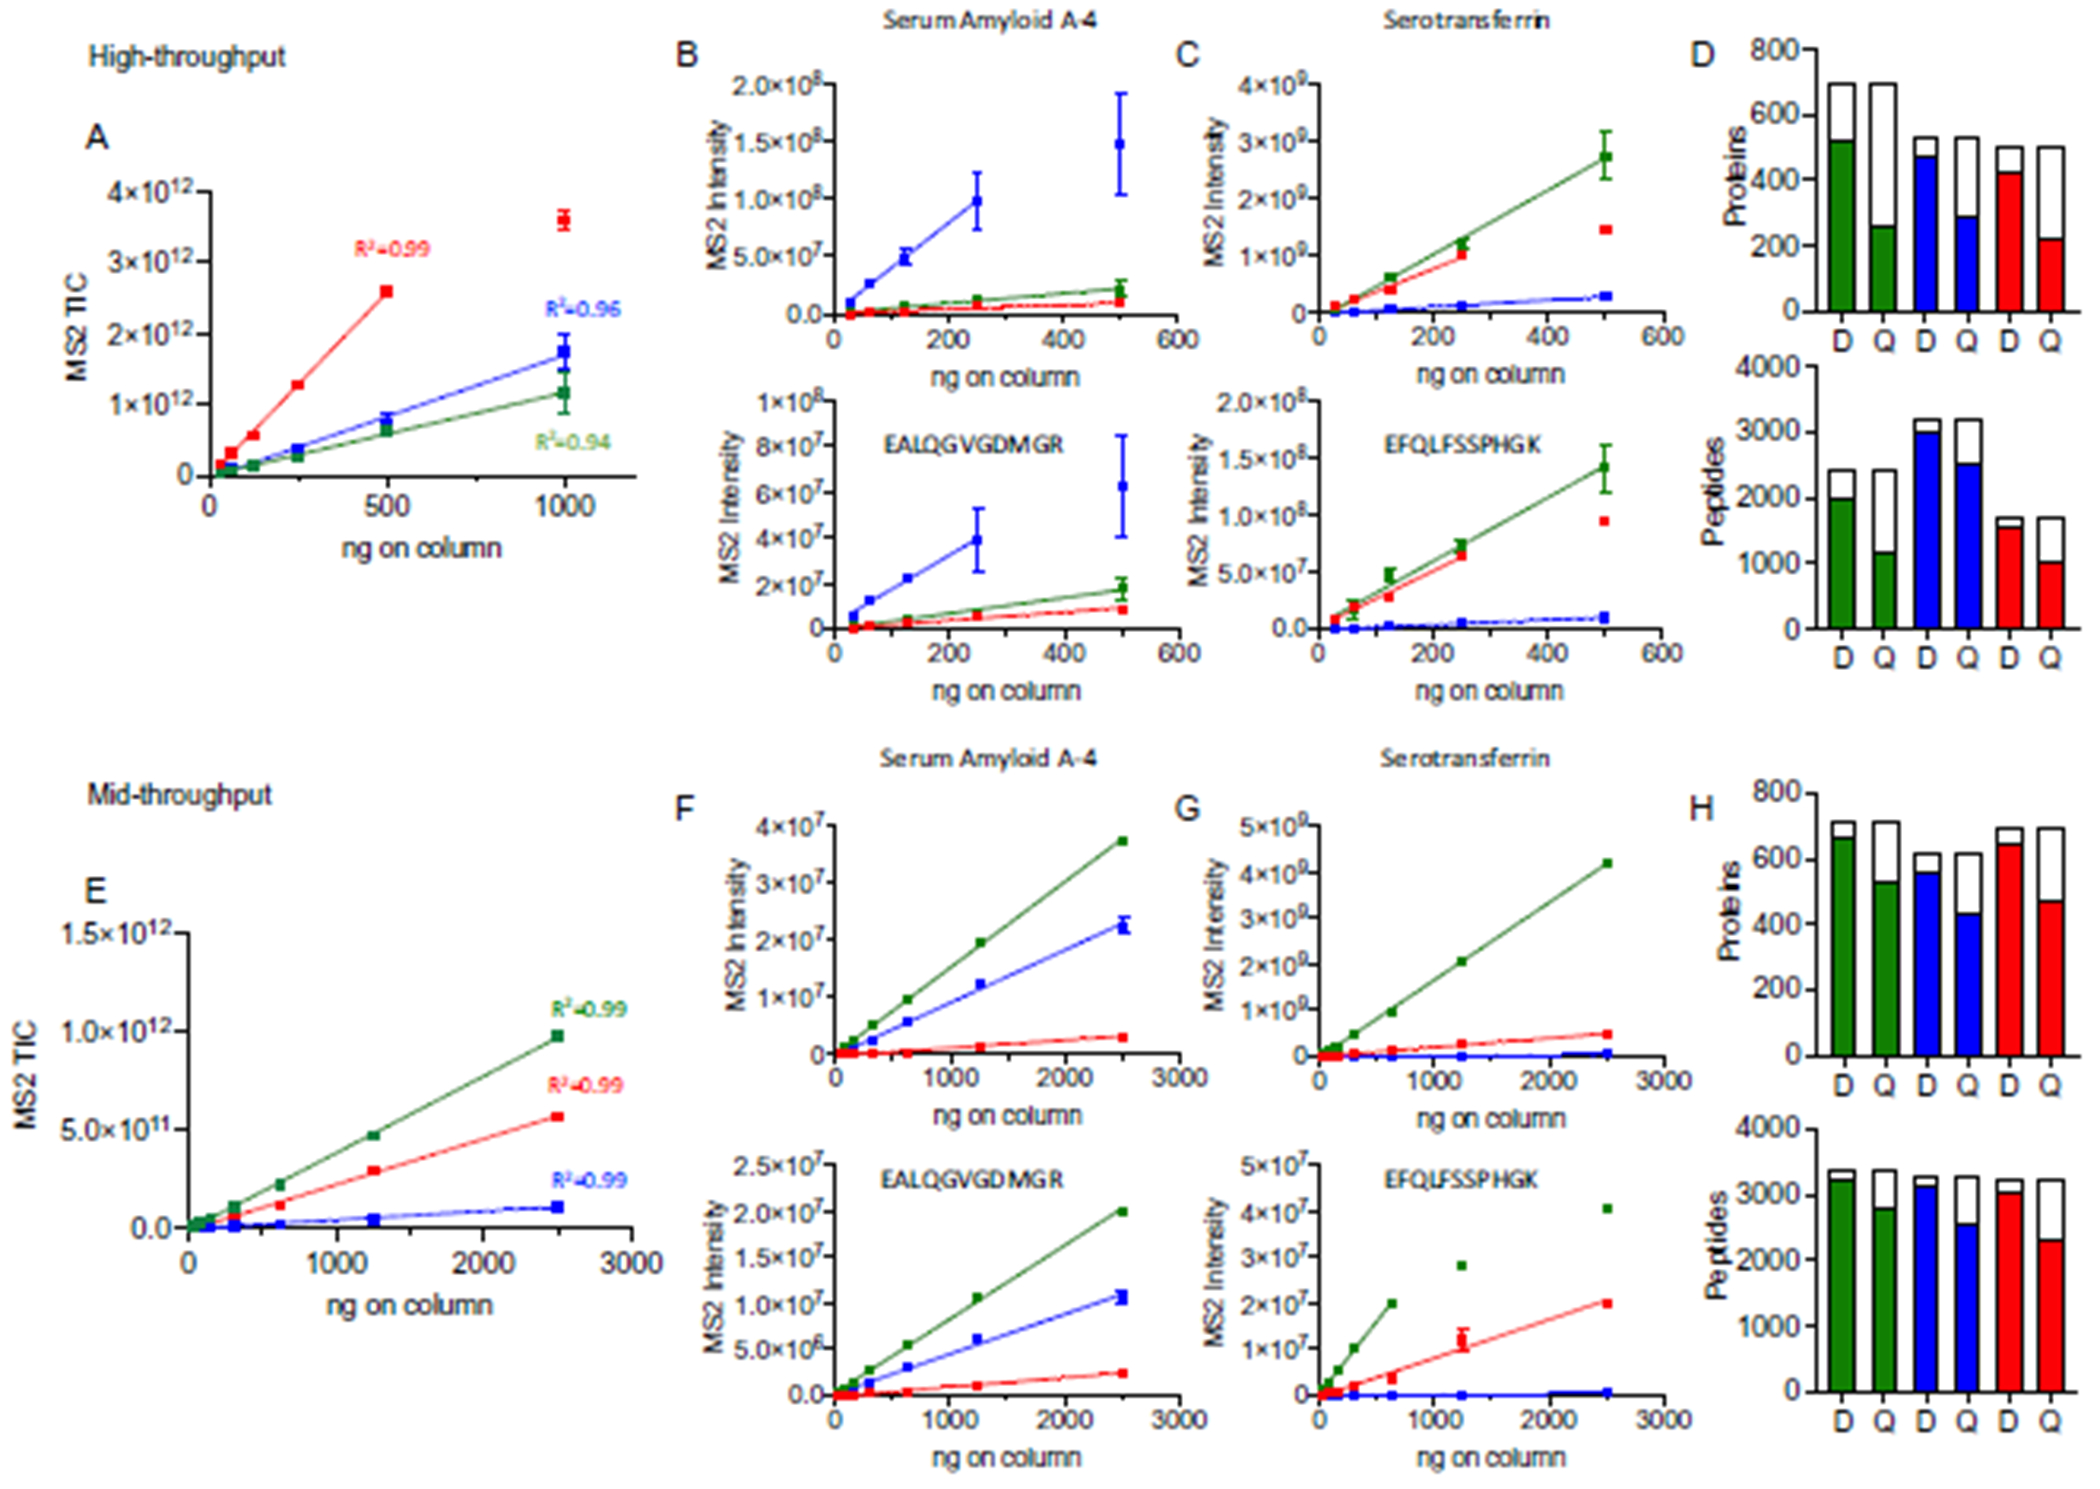
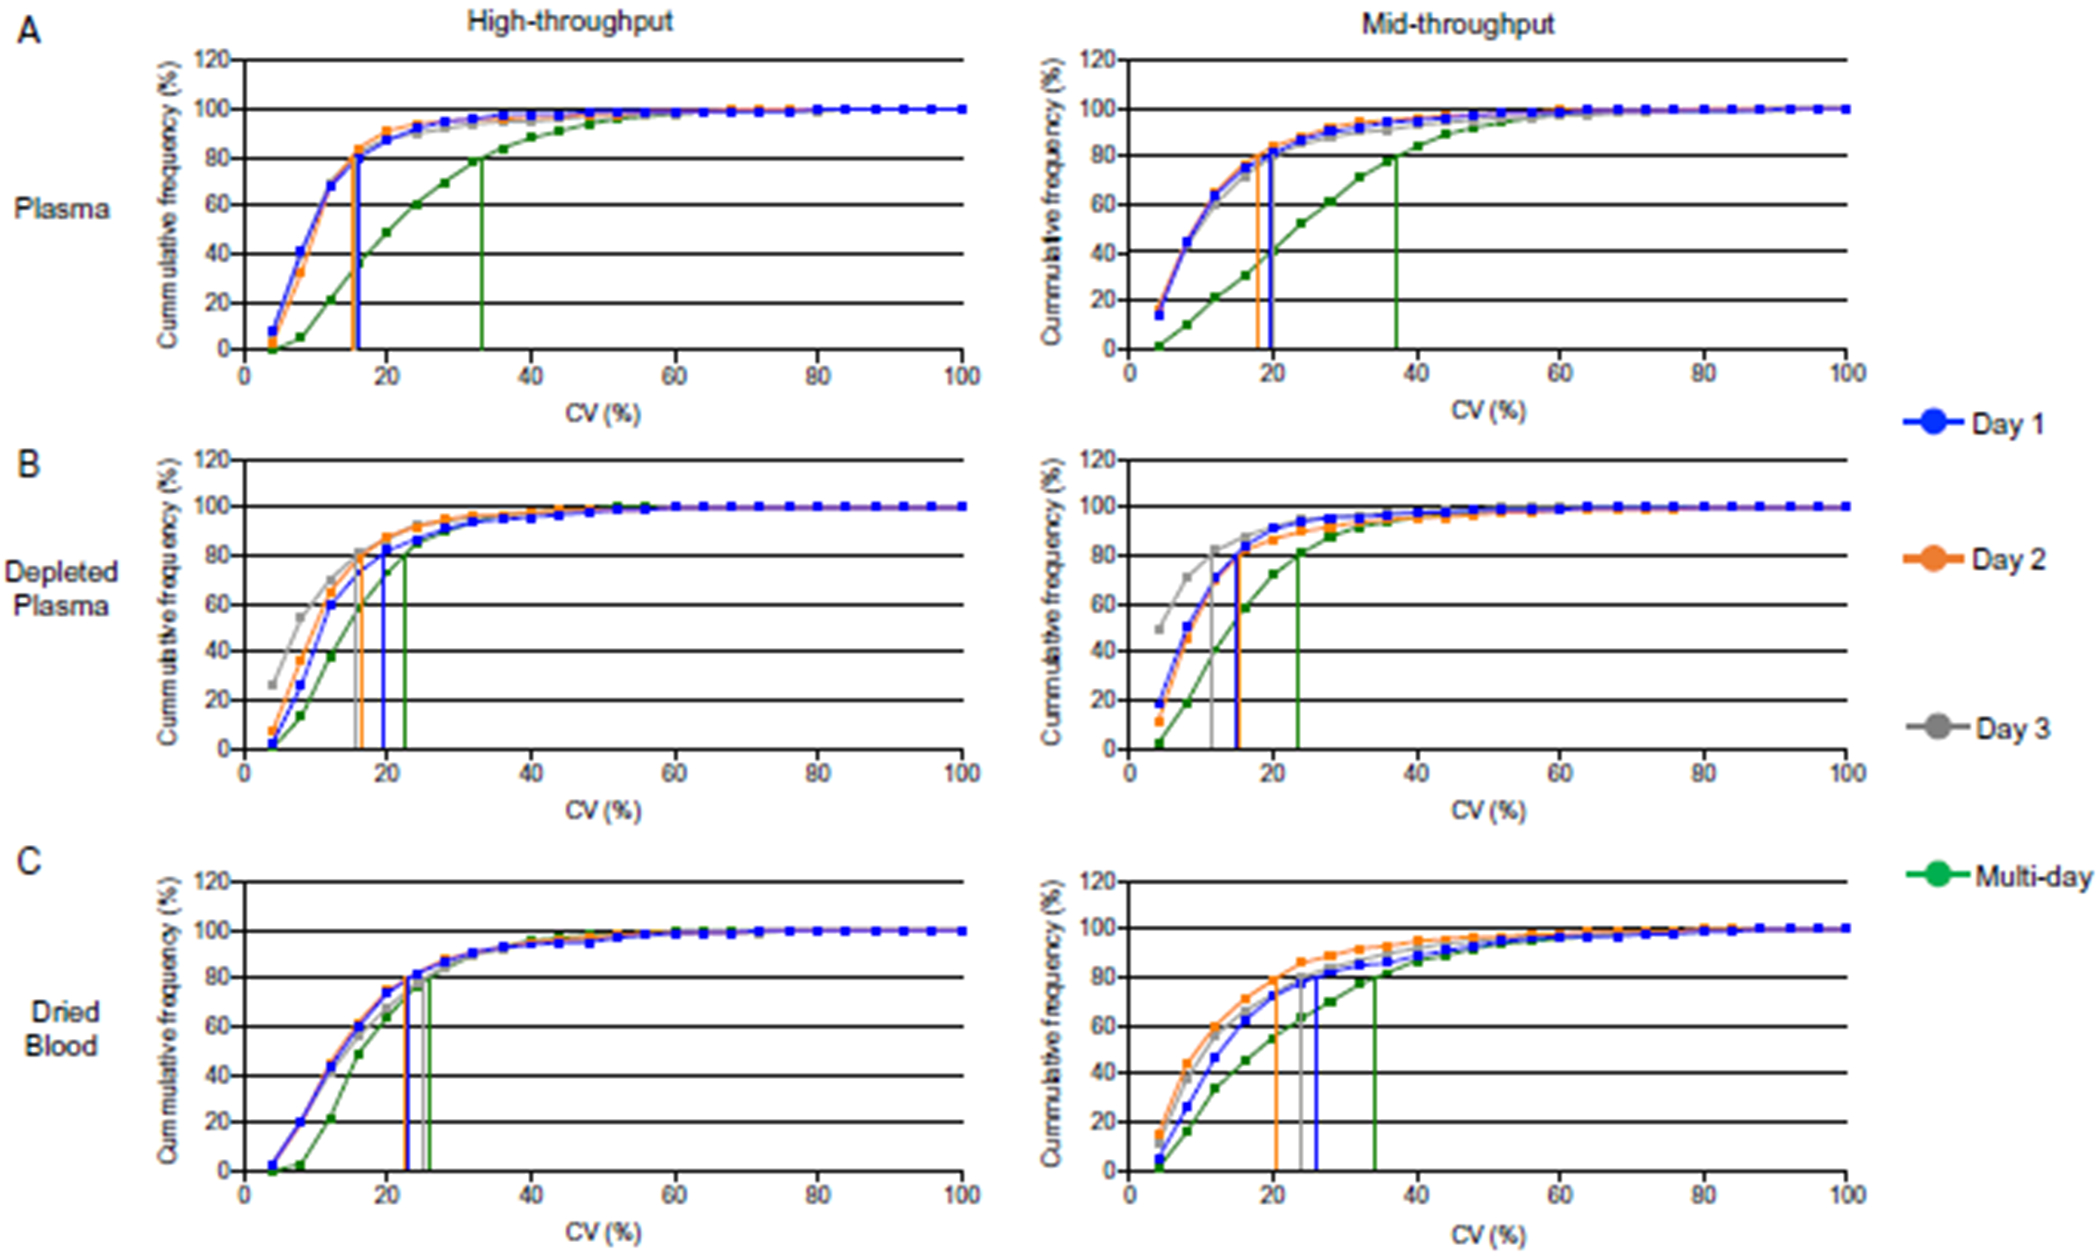
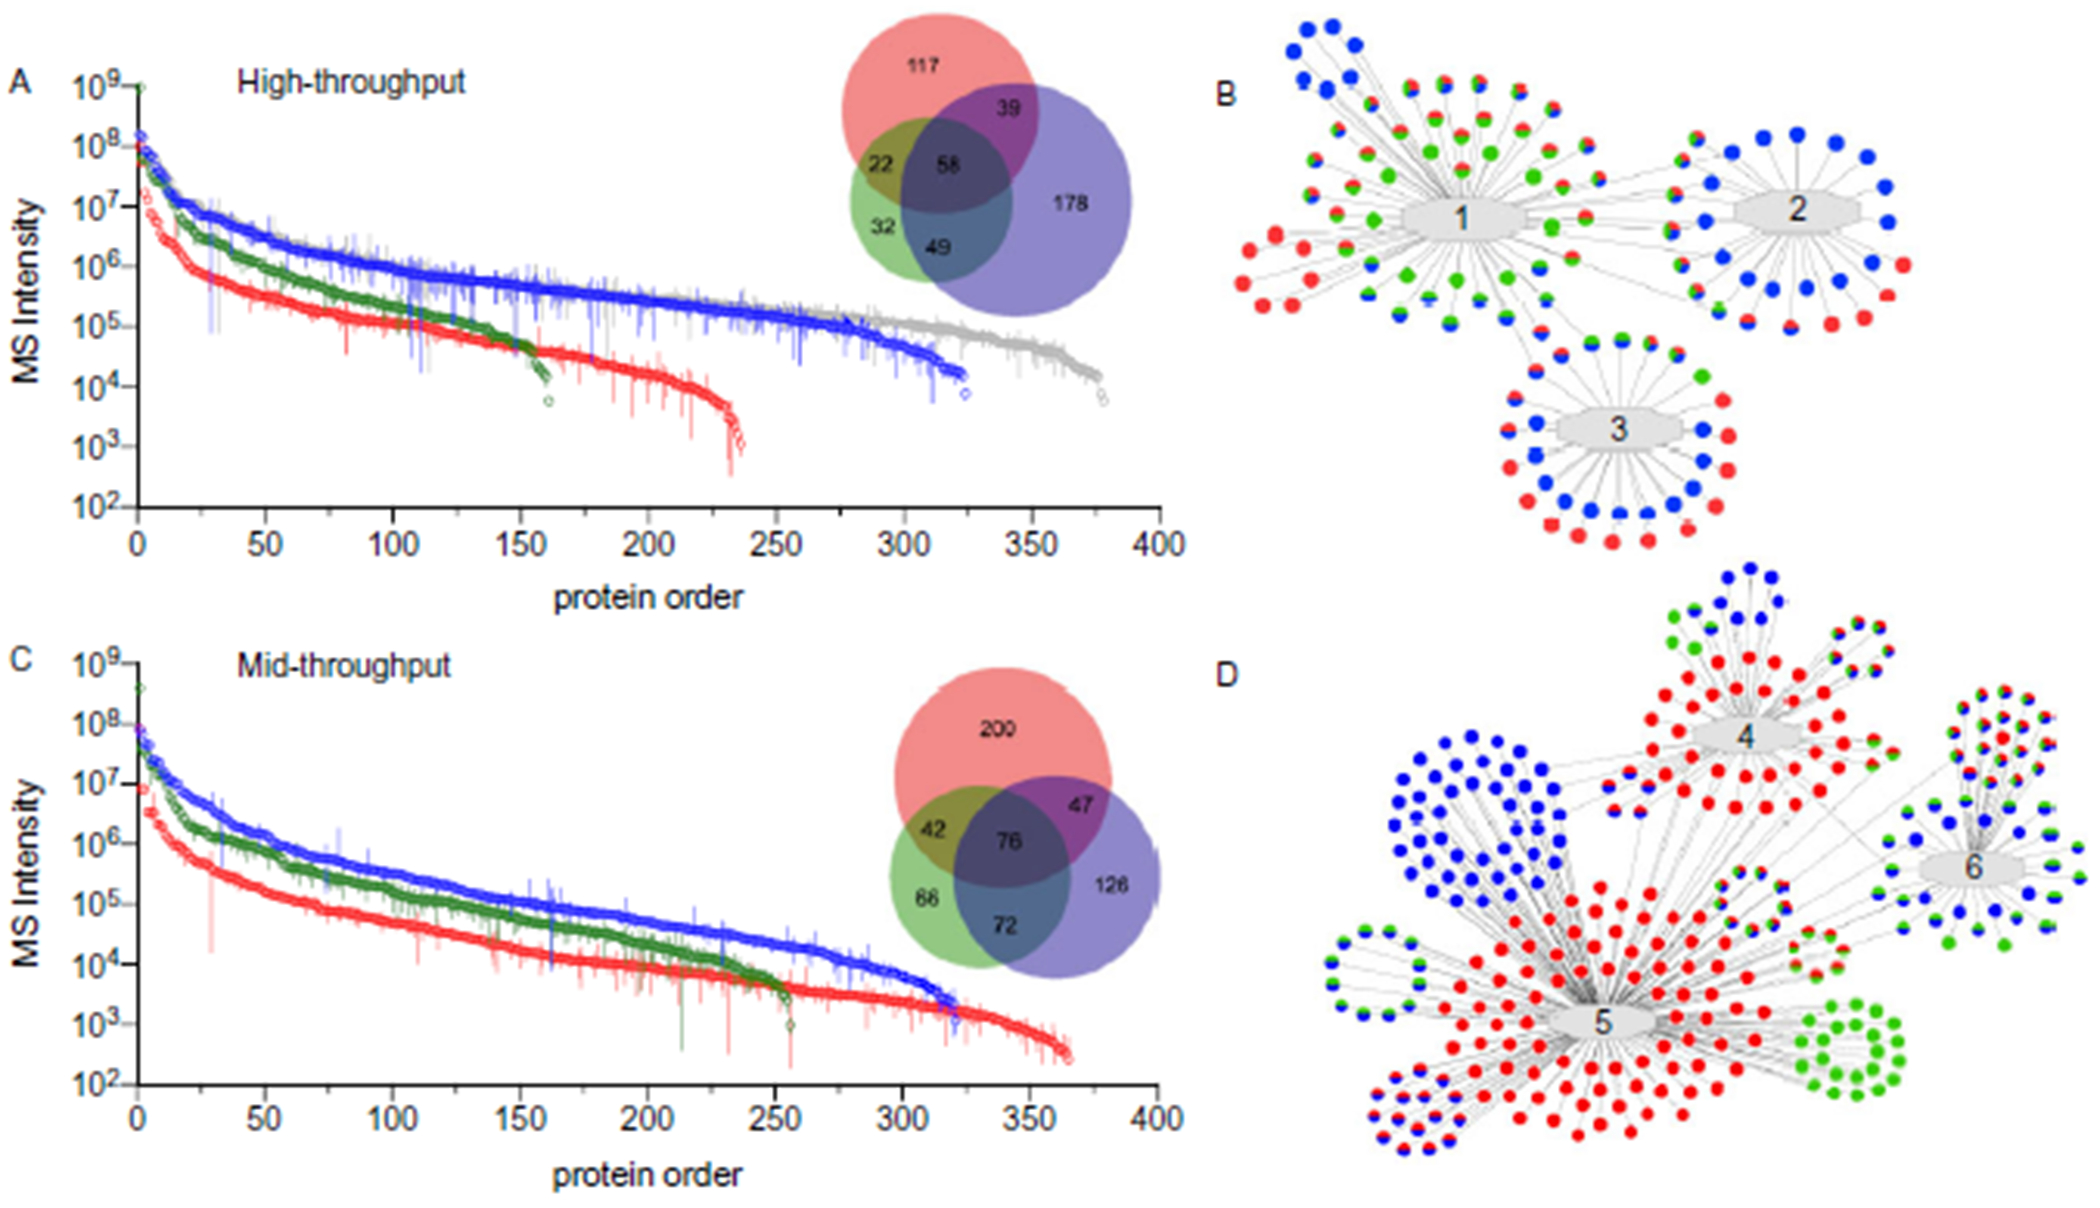
Methods: Optimal conditions for sample preparation and data independent acquisition-mass spectrometry analysis were established in plasma then automated for depleted plasma and dried blood. The mass spectrometry workflow was modified to facilitate sensitive high-throughput analysis or deeper profiling with mid-throughput analysis. Analytical performance was evaluated by the linear response of peptides and proteins to a 6- or 7-point dilution curve and the reproducibility of the relative peptide and protein intensity for 5 digestion replicates per day on 3 different days for each biofluid.

Results: Using the high-throughput workflow, 74% (plasma), 93% (depleted), and 87% (dried blood) displayed an inter-day CV <30%. The mid-throughput workflow had 67% (plasma), 90% (depleted), and 78% (dried blood) of peptides display an inter-day CV <30%. Lower limits of detection and quantification were determined for peptides and proteins observed in each biofluid and workflow. Based on each protein and peptide's analytical performance, we could describe the observable, reliable, reproducible, and quantifiable proteomes for each biofluid and workflow.

Conclusion: The standardized workflows established here allows for reproducible and quantifiable detection of proteins covering a broad dynamic range. We envisage that implementation of this standard workflow should simplify discovery approaches and facilitate the translation of candidate markers into clinical use.

Keywords: depletion; dried blood; mass spectrometry; plasma; proteomics.


Conflict of interest statement

Authors’ Disclosures or Potential Conflicts of Interest: Upon manuscript submission, all authors completed the author disclosure form. Disclosures and/or potential conflicts of interest:

Figures

Fig. 1.
Fig. 1.
Standardized workflow for proteomic analysis of blood biofluids.
Fig. 2.
Fig. 2.. Optimization of digestion and DIA-MS parameters in naive plasma.
(A) Scheme for the optimization of 2 parameters, denaturation conditions and proteolysis time as defined in Fig. 1. (B) Yield of peptide and protein identification under different denaturation buffers conditions (50 mL/L vs 100 mL/L TFE). (C) Number of peptides with 0, 1, 2 or 3 miscleavages (MC) recovered from digestion when using 50 mL/L or 10LL0 mL/L TFE denaturation buffers. Blue, orange, grey and yellow show proportion of peptides with 0, 1, 2, and 3 MC, respectively. (D) Spectral counts of peptides with 0, 1, 2 or 3 MC in each digestion replicate at 4 h and 16 h of incubation. (E) Overview of the DIA-MS optimization experiments. (F and G) The number of proteins and peptides uniquely identified and quantified with CV < 30% when analyzed with 8 different MS settings using the high-throughput workflow. (H and I) Mean intensity response of all proteins and peptides when analyzed with a resolution setting of 15 000 vs 30 000 (50 windows (w) 21 Da method). (J and K) The number of proteins and peptides uniquely identified and quantified with CV < 30% when analyzed with the mid-throughput workflow.
Fig. 3.
Fig. 3.. Comparison of linearity across biofluids and throughputs.
Assessment of total MS2 signal intensity across increasing column load for naive plasma (green), depleted plasma (blue), and dried blood (red) using the (A) high- and (E) mid-throughput workflow. The range of linear response is shown for selected proteins, serum amyloid A-4 (B and F) and serotransferrin (C and G), and representative peptides. Panels (D) and (H) show a summary of the proteins and peptides with an observed LLOD or LLOQ in both throughput methods. Total column height indicates the number of proteins or peptides with 2 or more observations in at least one loading condition. The filled columns indicate the number of proteins or peptides where an LLOD or LLOQ (designated as D or Q) was determined. See Methods for a description of LLOD/Q determination.
Fig. 4.
Fig. 4.. Evaluation of intra-day and inter-day precision in peptide quantification reproducibility.
(A) Plasma, (B) depleted plasma and (C) dried blood C. Left panels: high-throughput. Right panels: mid-throughput. Vertical lines show the CV for 80% of peptides in each sample type and preparation day.
Fig. 5.
Fig. 5.. Comparisons of reliable proteomes in standardized workflows.
Reliable protein observations are shown for naive plasma (green), depleted plasma (blue) and dried blood (red) in the high- (A) and mid-throughput (C) workflows. Proteins were ordered based on the multi-day mean intensity (error bars = SD). Venn diagrams match the stated color scheme. For comparison, proteins identified for naive and depleted plasma were combined (grey) indicating proteome coverage achieved by independent analysis of both biofluids. Representative examples of network analysis are shown for the high- (B) and mid- (D) throughputs. Networks: 1, adaptive immune response; 2, ERK1 and ERK2 cascade; 3, mitochondrial matrix;4, oxidoreductase activity; 5, intracellular non-membrane–bound organelles; 6, complement and coagulation cascade. Dots indicate identified proteins (colors match panels A and C). Gene names were omitted for space.

References

    1. Van Eyk JE, Snyder MP. Precision medicine: role of proteomics in changing clinical management and care. J Proteome Res 2019;18:1–6. - PMC - PubMed
    1. Wright I, Van Eyk JE. A roadmap to successful clinical proteomics. Clin Chem 2017;63:245–7. - PMC - PubMed
    1. Uzozie AC, Aebersold R. Advancing translational research and precision medicine with targeted proteomics. J Proteomics 2018;189:1–10. - PubMed
    1. Malsagova K, Kopylov A, Stepanov A, Butkova T, Izotov A, Kaysheva A. Dried blood spot in laboratory: directions and prospects. Diagnostics (Basel) 2020;10:248. - PMC - PubMed
    1. Xing J, Loureiro J, Patel MT, Mikhailov D, Gusev AI. Evaluation of a novel blood microsampling device for clinical trial sample collection and protein biomarker analysis. Bioanalysis 2020;12:919–35. - PubMed

Publication types