. 2021 Nov 2;33(11):2231-2246.e8.
doi: 10.1016/j.cmet.2021.10.002. Epub 2021 Oct 22.

Cold exposure protects from neuroinflammation through immunologic reprogramming

Affiliations

Cold exposure protects from neuroinflammation through immunologic reprogramming

Martina Spiljar et al. Cell Metab. .

Abstract

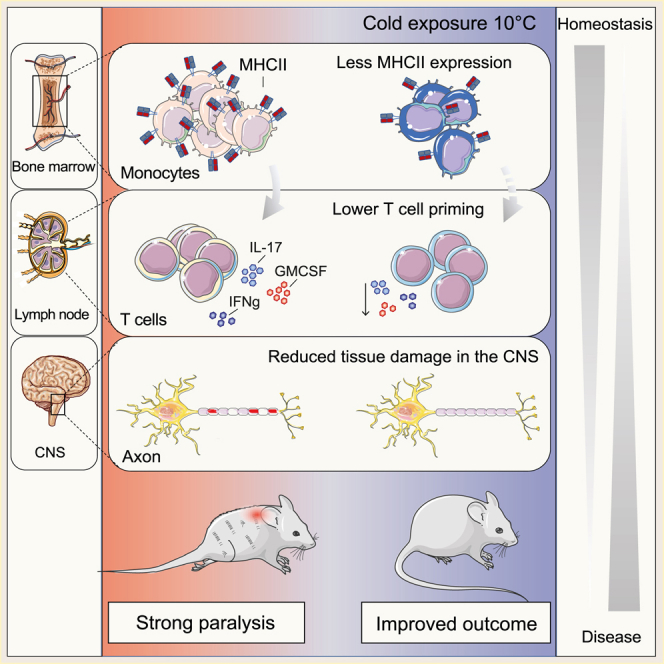
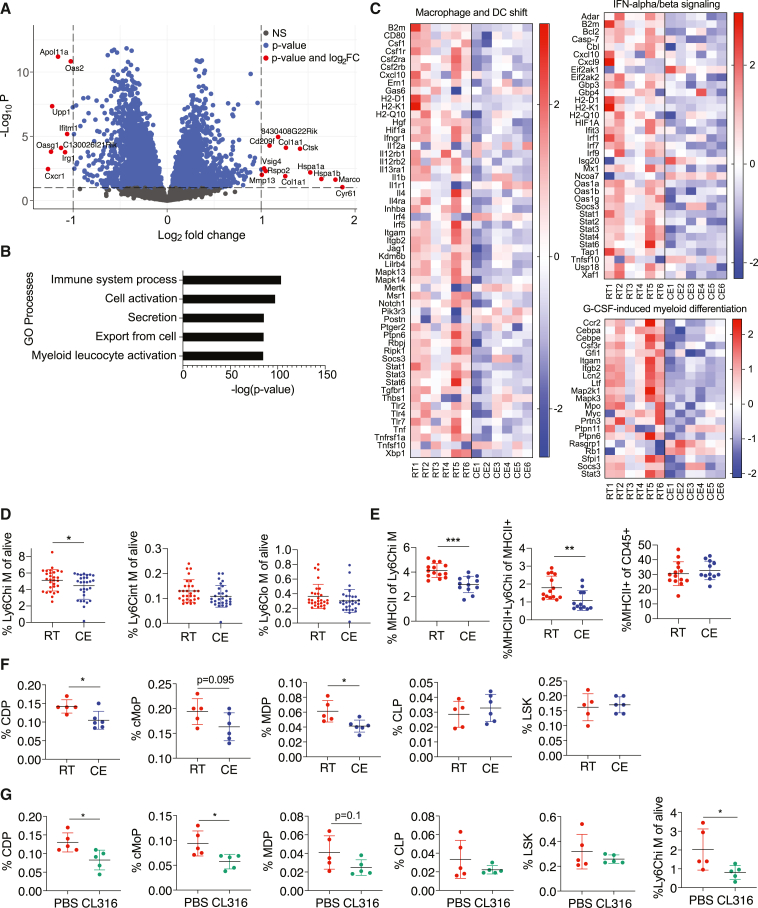
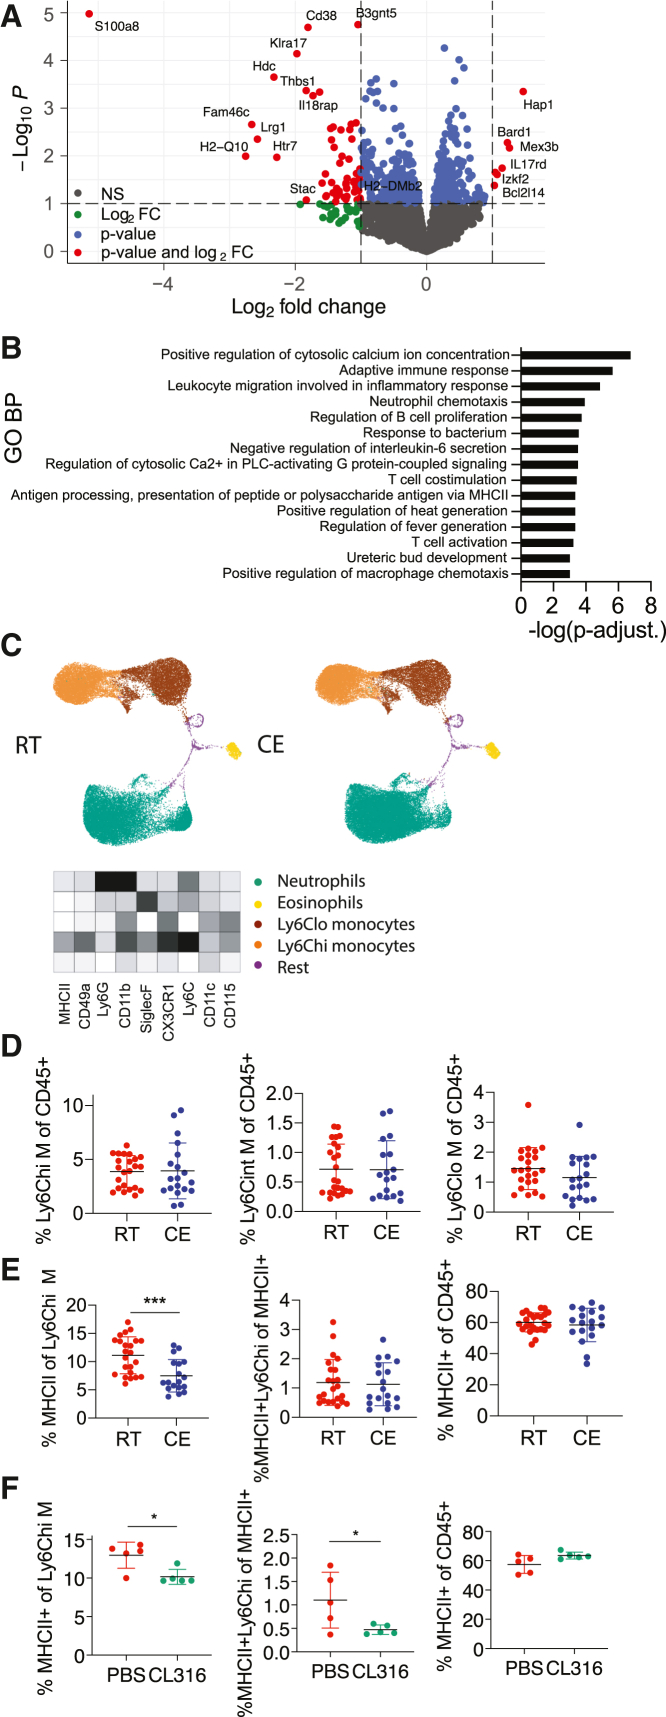
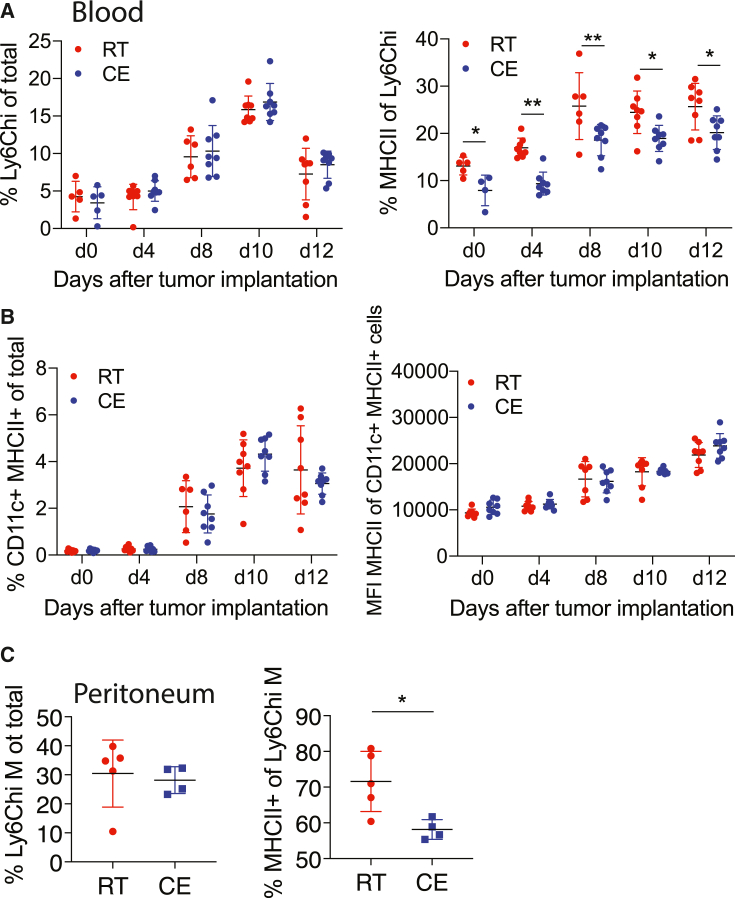
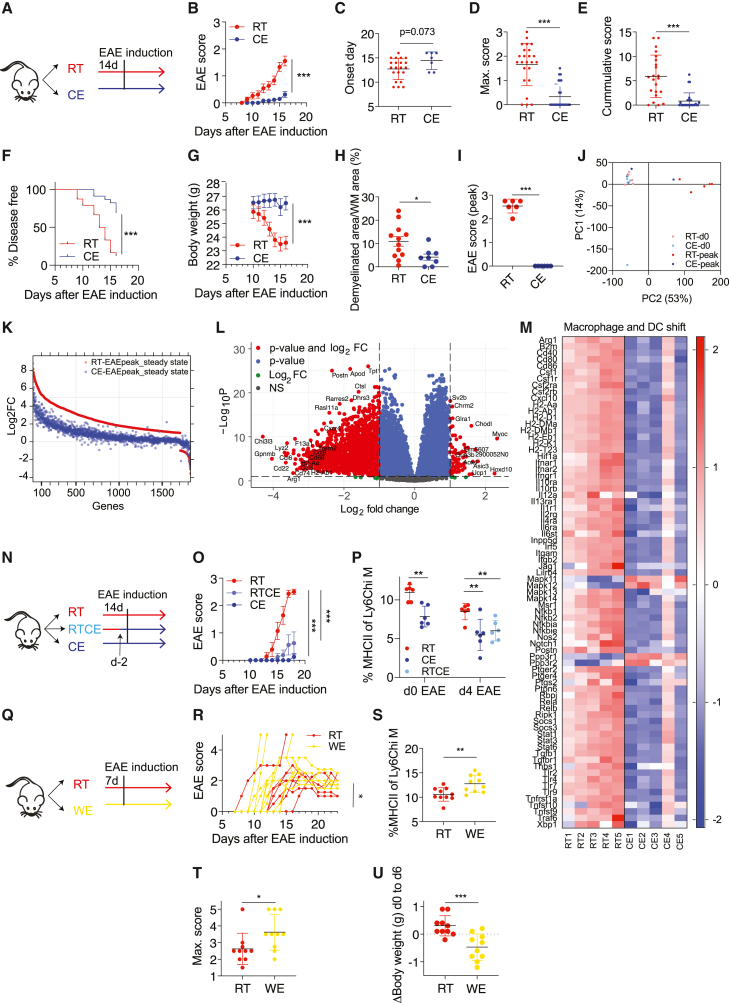
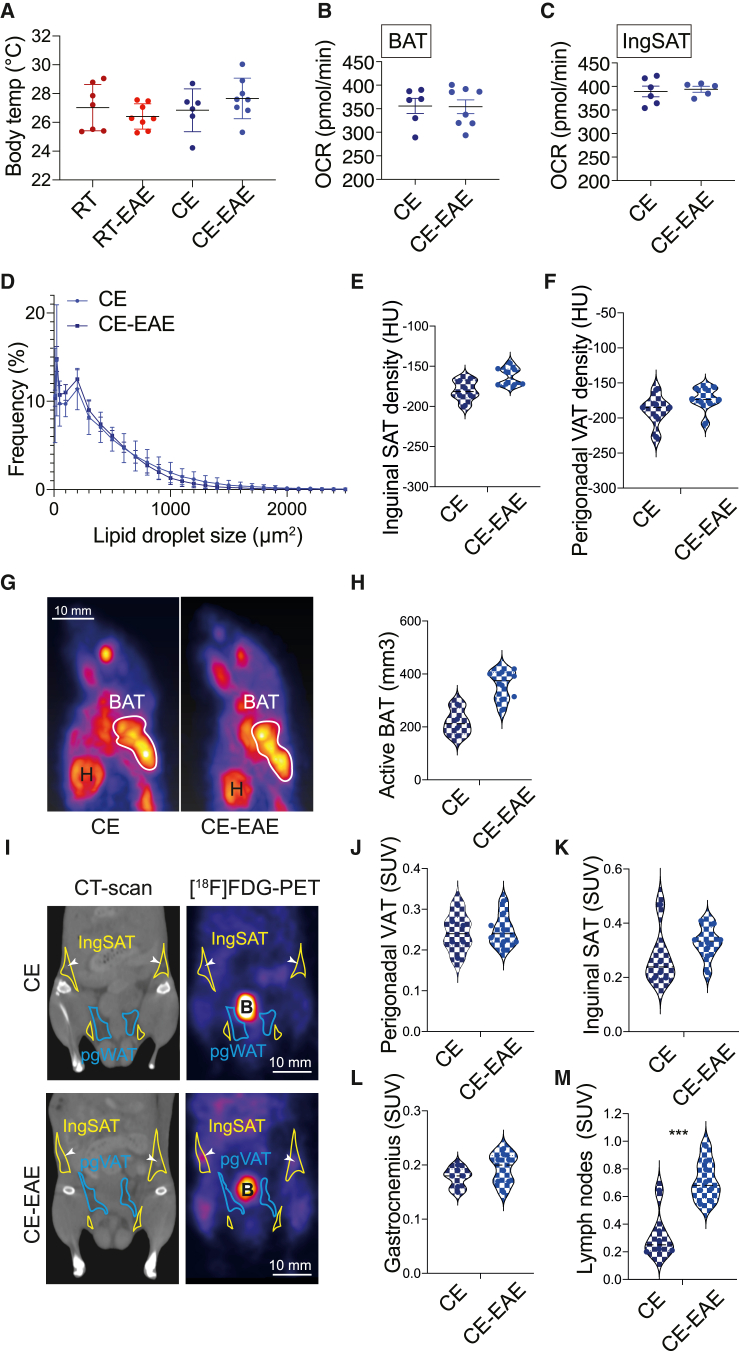
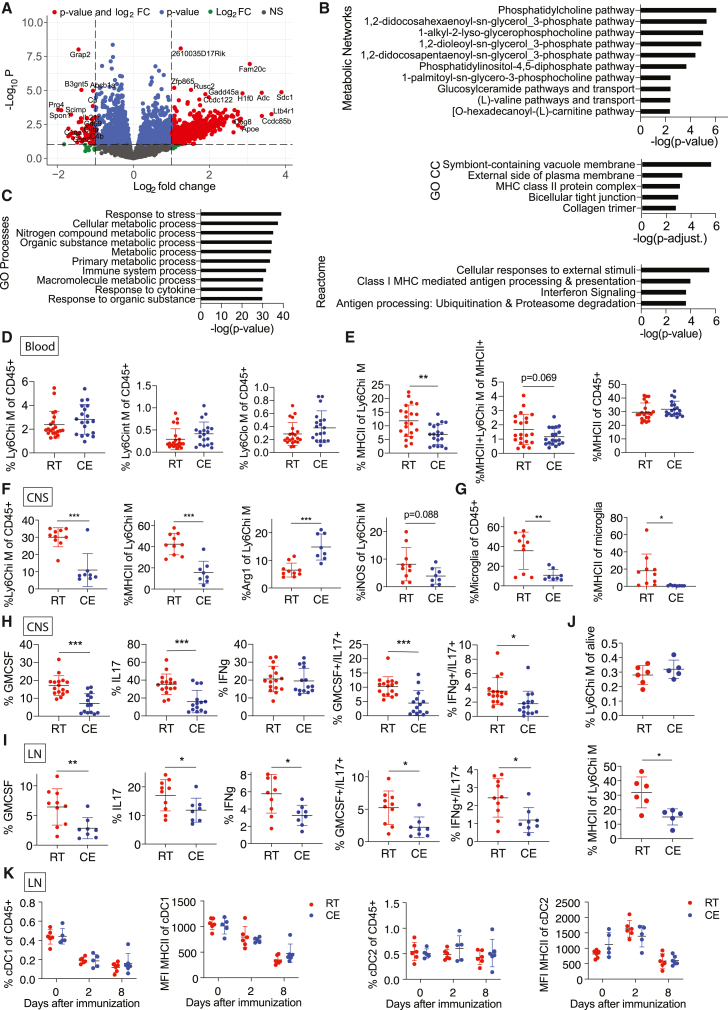
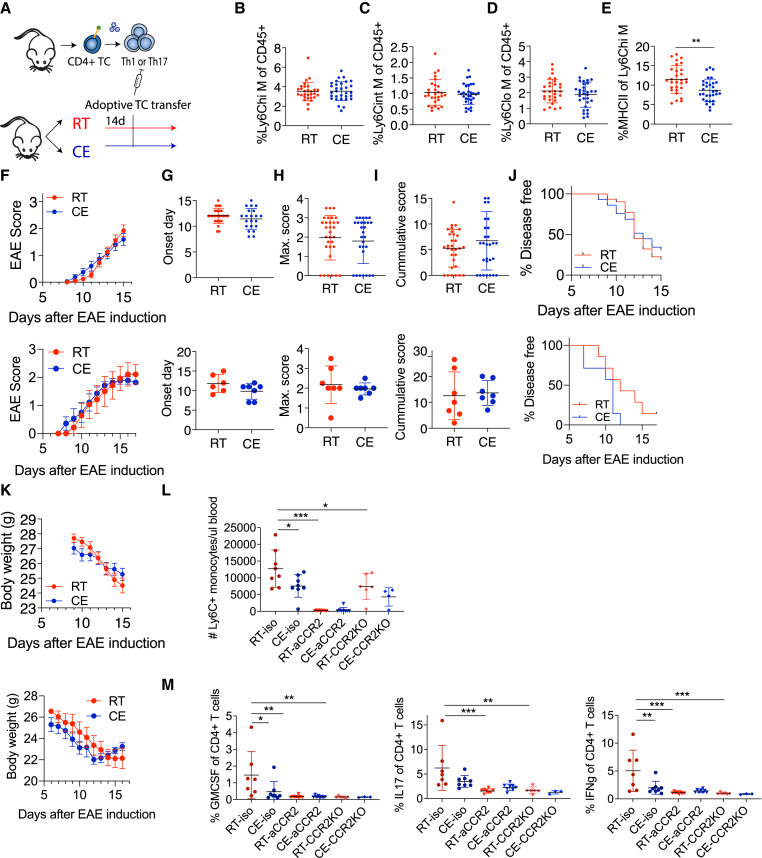
Autoimmunity is energetically costly, but the impact of a metabolically active state on immunity and immune-mediated diseases is unclear. Ly6Chi monocytes are key effectors in CNS autoimmunity with an elusive role in priming naive autoreactive T cells. Here, we provide unbiased analysis of the immune changes in various compartments during cold exposure and show that this energetically costly stimulus markedly ameliorates active experimental autoimmune encephalomyelitis (EAE). Cold exposure decreases MHCII on monocytes at steady state and in various inflammatory mouse models and suppresses T cell priming and pathogenicity through the modulation of monocytes. Genetic or antibody-mediated monocyte depletion or adoptive transfer of Th1- or Th17-polarized cells for EAE abolishes the cold-induced effects on T cells or EAE, respectively. These findings provide a mechanistic link between environmental temperature and neuroinflammation and suggest competition between cold-induced metabolic adaptations and autoimmunity as energetic trade-off beneficial for the immune-mediated diseases.

Keywords: T cell priming; autoimmunity; bone marrow; cold exposure; experimental autoimmune encephalomyelitis; immunometabolism; inflammation; monocytes; multiple sclerosis; neuroinflammation.


Conflict of interest statement

Declaration of interests The authors declare no competing interests.

Figures

None
Graphical abstract
Figure 1
Figure 1
Cold exposure impacts monocytes in the bone marrow (A) Volcano plot showing the up- and downregulated transcripts by RNA sequencing in the bone marrow of cold-exposed mice for 2 weeks at 10°C compared to room temperature counterparts (n = 6 mice per group). (B) MetaCore Gene Ontology processes analysis displaying the top 5 enriched processes of mice as in (A). (C) Shown are 3 of 4 heatmaps that were regulated in the same direction (>80% of genes in the same direction) from the top 10 differentially regulated MetaCore Pathway Maps of mice as in (A). Full pathway names are “Macrophage and dendritic cell phenotype shift in cancer,” “Immune response_IFN-aplha/beta signaling via JAK/STAT” and “G-CSF induced myeloid differentiation.” (B and C) The cutoff on differentially regulated genes considered for the pathway analysis is p < 0.05 and pathways are considered deregulated with p < 0.05. Shown are –log(p value).(D) Flow cytometry analysis of bone marrow cells of mice as in (A). Percentage of Ly6C high (hi), intermediate (int), and low (lo) monocytes of total, single CD45+ alive cells. (E) Percentage of MHCII+ cells of Ly6Chi monocytes (left), MHCII+ Ly6Chi monocytes of total MHCII+ cells (middle), and total MHCII+ cells of CD45+ cells (right) of mice as in (A), as determined by flow cytometry. (F) Bone marrow immune cell progenitors of mice as in (A) were analyzed by flow cytometry and percentage of total alive single CD45+ cells is shown for common dendritic cell progenitors (CDPs), common monocyte progenitors (cMoPs), monocyte-dendritic cell progenitors (MDPs), common lymphoid progenitors (CLPs), and Lin Sca1+ c-KIT+ cells (LSKs), as determined by flow cytometry. (G) Immune cell progenitor flow cytometry analysis of mice that were intraperitoneally (i.p.) injected with beta 3 adrenoreceptor agonist CL316,243 (CL316) or vector (PBS) daily for 1 week. Percentage of total alive CD45+ cells is shown for CDPs, cMoPs, MDPs, CLPs, LSKs, and Ly6Chi monocytes. (B and -C) The cutoff on differentially regulated genes considered for the pathway analysis is p < 0.05 and pathways are considered deregulated with p < 0.05. Shown are –log(p value). (D–G) Each dot represents one mouse. Shown is mean ± SD. Significance was calculated using Student’s t test, p < 0.05, ∗∗p < 0.01, ∗∗∗p < 0.001. Pool of five experiments (D), two experiments (E), one representative experiment of three out of five that were similar (F), and one representative of two (G) are shown.
Figure 2
Figure 2
Cold exposure modulates monocytes in the circulation (A) Volcano plot showing the up- and downregulated transcripts by RNA sequencing of monocytes that were MACS (anti-PE) and FACS (CD115-PE+) sorted from blood of 2-week cold-exposed (10°C) mice compared to room-temperature mice. (B) 15 most enriched Gene Ontology biological processes of monocytes as in (A). Genes were considered differentially regulated with p < 0.05. Shown are –log(p value). (C) Blood immune cells of mice as in (A) visualized using UMAP and clustered using FlowSOM algorithm in R. Ly6Chi monocytes (green), Ly6Clo monocytes (yellow), neutrophils (brown), eosinophils (orange), and others. Heatmap shows median relative expression of all panel markers. (D) Flow cytometry analysis of blood cells from mice as in (A). Percentage of Ly6C high (hi), intermediate (int), and low (lo) monocytes of total, single CD45+ cells. (E) Percentage of blood MHCII+ cells of Ly6Chi monocytes (left), MHCII+ Ly6Chi monocytes of total MHCII+ cells (middle), and total MHCII+ cells of total, single CD45+ cells (right) of mice as in (A). (F) Blood cell analysis after 1 week of daily i.p. injected beta 3 adrenoreceptor agonist CL316,243 or vector (PBS). Percentage of MHCII+ cells of Ly6Chi monocytes (left), MHCII+ Ly6Chi monocytes of total MHCII+ cells (middle), and total MHCII+ cells of CD45+ cells (right). (D–F) Each dot represents one animal. Shown is mean ± SD. Significance was calculated using Student’s t test, p < 0.05, ∗∗p < 0.01, ∗∗∗p < 0.001. Pool of three experiments (D and E).
Figure 3
Figure 3
Cold exposure decreases monocyte MHCII in inflammatory mouse models (A) Blood Ly6Chi monocytes and their MHCII expression were analyzed by flow cytometry on different days after B16-GMCSF subcutaneous (s.c). tumor implantation in mice that were cold- (10°C) or room-temperature-exposed for 2 weeks before and during tumor growth. (B) Blood CD11c+MHCII+ cells and MHCII mean fluorescence intensity (MFI) of MHCII+CD11c+ cells were determined by flow cytometry from mice as in (A). (C) Flow cytometry analysis of peritoneal fluid cells 24 h after i.p. injection with thioglycollate into 2-week cold-exposed (10°C) or room-temperature mice. Each dot represents one animal. Shown is mean ± SD. Significance was calculated using multiple t test with Holm-Sidak correction (A and B) or Student’s t test (C), p < 0.05, ∗∗p < 0.01.
Figure 4
Figure 4
Cold exposure attenuates neuroinflammation (A and B) Scheme showing the experimental setup for EAE and cold exposure (A). EAE was induced by s.c. immunization with MOG35-55 peptide in complete Freund’s adjuvant (day 0) and pertussis toxin i.p. (day 0 and 2). Mice were exposed to cold or room temperature (10°C) for 2 weeks before and during EAE. Clinical symptoms of EAE were monitored according to a standardized scoring system (B). (C–G) Day of EAE onset, i.e., when first symptoms occur (C); maximum disease score, i.e., the highest score an individual mouse reached during the experiment (D); cumulative disease score, i.e., the sum of all scores each individual mouse reached during the experiment (E); and the percentage of disease-free mice (F) and body weight (G) of mice as in (A). (H) Quantification of demyelinated area expressed as percentage of white matter (WM) detected by Luxol Fast Blue and periodic acid-Schiff (LFB-PAS) of spinal cords from mice as in (A). (I–M) Spinal cords of healthy and peak EAE mice that were kept at room temperature or cold exposed for 2 weeks were used for RNA sequencing. Scores of the respective mice at sacrifice (I), principal component analysis (J), relativeness analysis of logFC of room temperature healthy versus EAE spinal cords (red) and cold exposure healthy versus EAE spinal cords (blue) with p < 0.05 and FC > 2 (K), volcano plot (gene Gpx3 was excluded for better visualization) (L), and genes of top1 deregulated pathway “Macrophage and DC phenotype shift in cancer” from MetaCore Pathway Maps with p < 0.05 (M). (N and O) Scheme showing the experimental setup. Mice were exposed to cold temperature for either 2 weeks or 2 days before and continued during EAE and compared to room temperature controls (N). EAE was induced as in (A) and EAE scores are shown (O). (P) Percentage of MHCII expression on Ly6Chi blood monocytes was determined using flow cytometry on day 0 and day 4 after EAE induction. (Q and R) Scheme showing the experimental setup (Q). Mice were exposed to warm temperature of 34°C for 1 week before and during EAE (as in A) and compared to room temperature controls. Each curve represents one individual mouse (R). (S) Percentage of MHCII expression of Ly6Chi blood monocytes from mice as in (Q) was determined using flow cytometry on day 0 of EAE. (T and U) Maximum disease score (T) or delta of body weight gain from day 0 to day 6 of warm exposure (U). (B–S) Data (B–G) represent pool of 3 experiments (n = 6–10 mice per group per experiment). Shown is mean ± SEM, two-way ANOVA (B, G, O, and R), Student’s t test (C–E, I, and S–U), Mantel-Cox (F), multiple t test with Holm-Sidak correction (P), p < 0.05, ∗∗p < 0.01, ∗∗∗p < 0.001.
Figure 5
Figure 5
The thermogenic response and resource allocation are not reduced by EAE (A) Body temperature shown as the mean temperature of the two eyes as determined via infrared images of mice on day 7 of EAE. Mice were cold exposed for 2 weeks before and during EAE or steady state. Control mice were at room temperature for the same duration. (B and C) Oxygen consumption rate of interscapular brown (BAT; B) and inguinal subcutaneous adipose tissue (ingSAT; C) on day 8 of EAE or in steady state after 3 weeks of cold exposure (CE) and 3 h of fasting. (D) Quantification of lipid droplet size distribution in inguinal SAT. Slides were analyzed in technical duplicates from different layers of the tissue and averaged. (E and F) Density of the inguinal SAT (E) and perigonadal VAT (F) shown in Hounsfield units from mice as in (A). (G and H) Maximum intensity projection of [18F]FDG-PET scans of one representative mouse per group (G) and active BAT volume (mm3) (H) of mice as in (A) (I–M) Coronal views and [18F]FDG-PET scans of one representative mouse per group (I) and standardized uptake values (SUVs) of radiolabeled tracer 2-deoxy-2-[18F]fluoro-D-glucose ([18F]FDG) in perigonadal VAT (J), inguinal SAT (K), gastrocnemius muscle (L), or inguinal lymph nodes (M) of mice as in (A). Multiple t test with Holm-Sidak correction (A) or Student’s t test (B–F, H, and J–M). Data are shown as mean ± SD; each round dot represents one animal (n = 6–8 mice per group). p < 0.05, ∗∗p < 0.01, ∗∗∗p < 0.001. B, bladder; H, heart. White arrows point to the inguinal lymph nodes.
Figure 6
Figure 6
Cold exposure reduces monocyte and T cell pathogenicity during EAE (A) Volcano plot identifying the up- and downregulated transcripts after RNA sequencing of monocytes that were MACS (anti-PE) and FACS (CD115-PE+) sorted from blood of mice at onset of EAE (as in Figure 4A) and exposed to cold (10°C) or room temperature for 2 weeks before and continued during EAE. (B and C) Top deregulated and enriched MetaCore Metabolic Networks (B, top), GO Cellular Components (B, middle), Reactome pathways (B, bottom), and GO processes (C). Genes were considered when p < 0.05 and for Reactome pathways when p < 0.05 and FC > 2. Data of sequencing as in (A). (D and E) Flow cytometry analysis of blood cells of mice as in (A) at EAE onset. Percentage of Ly6C high (left), intermediate (middle), and low (right) monocytes of total, single CD45+ alive cells (D). Percentage of MHCII+ cells of Ly6Chi monocytes (left), MHCII+ Ly6C+ monocytes of total MHCII+ cells (middle), and total MHCII+ cells of CD45+ cells (E). Pool of 3 experiments. (F–H) Flow cytometry analysis of CNS cells from mice as in (A) at EAE onset. Percentage of Ly6Chi monocytes/monocyte-derived cells of total, single CD45+ alive cells (F, left). Percentage of MHCII, arginase 1 (Arg1), and iNOS expression of Ly6Chi monocytes/monocyte-derived cells (F, right). Percentage of microglia of total, single CD45+ alive cells and percentage of MHCII of microglia (G). Percentage of corresponding cytokine expression as indicated in CD4+ T cells (H). (I) Flow cytometry analysis of dLN cells from mice as in (A) at EAE onset. Percentage of cytokine expression in CD4+ T cells. Observed in 2 out of 3 experiments. (J) Flow cytometry analysis of dLN cells from mice as in (A) on day 2 after EAE induction. Percentage of Ly6Chi monocytes of total, single CD45+ alive cells (upper panel). Percentage of MHCII on Ly6Chi monocytes (lower panel). (K) Flow cytometry analysis of lymph node (LN) dendritic cells (DCs) and their MFI of MHCII on different days after immunization. (D–K) Shown is mean ± SD; significance was calculated using Student’s t test, p < 0.05, ∗∗p < 0.01, ∗∗∗p < 0.001. Shown is 1 representative example of 3 (F), a pool of 2 experiments (H), or one representative experiment of two out of three that were similar (I).
Figure 7
Figure 7
Monocyte regulation of the T cell priming is critical for cold-induced EAE attenuation (A) Scheme showing experimental setup for cold exposure and adoptive transfer EAE. T cells from transgenic 2D2 mice or actively immunized WT donor mice were in vitro differentiated toward Th1 or Th17, respectively, and transferred into room-temperature or cold-exposed (2 weeks, 10°C) mice. (B–E) Flow cytometry analysis of blood cells of mice as in (A) at EAE onset. Percentage of Ly6Chi (B), intermediate (C), and low monocytes of total, single CD45+ cells (D). Percentage of MHCII+ cells of Ly6Chi monocytes (E). (F–K) EAE symptoms of mice as in (A) were scored (F). Onset day of EAE disease (G), maximum score (H), cumulative score (I), percentage of disease-free animals (J), and body weight (K). All panels are shown following adoptive transfer of Th1 (upper) and Th17 (lower) cells. (L and M) Isotype control antibody, CCR2 antibody injected, or Ccr2-knockout (KO) mice were housed at room temperature or cold (10°C) for 2 weeks before and during EAE and were s.c. immunized with MOG35-55 peptide in complete Freund’s adjuvant. Two days before disease onset, monocyte depletion efficiency was analyzed in the blood (L) and at onset T cell cytokine expression in the draining lymph nodes (M) via flow cytometry. Data represent mean ± SD; significance was calculated using multiple t test with Holm-Sidak correction, p < 0.05, ∗∗p < 0.01, ∗∗∗p < 0.001. (B–E, F–K, L, and M) Pool of 3 experiments (B–E and F–K, upper panel). Student’s t test with mean ± SD (B–E and G–I), two-way ANOVA with mean ± SEM (F and K), or Mantel-Cox (J). Multiple t tests with Holm-Sidak correction with mean ± SD, p < 0.05, ∗∗p < 0.01, ∗∗∗p < 0.001 (L and M).

References

    1. Ajami B., Bennett J.L., Krieger C., McNagny K.M., Rossi F.M. Infiltrating monocytes trigger EAE progression, but do not contribute to the resident microglia pool. Nat. Neurosci. 2011;14:1142–1149. - PubMed
    1. Allan R.S., Waithman J., Bedoui S., Jones C.M., Villadangos J.A., Zhan Y., Lew A.M., Shortman K., Heath W.R., Carbone F.R. Migratory dendritic cells transfer antigen to a lymph node-resident dendritic cell population for efficient CTL priming. Immunity. 2006;25:153–162. - PubMed
    1. Buck M.D., Sowell R.T., Kaech S.M., Pearce E.L. Metabolic instruction of immunity. Cell. 2017;169:570–586. - PMC - PubMed
    1. Cannon B., Nedergaard J. Brown adipose tissue: function and physiological significance. Physiol. Rev. 2004;84:277–359. - PubMed
    1. Chevalier C., Stojanović O., Colin D.J., Suarez-Zamorano N., Tarallo V., Veyrat-Durebex C., Rigo D., Fabbiano S., Stevanović A., Hagemann S. Gut microbiota orchestrates energy homeostasis during cold. Cell. 2015;163:1360–1374. - PubMed

Publication types