

The 2021 report of the Lancet Countdown on health and climate change: code red for a healthy future
- PMID: 34687662
- PMCID: PMC7616807
- DOI: 10.1016/S0140-6736(21)01787-6
The 2021 report of the Lancet Countdown on health and climate change: code red for a healthy future
Erratum in
-
Department of Error.Lancet. 2021 Dec 11;398(10317):2148. doi: 10.1016/S0140-6736(21)02429-6. Lancet. 2021. PMID: 34895531 No abstract available.
Abstract
The Lancet Countdown is an international collaboration that independently monitors the health consequences of a changing climate. Publishing updated, new, and improved indicators each year, the Lancet Countdown represents the consensus of leading researchers from 43 academic institutions and UN agencies. The 44 indicators of this report expose an unabated rise in the health impacts of climate change and the current health consequences of the delayed and inconsistent response of countries around the globe—providing a clear imperative for accelerated action that puts the health of people and planet above all else.
The 2021 report coincides with the UN Framework Convention on Climate Change 26th Conference of the Parties (COP26), at which countries are facing pressure to realise the ambition of the Paris Agreement to keep the global average temperature rise to 1·5°C and to mobilise the financial resources required for all countries to have an effective climate response. These negotiations unfold in the context of the COVID-19 pandemic—a global health crisis that has claimed millions of lives, affected livelihoods and communities around the globe, and exposed deep fissures and inequities in the world’s capacity to cope with, and respond to, health emergencies. Yet, in its response to both crises, the world is faced with an unprecedented opportunity to ensure a healthy future for all.
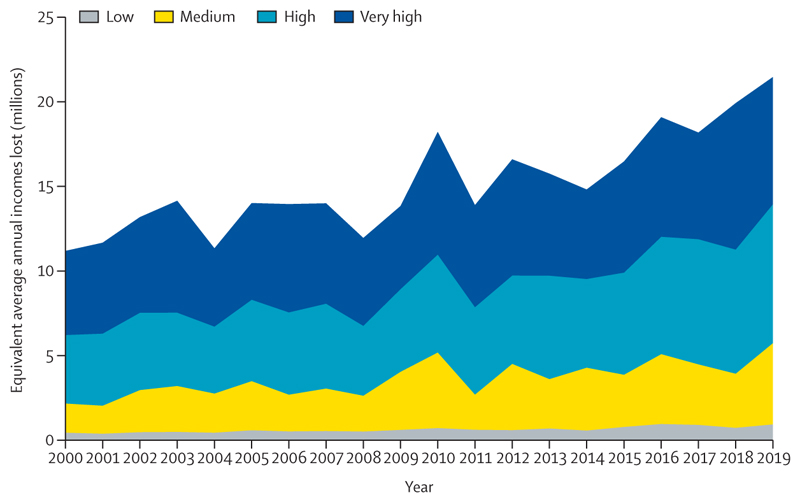
Deepening inequities in a warming world: Record temperatures in 2020 resulted in a new high of 3·1 billion more person-days of heatwave exposure among people older than 65 years and 626 million more person-days affecting children younger than 1 year, compared with the annual average for the 1986–2005 baseline (indicator 1.1.2). Looking to 2021, people older than 65 years or younger than 1 year, along with people facing social disadvantages, were the most affected by the record-breaking temperatures of over 40°C in the Pacific Northwest areas of the USA and Canada in June, 2021—an event that would have been almost impossible without human-caused climate change. Although the exact number will not be known for several months, hundreds of people have died prematurely from the heat. Furthermore, populations in countries with low and medium levels of UN-defined human development index (HDI) have had the biggest increase in heat vulnerability during the past 30 years, with risks to their health further exacerbated by the low availability of cooling mechanisms and urban green space (indicators 1.1.1, 2.3.2, and 2.3.3). Agricultural workers in countries with low and medium HDI were among the worst affected by exposure to extreme temperatures, bearing almost half of the 295 billion potential work hours lost due to heat in 2020 (indicator 1.1.4). These lost work hours could have devastating economic consequences to these already vulnerable workers—data in this year’s report shows that the average potential earnings lost in countries in the low HDI group were equivalent to 4–8% of the national gross domestic product (indicator 4.1.3).
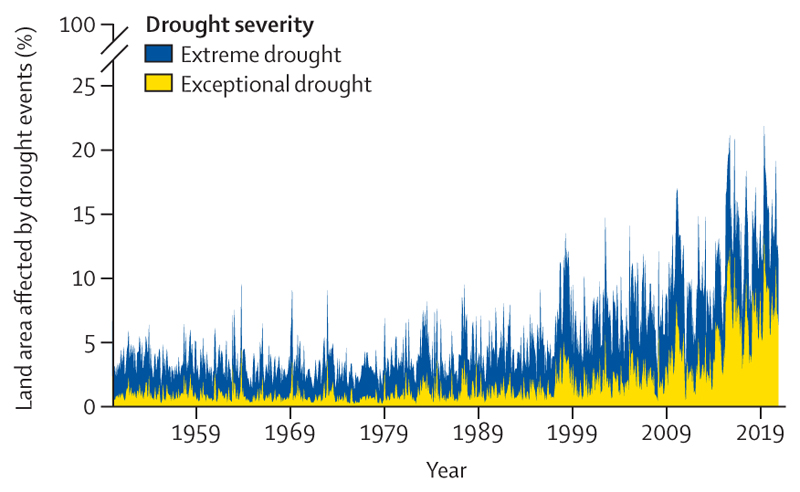
Through these effects, rising average temperatures, and altered rainfall patterns, climate change is beginning to reverse years of progress in tackling the food and water insecurity that still affects the most underserved populations around the world, denying them an essential aspect of good health. During any given month in 2020, up to 19% of the global land surface was affected by extreme drought; a value that had not exceeded 13% between 1950 and 1999 (indicator 1.2.2). In parallel with drought, warm temperatures are affecting the yield potential of the world’s major staple crops—a 6·0% reduction for maize; 3·0% for winter wheat; 5·4% for soybean; and 1·8% for rice in 2020, relative to 1981–2010 (indicator 1.4.1)—exposing the rising risk of food insecurity.
Adding to these health hazards, the changing environmental conditions are also increasing the suitability for the transmission of many water-borne, air-borne, food-borne, and vector-borne pathogens. Although socioeconomic development, public health interventions, and advances in medicine have reduced the global burden of infectious disease transmission, climate change could undermine eradication efforts.
The number of months with environmentally suitable conditions for the transmission of malaria (Plasmodium falciparum) rose by 39% from 1950–59 to 2010–19 in densely populated highland areas in the low HDI group, threatening highly disadvantaged populations who were comparatively safer from this disease than those in the lowland areas (indicator 1.3.1). The epidemic potential for dengue virus, Zika virus, and chikungunya virus, which currently primarily affect populations in central America, South America, the Caribbean, Africa, and south Asia, increased globally, with a basic reproductive rate increase of 13% for transmission by Aedes aegypti and 7% for transmission by Aedes albopictus compared with the 1950s. The biggest relative increase in basic reproductive rate of these arboviruses was seen in countries in the very high HDI group (indicator 1.3.1); however, people in the low HDI group are confronted with the highest vulnerability to these arboviruses (indicator 1.3.2).
Similar findings are observed in the environmental suitability for Vibrio cholerae, a pathogen estimated to cause almost 100 000 deaths annually, particularly among populations with poor access to safe water and sanitation. Between 2003 and 2019, the coastal areas suitable for V cholerae transmission increased substantially across all HDI country groups—although, with 98% of their coastline suitable to the transmission of V cholerae in 2020, it is people in the low HDI country group that have the highest environmental suitability for this disease (indicator 1.3.1).
The concurrent and interconnecting risks posed by extreme weather events, infectious disease transmission, and food, water, and financial insecurity are over-burdening the most vulnerable populations. Through multiple simultaneous and interacting health risks, climate change is threatening to reverse years of progress in public health and sustainable development.
Even with overwhelming evidence on the health impacts of climate change, countries are not delivering an adaptation response proportionate to the rising risks their populations face. In 2020, 104 (63%) of 166 countries did not have a high level of implementation of national health emergency frameworks, leaving them unprepared to respond to pandemics and climate-related health emergencies (indicator 2.3.1). Importantly, only 18 (55%) of 33 countries with a low HDI had reported at least a medium level of implementation of national health emergency frameworks, compared with 47 (89%) of 53 countries with a very high HDI. In addition, only 47 (52%) of 91 countries reported having a national adaptation plan for health, with insufficient human and financial resources identified as the main barrier for their implementation (indicator 2.1.1). With a world facing an unavoidable temperature rise, even with the most ambitious climate change mitigation, accelerated adaptation is essential to reduce the vulnerabilities of populations to climate change and protect the health of people around the world.
An inequitable response fails everyone: 10 months into 2021, global and equitable access to the COVID-19 vaccine had not been delivered—more than 60% of people in high-income countries have received at least one dose of a COVID-19 vaccine compared with just 3·5% of people in low-income countries. Data in this report exposes similar inequities in the global climate change mitigation response.
To meet the Paris Agreement goals and prevent catastrophic levels of global warming, global greenhouse gas emissions must reduce by half within a decade. However, at the current pace of reduction, it would take more than 150 years for the energy system to fully decarbonise (indicator 3.1), and the unequal response between countries is resulting in an uneven realisation of the health benefits of a low-carbon transition.
The use of public funds to subsidise fossil fuels is partly responsible for the slow decarbonisation rate. Of the 84 countries reviewed, 65 were still providing an overall subsidy to fossil fuels in 2018 and, in many cases, subsidies were equivalent to substantial proportions of the national health budget and could have been redirected to deliver net benefits to health and wellbeing. Furthermore, all the 19 countries whose carbon pricing policies outweighed the effect of any fossil fuels subsidies came from the very high HDI group (indicator 4.2.4).
Although countries in the very high HDI group have collectively made the most progress in the decarbonisation of the energy system, they are still the main contributors to CO2 emissions through the local production of goods and services, accounting for 45% of the global total (indicator 4.2.5). With a slower pace of decarbonisation and poorer air quality regulations than countries in the very high HDI group, the medium and high HDI country groups produce the most fine particle matter (PM2·5) emissions and have the highest rates of air pollution-related deaths, which are about 50% higher than the total deaths in the very high HDI group (indicator 3.3). The low HDI group, with comparatively lower amounts of industrial activity than in the other groups, has a local production that contributes to only 0·7% of global CO2 emissions, and has the lowest mortality rate from ambient air pollution. However, with only 12% of its inhabitants relying on clean fuels and technologies for cooking, the health of these populations is still at risk from dangerously high concentrations of household air pollution (indicator 3.2). Even in the most affluent countries, people in the most deprived areas over-whelmingly bear the burden of health effects from exposure to air pollution. These findings expose the health costs of the delayed and unequal mitigation response and underscore the millions of deaths to be prevented annually through a low-carbon transition that prioritises the health of all populations.
However, the world is not on track to realising the health gains of the transition to a low-carbon economy. Current global decarbonisation commitments are insufficient to meet Paris Agreement ambitions and would lead to a roughly 2·4°C average global temperature increase by the end of the century. The current direction of post-COVID-19 spending is threatening to make this situation worse, with just 18% of all the funds committed for economic recovery from the COVID-19 pandemic by the end of 2020 expected to lead to a reduction of greenhouse gas emissions. Indeed, the economic recovery from the pandemic is already predicted to lead to an unprecedented 5% increase in greenhouse gas emissions in 2021, which will bring global anthropogenic emissions back to their peak amounts.
In addition, the current economic recession is threatening to undermine the target of mobilising US$100 billion per year from 2020 onwards to promote low-carbon shifts and adaptation responses in the most underserved countries, even though this quantity is minute compared with the trillions allocated to COVID-19 recovery. The high amounts of borrowing that countries have had to resort to during the pandemic could erase their ability to deliver a green recovery and maximise the health gains to their population of a low-carbon transition.
An unprecedented opportunity to ensure a healthy future for all: The overshoot in emissions resulting from a carbon-intensive COVID-19 recovery would irreversibly prevent the world from meeting climate commitments and the Sustainable Development Goals and lock humanity into an increasingly extreme and unpredictable environment. Data in this report expose the health impacts and health inequities of the current world at 1·2°C of warming above pre-industrial levels and supports that, on the current trajectory, climate change will become the defining narrative of human health.
However, by directing the trillions of dollars that will be committed to COVID-19 recovery towards the WHO’s prescriptions for a healthy, green recovery, the world could meet the Paris Agreement goals, protect the natural systems that support wellbeing, and minimise inequities through reduced health effects and maximised co-benefits of a universal low-carbon transition. Promoting equitable climate change mitigation and universal access to clean energies could prevent millions of deaths annually from reduced exposure to air pollution, healthier diets, and more active lifestyles, and contribute to reducing health inequities globally. This pivotal moment of economic stimulus represents a historical opportunity to secure the health of present and future generations.
There is a glimpse of positive change through several promising trends in this year’s data: electricity generation from renewable wind and solar energy increased by an annual average of 17% between 2013 and 2018 (indicator 3.1); investment in new coal capacity decreased by 10% in 2020 (indicator 4.2.1); and the global number of electric vehicles reached 7·2 million in 2019 (indicator 3.4). Additionally, the global pandemic has driven increased engagement in health and climate change across multiple domains in society, with 91 heads of state making the connection in the 2020 UN General Debate and newly widespread engagement among countries in the very high HDI group (indicator 5.4). Whether COVID-19 recovery supports, or reverses these trends, is yet to be seen.
Neither COVID-19 nor climate change respect national borders. Without widespread, accessible vaccination across all countries and societies, SARS-CoV-2 and its new variants will continue to put the health of everybody at risk. Likewise, tackling climate change requires all countries to deliver an urgent and coordinated response, with COVID-19 recovery funds allocated to support and ensure a just transition to a low-carbon future and climate change adaptation across the globe. Leaders of the world have an unprecedented opportunity to deliver a future of improved health, reduced inequity, and economic and environmental sustainability. However, this will only be possible if the world acts together to ensure that no person is left behind.
Conflict of interest statement
Declaration of interests We declare no competing interests.
Figures


Comment in
-
The climate emergency: a last chance to act?Lancet. 2021 Oct 30;398(10311):1541. doi: 10.1016/S0140-6736(21)02281-9. Epub 2021 Oct 20. Lancet. 2021. PMID: 34687661 No abstract available.
Dataset use reported in
-
Save our only planet.Lancet Infect Dis. 2021 Dec;21(12):1613. doi: 10.1016/S1473-3099(21)00720-9. Epub 2021 Nov 11. Lancet Infect Dis. 2021. PMID: 34774147 Free PMC article. No abstract available.
References
-
- Johns Hopkins Center for Systems Science and Engineering. COVID-19 dashboard. 2021. [accessed April 7, 2021]. https://www.arcgis.com/apps/opsdashboard/index.html#/bda7594740fd4029942... .
-
- UK Office for National Statistics. Comparisons of all-cause mortality between European countries and regions: 2020. 2021. Mar 19, [accessed April 9, 2021]. https://www.ons.gov.uk/peoplepopulationandcommunity/birthsdeathsandmarri... .
-
- WHO. Pulse survey on continuity of essential health services during the COVID-19 pandemic: interim report. World Health Organization: Geneva; 2020.
-
- International Monetary Fund. World economic outlook update. Washington, DC: International Monetary Fund; 2021. Jan,
-
- World Bank. Poverty and shared prosperity 2020: reversals of fortune. Washington, DC: World Bank; 2020.
Publication types
MeSH terms
Grants and funding
LinkOut - more resources
Full Text Sources
Medical
Miscellaneous
