. 2022 Feb;162(2):548-561.e4.
doi: 10.1053/j.gastro.2021.10.013. Epub 2021 Oct 21.

Prolonged Impairment of Short-Chain Fatty Acid and L-Isoleucine Biosynthesis in Gut Microbiome in Patients With COVID-19

Affiliations

Prolonged Impairment of Short-Chain Fatty Acid and L-Isoleucine Biosynthesis in Gut Microbiome in Patients With COVID-19

Fen Zhang et al. Gastroenterology. 2022 Feb.

Abstract

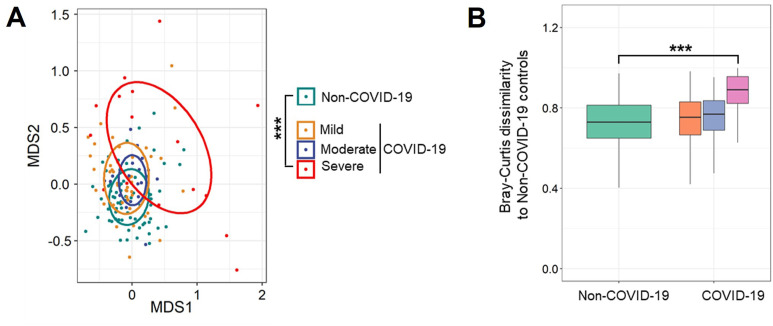
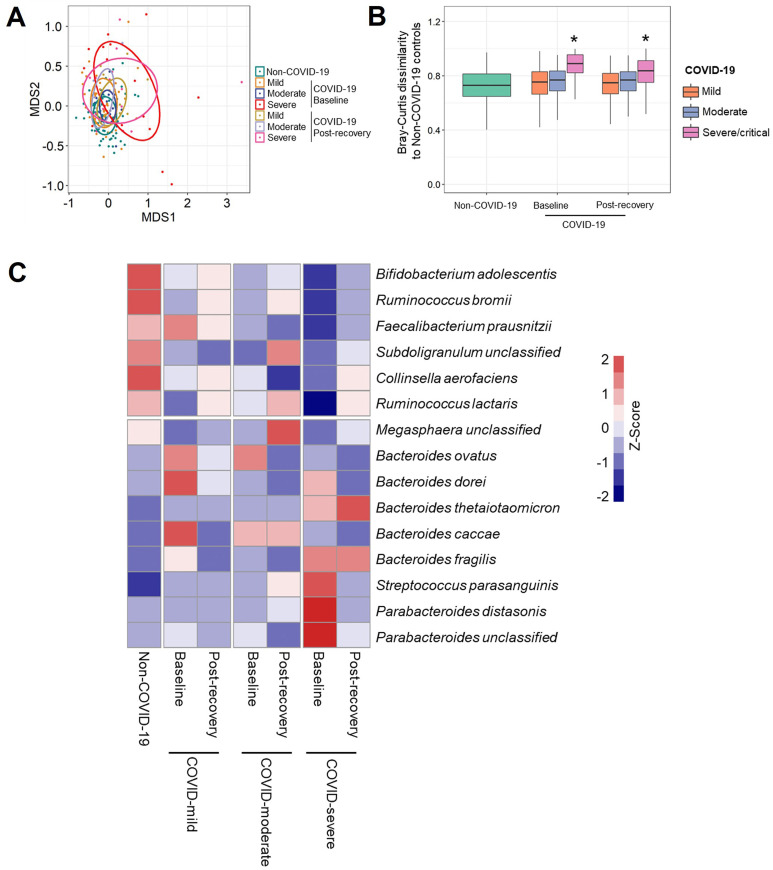
Background and aims: Coronavirus disease 2019 (COVID-19) caused by severe acute respiratory syndrome coronavirus 2 (SARS-CoV-2) infection is associated with altered gut microbiota composition. Phylogenetic groups of gut bacteria involved in the metabolism of short chain fatty acids (SCFAs) were depleted in SARS-CoV-2-infected patients. We aimed to characterize a functional profile of the gut microbiome in patients with COVID-19 before and after disease resolution.

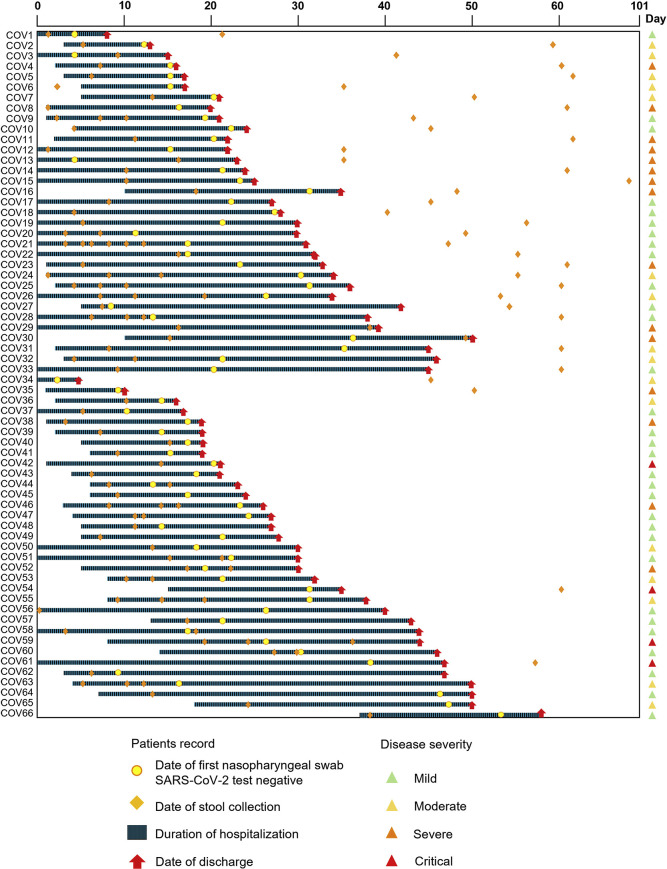
Methods: We performed shotgun metagenomic sequencing on fecal samples from 66 antibiotics-naïve patients with COVID-19 and 70 non-COVID-19 controls. Serial fecal samples were collected (at up to 6 times points) during hospitalization and beyond 1 month after discharge. We assessed gut microbial pathways in association with disease severity and blood inflammatory markers. We also determined changes of microbial functions in fecal samples before and after disease resolution and validated these functions using targeted analysis of fecal metabolites.

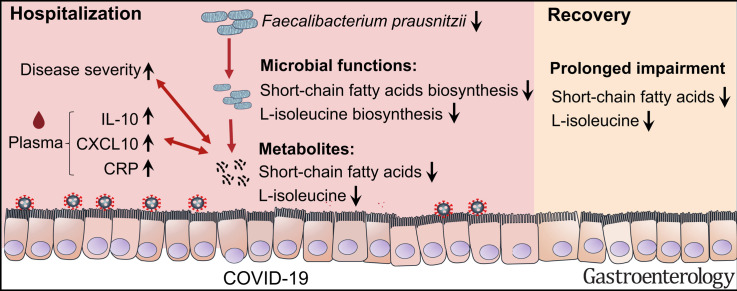
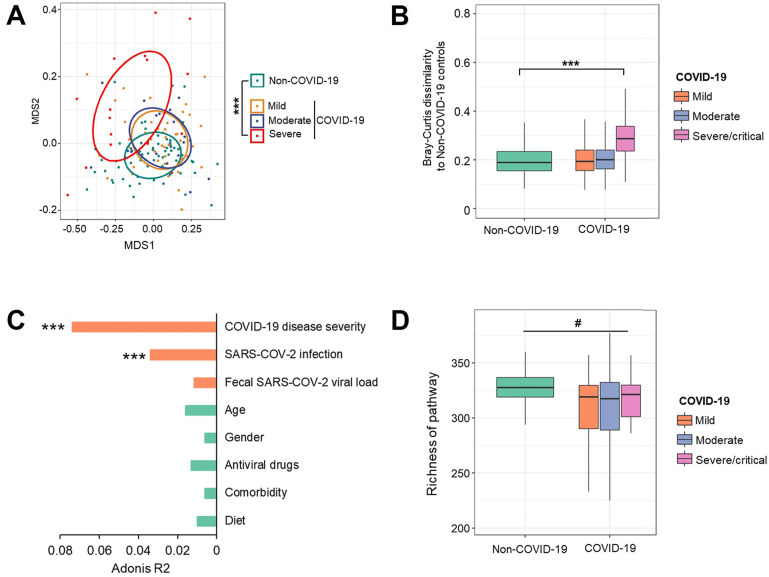
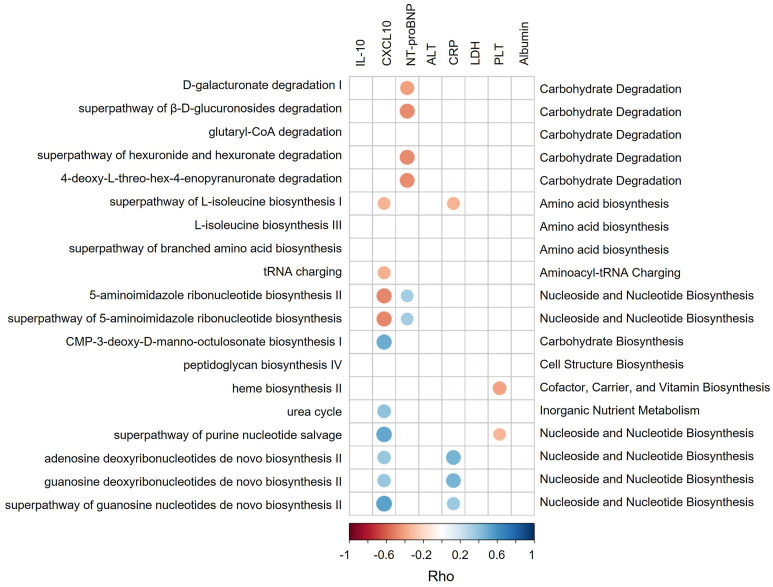
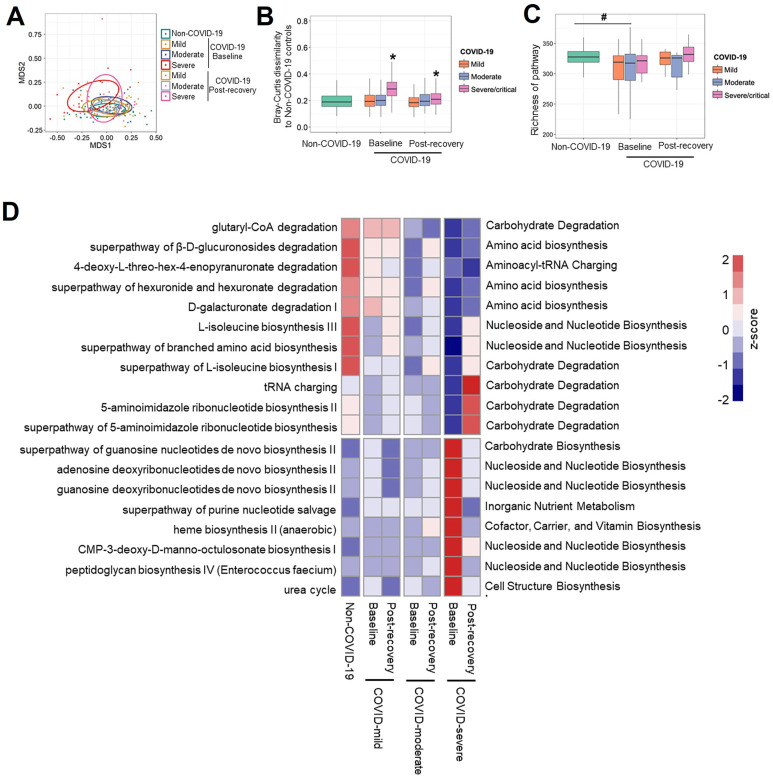
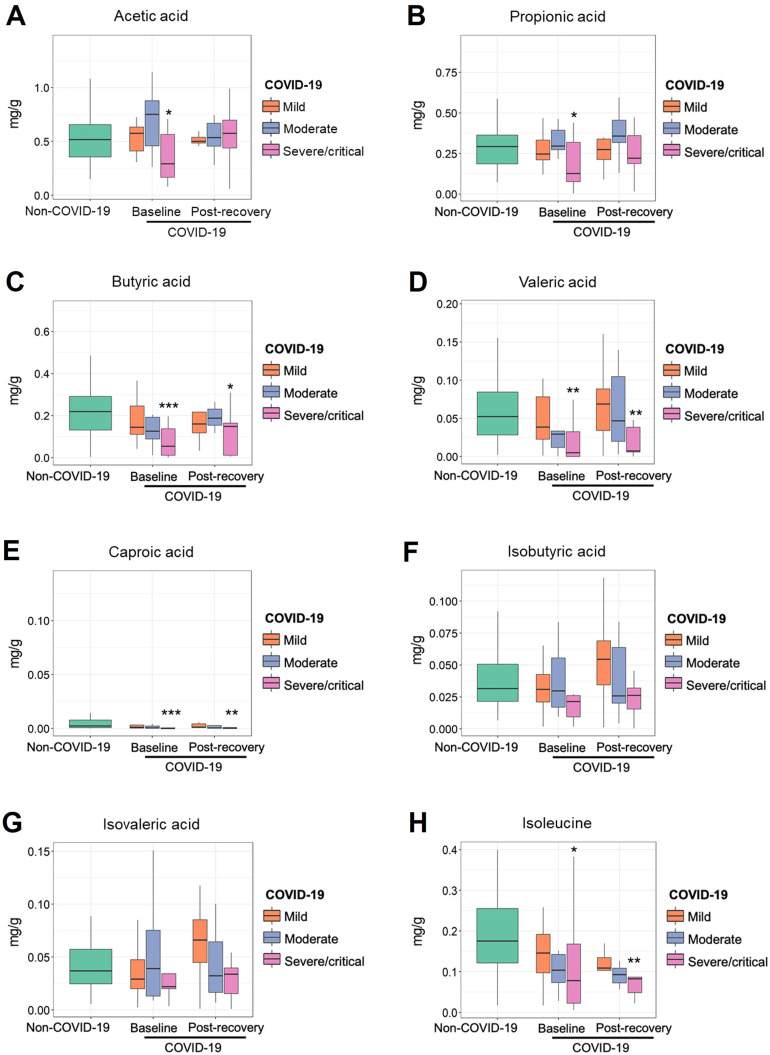
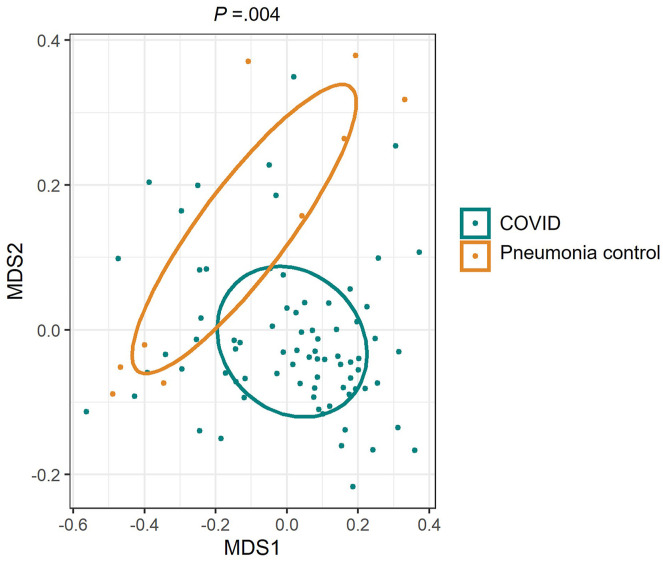
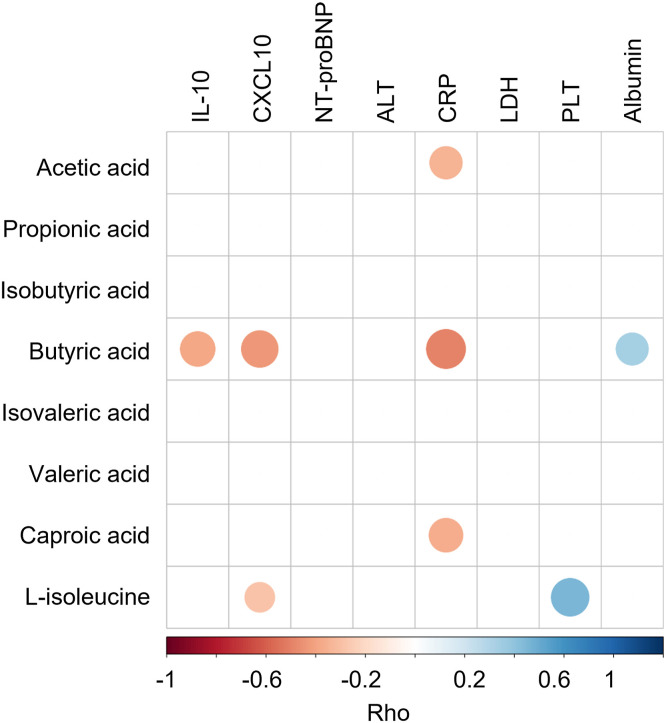
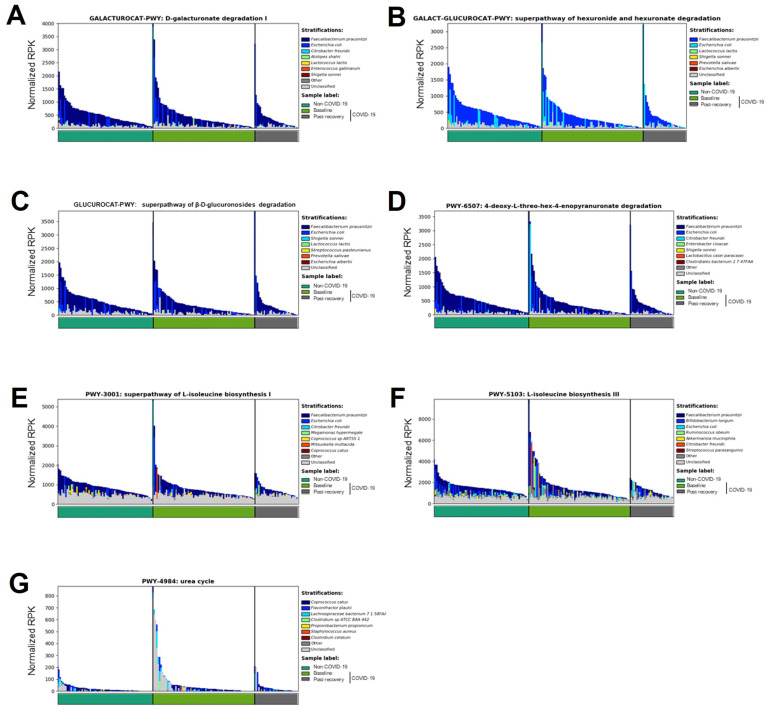
Results: Compared with non-COVID-19 controls, patients with COVID-19 with severe/critical illness showed significant alterations in gut microbiome functionality (P < .001), characterized by impaired capacity of gut microbiome for SCFA and L-isoleucine biosynthesis and enhanced capacity for urea production. Impaired SCFA and L-isoleucine biosynthesis in gut microbiome persisted beyond 30 days after recovery in patients with COVID-19. Targeted analysis of fecal metabolites showed significantly lower fecal concentrations of SCFAs and L-isoleucine in patients with COVID-19 before and after disease resolution. Lack of SCFA and L-isoleucine biosynthesis significantly correlated with disease severity and increased plasma concentrations of CXCL-10, NT- proB-type natriuretic peptide, and C-reactive protein (all P < .05).

Conclusions: Gut microbiome of patients with COVID-19 displayed impaired capacity for SCFA and L-isoleucine biosynthesis that persisted even after disease resolution. These 2 microbial functions correlated with host immune response underscoring the importance of gut microbial functions in SARS-CoV-2 infection pathogenesis and outcome.

Keywords: Coronavirus; Gut Microbiome; Microbial Functions; SCFAs.


Figures

None
Graphical abstract
Figure 1
Figure 1
Schematic diagram of stool sample collection and hospitalization duration in patients with COVID-19 (n = 66). “CoV” denotes patient with COVID-19. “D0” denotes when the patients reported illness onset.
Figure 2
Figure 2
Altered gut microbiome functional profile in patients with COVID-19 at baseline. (A) The composition of microbial functional pathways in patients with COVID-19 with mild, moderate, and severe/critical illness and non–COVID-19 individuals, viewed using nonmetric multidimensional scaling (NMDS) plot based on Bray-Curtis dissimilarities. The P value of the significance was determined using PERMANOVA analysis and was indicated as ∗∗∗P < .001. (B) The Bray-Curtis dissimilarity of patients with COVID-19 with mild, moderate, and severe/critical illness to non–COVID-19 controls based on abundance of pathways. The P value of the significance was determined using Mann-Whitney U test, and was indicated as ∗∗∗P < .001. (C) The effect size of host factors on the composition of microbial pathways. The effect size and statistical significance was determined via PERMANOVA analysis. ∗, ∗∗, ∗∗∗ indicate P < .05, P < .01, and P < .001, respectively. (D) Richness of microbial pathways in patients with COVID-19 with mild, moderate, and severe/critical illness and non–COVID-19 individuals, evaluated based on Chao1 index. The statistical significance between patients with COVID-19 with non–COVID-19 controls was determined using Mann-Whitney U test, and was indicated as #P < .05.
Figure 3
Figure 3
Spearman correlations between microbial pathways and plasma measurements. Those pathways or plasma measurements that were significantly correlated with disease severity were plotted. Blue circles and positive values indicate positive correlations, and red circles and negative values indicate inverse correlations. The size and shading indicate the magnitude of the correlation, where darker shades showed higher correlations than lighter ones.
Figure 4
Figure 4
Prolonged impairment of microbial functions of SCFAs and L-isoleucine biosynthesis after recovery of COVID-19. (A) The composition of microbial pathways in non–COVID-19 controls as well as patients with COVID-19 at baseline and after discharge, viewed using NMDS plot based on Bray-Curtis dissimilarities. (B) The Bray-Curtis dissimilarity of patients with COVID-19 at baseline and after discharge to non–COVID-19 controls. The P value of the significance was determined using Mann-Whitney U test and was indicated as ∗P < .05. (C) Richness of microbial pathways in non–COVID-19 controls as well as patients with COVID-19 at baseline and after discharge, evaluated based on Chao1 index. #P < .05 indicates statistical significance for patients with COVID-19 versus non–COVID-19 controls, determined using Mann-Whitney U test. (D) Heat map summarizing changes in gut microbiome functionality in patients with COVID-19 after discharge. The labels on the right side indicate microbial pathways. Pathways with higher abundances are red, whereas those with low relative abundances are blue.
Figure 5
Figure 5
The fecal concentration of acetic acid (A), propionic acid (B), butyric acid (C), valeric acid (D), hexanoic acid (E), isobutyric acid (F), isovaleric acid (G), and. L-isoleucine (H) in patients with COVID-19 and non–COVID-19 controls. The first stool sample collected after admission (baseline group) and the stool collected after discharge (postrecovery group) were used for the targeted metabolome analysis. ∗P <.05, ∗∗P < .01, and ∗∗P<.001 indicate statistical significance for mild, moderate, and severe/critical patients vs non–COVID-19 controls, determined using Mann-Whitney U test.
Supplementary Figure 1
Altered taxonomic composition of gut microbiome in patients with COVID-19 during hospitalization. (A) The taxonomic composition of gut microbiome in patients with COVID-19 with mild, moderate, and severe/critical illness and non–COVID-19 individuals, viewed using NMDS plot based on Bray-Curtis dissimilarities. The P value of the significance was determined using PERMANOVA analysis and was indicated as ∗∗∗P <.001. (B) The Bray-Curtis dissimilarity of patients with COVID-19 with mild, moderate, and severe/critical illness to non–COVID-19 controls based on relative abundance of species. The P value of the significance was determined using Mann-Whitney U test, and was indicated as ∗P < .05. The first stool sample collected after admission from COVID-19 was used for the analyses.
Supplementary Figure 2
Altered taxonomic composition of gut microbiome in patients with COVID-19 after recovery. (A) The taxonomic composition of gut microbiome in non–COVID-19 controls as well as patients with COVID-19 at baseline and after discharge, viewed using NMDS plot based on Bray-Curtis dissimilarities. (B) The Bray-Curtis dissimilarity of patients with COVID-19 at baseline and after discharge to non–COVID-19 controls based on relative abundance of species. The P value of the significance was determined using Mann-Whitney U test, and was indicated as ∗P < .05. (C) Heat map summarizing changes in gut microbiome at species level in patients with COVID-19 after discharge. Species with higher relative abundances are red, whereas those with lower relative abundances are blue.
Supplementary Figure 3
The composition of microbial functional pathways in patients with COVID-19 and hospitalized pneumonia controls. NMDS plot was based on Bray-Curtis dissimilarities. The P value of the significance was determined using PERMANOVA analysis.
Supplementary Figure 4
Spearman correlations between fecal metabolites and plasma measurements. Those plasma measurements significantly correlated with disease severity were plotted. Blue circles and positive values indicate positive correlations, and red circles and negative values indicate inverse correlations. The size and shading indicate the magnitude of the correlation, where darker shades showed higher correlations than lighter ones.
Supplementary Figure 5
Contribution of organisms to microbial pathways in COVID-19 baseline and non–COVID-19 fecal samples. The abundance of microbial pathway was normalized based on relative log expression by Deseq2.

Comment in

References

    1. Wang D., Hu B., Hu C., et al. Clinical characteristics of 138 hospitalized patients with 2019 novel coronavirus–infected pneumonia in Wuhan, China. JAMA. 2020;323:1061–1069. - PMC - PubMed
    1. Zuo T., Liu Q., Zhang F., et al. Depicting SARS-CoV-2 faecal viral activity in association with gut microbiota composition in patients with COVID-19. Gut. 2021;70:276–284. - PMC - PubMed
    1. Zhao Y., Zhao Z., Wang Y., et al. Single-cell RNA expression profiling of ACE2, the receptor of SARS-CoV-2. Am J Respir Crit Care Med. 2020;202:756–759. - PMC - PubMed
    1. Xiao F., Sun J., Xu Y., et al. Infectious SARS-CoV-2 in feces of patient with severe COVID-19. Emerg Infect Dis. 2020;26:1920–1922. - PMC - PubMed
    1. Yu L., Tong Y., Shen G., et al. Immunodepletion with hypoxemia: a potential high risk subtype of coronavirus disease 2019. MedRxiv. 2020 03.03.20030650.

Publication types