

Comparing COVID-19 physical distancing policies: results from a physical distancing intensity coding framework for Botswana, India, Jamaica, Mozambique, Namibia, Ukraine, and the United States
- PMID: 34688295
- PMCID: PMC8541811
- DOI: 10.1186/s12992-021-00770-9
Comparing COVID-19 physical distancing policies: results from a physical distancing intensity coding framework for Botswana, India, Jamaica, Mozambique, Namibia, Ukraine, and the United States
Abstract
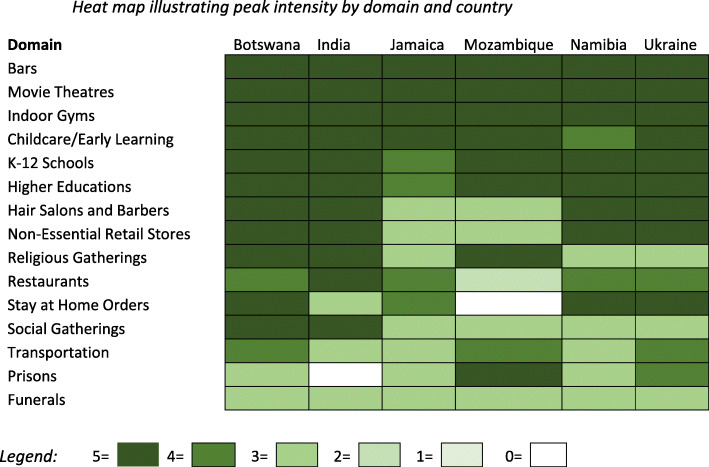
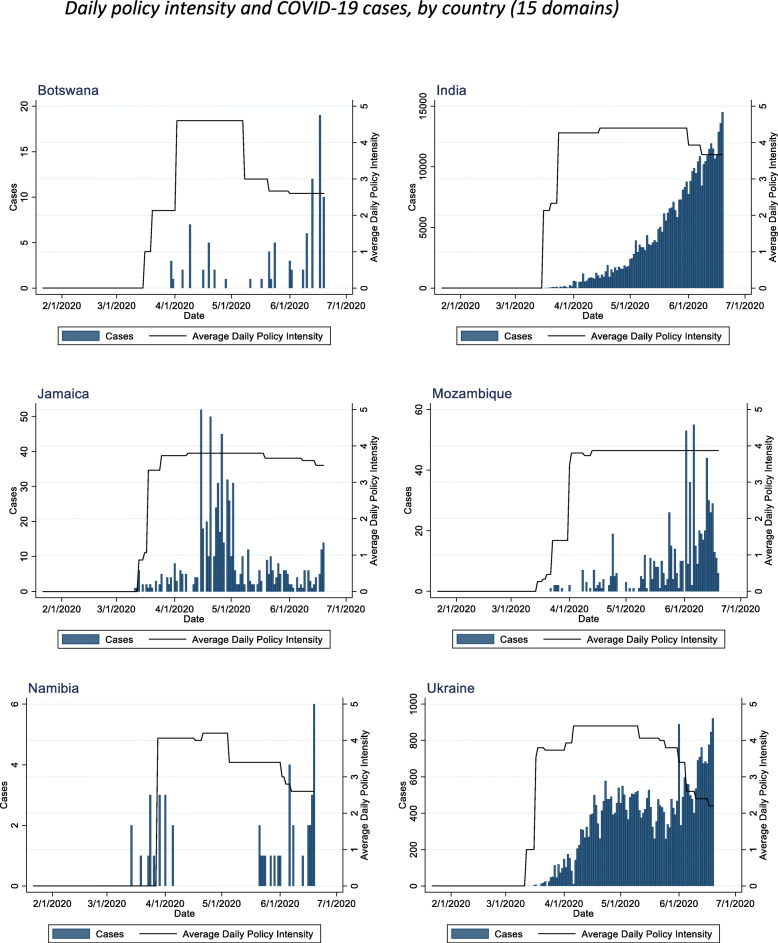
Background: Understanding the differences in timing and composition of physical distancing policies is important to evaluate the early global response to COVID-19. A physical distancing intensity monitoring framework comprising 16 domains was recently published to compare physical distancing approaches across 12 U.S. States. We applied this framework to a diverse set of low and middle-income countries (LMICs) (Botswana, India, Jamaica, Mozambique, Namibia, and Ukraine) to test the appropriateness of this framework in the global context and to compare the policy responses in these LMICs with a sample of U.S. States during the first 100-days of the pandemic.
Results: The LMICs in our sample adopted wide ranging physical distancing policies. The highest peak daily physical distancing intensity during this period was: Botswana (4.60); India (4.40); Ukraine (4.40); Namibia (4.20); Mozambique (3.87), and Jamaica (3.80). The number of days each country stayed at peak policy intensity ranged from 12-days (Jamaica) to more than 67-days (Mozambique). We found some key similarities and differences, including substantial differences in whether and how countries expressly required certain groups to stay at home. Despite the much higher number of cases in the US, the physical distancing responses in our LMIC sample were generally more intense than in the U.S. States, but results vary depending on the U.S. State. The peak policy intensity for the U.S. 12-state average was 3.84, which would place it lower than every LMIC in this sample except Jamaica. The LMIC sample countries also reached peak physical distancing intensity earlier in outbreak progression compared to the U.S. states sample. The easing of physical distancing policies in the LMIC sample did not discernably correlate with change in COVID-19 incidence.
Conclusions: This physical distancing intensity framework was appropriate for the LMIC context with only minor adaptations. This framework may be useful for ongoing monitoring of physical distancing policy approaches and for use in effectiveness analyses. This analysis helps to highlight the differing paths taken by the countries in this sample and may provide lessons to other countries regarding options for structuring physical distancing policies in response to COVID-19 and future outbreaks.
Keywords: COVID-19; comparative analysis; health systems; physical distancing; policy; policy coding.
© 2021. The Author(s).
Conflict of interest statement
None.
Figures


References
-
- World Health Organization. Timeline - COVID-19 [Internet]. 2020 Apr 27 [Available from: https://www.who.int/news-room/detail/27-04-2020-who-timeline---covid-19.
-
- World Health Organization. WHO Director-General’s opening remarks at the media briefing on COVID-19–13 March 2020 [Internet]. 2020 Mar 13 [Available from: https://www.who.int/dg/speeches/detail/who-director-general-s-opening-re....
MeSH terms
LinkOut - more resources
Full Text Sources
Medical
