. 2021 Nov;297(5):101326.
doi: 10.1016/j.jbc.2021.101326. Epub 2021 Oct 22.

The intrinsic kinase activity of BRD4 spans its BD2-B-BID domains

Affiliations

The intrinsic kinase activity of BRD4 spans its BD2-B-BID domains

Jocelyn D Weissman et al. J Biol Chem. 2021 Nov.

Abstract

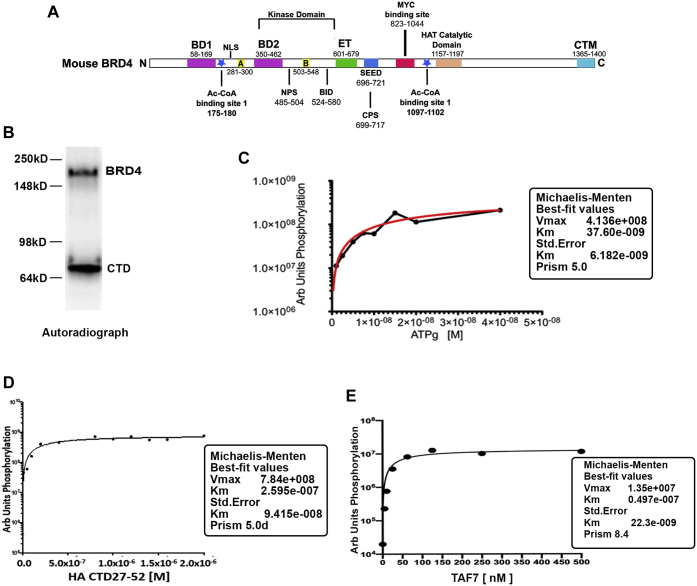
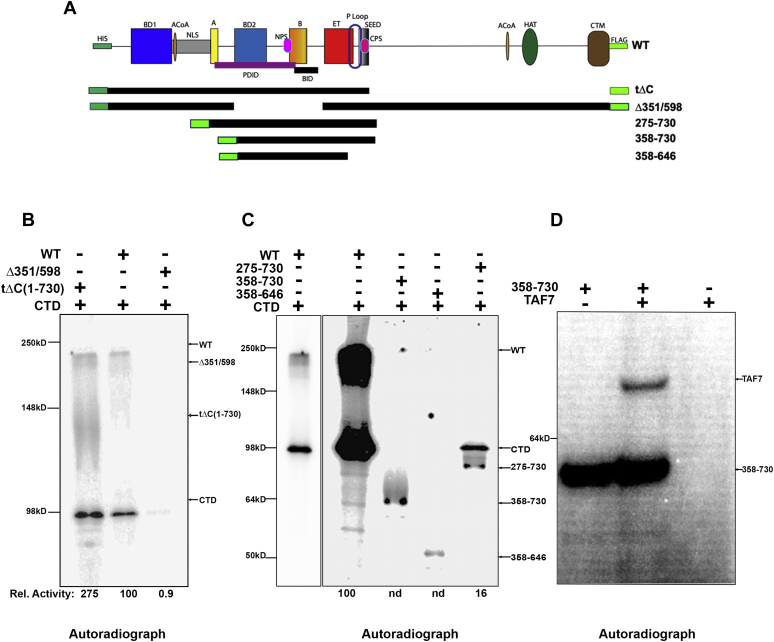
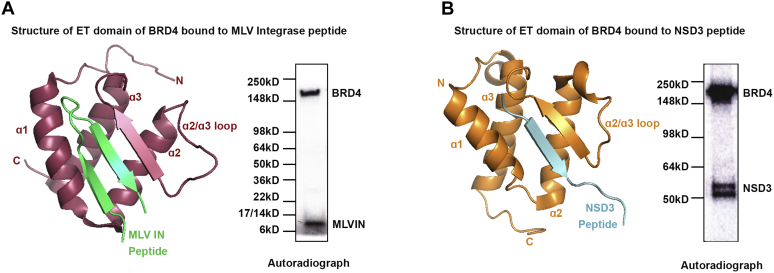
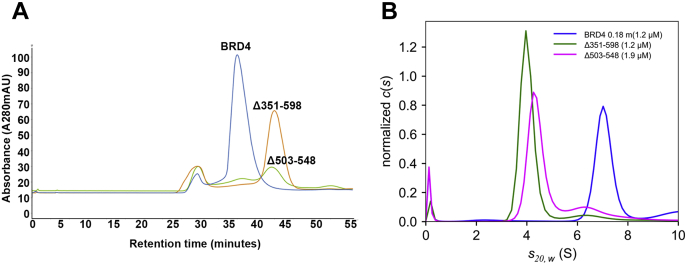
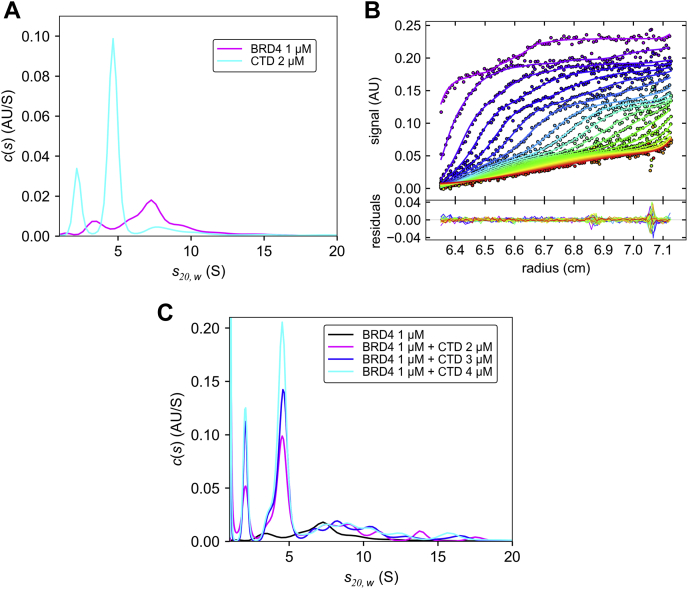
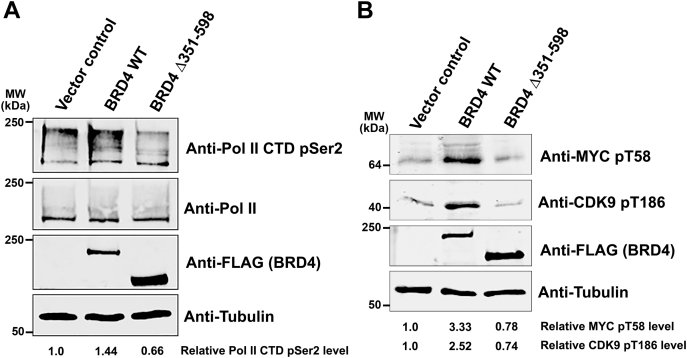
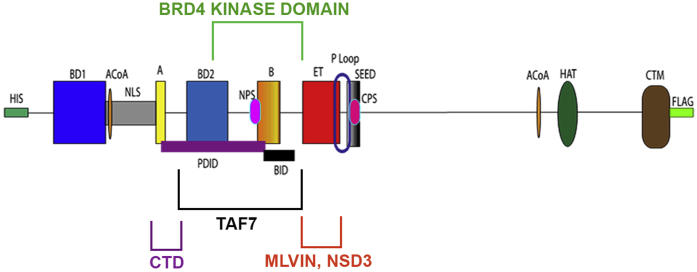
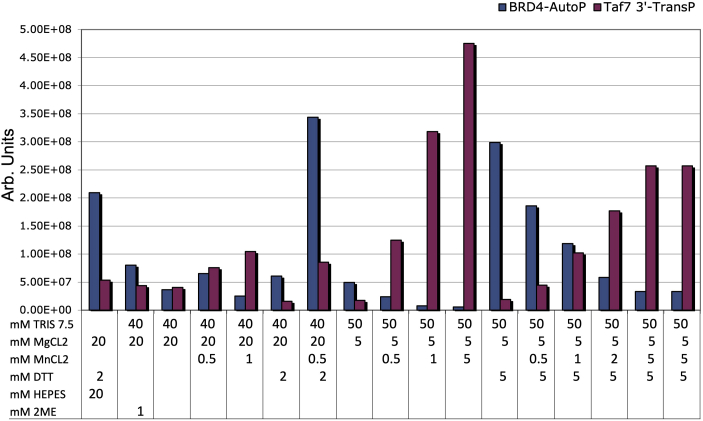
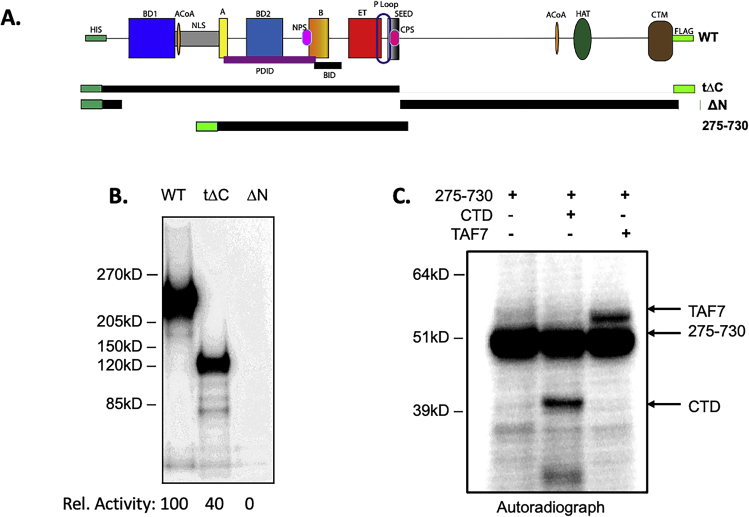
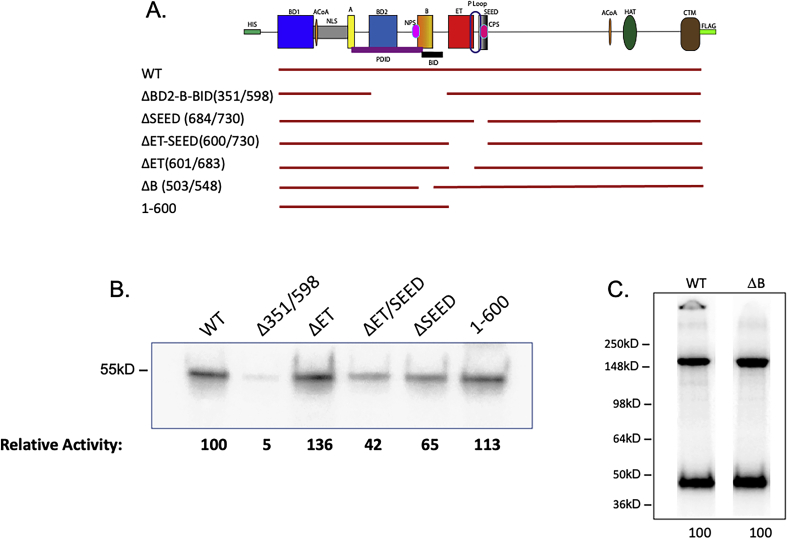
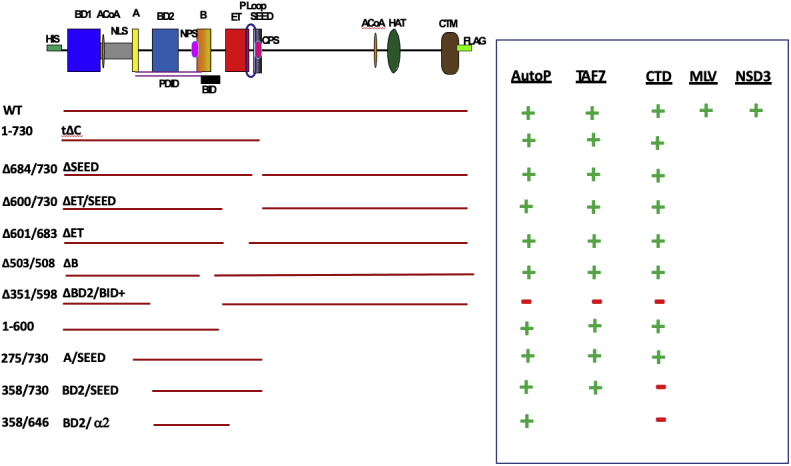
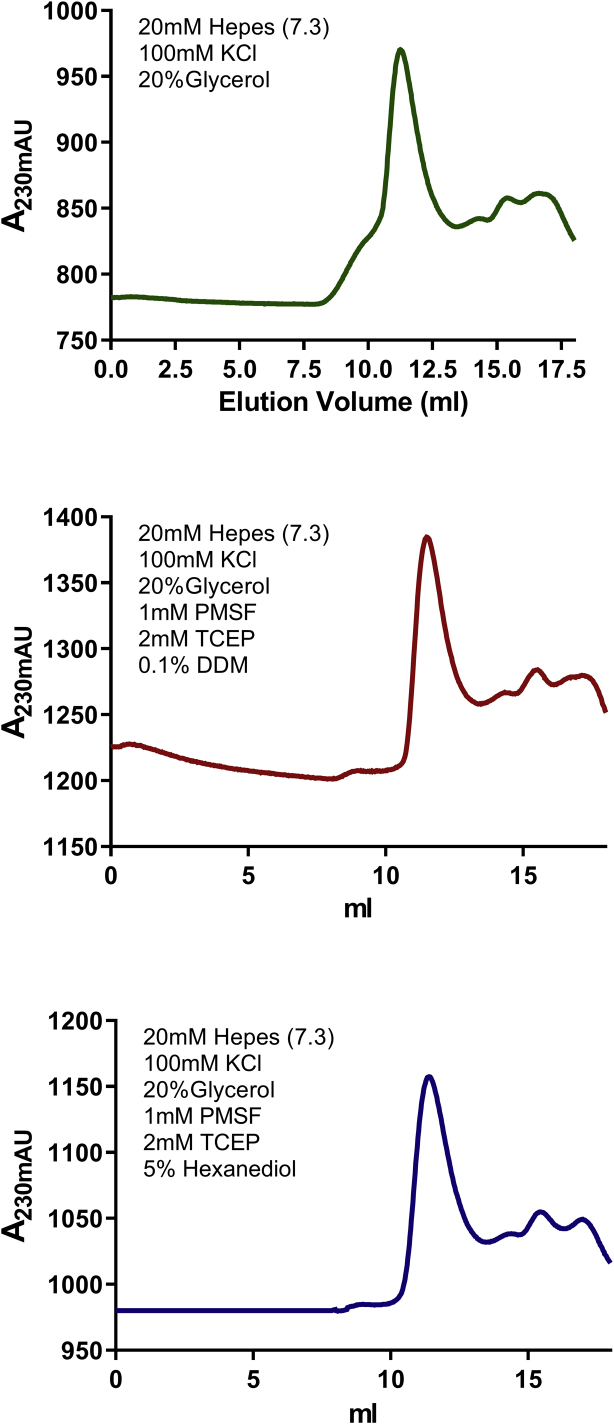
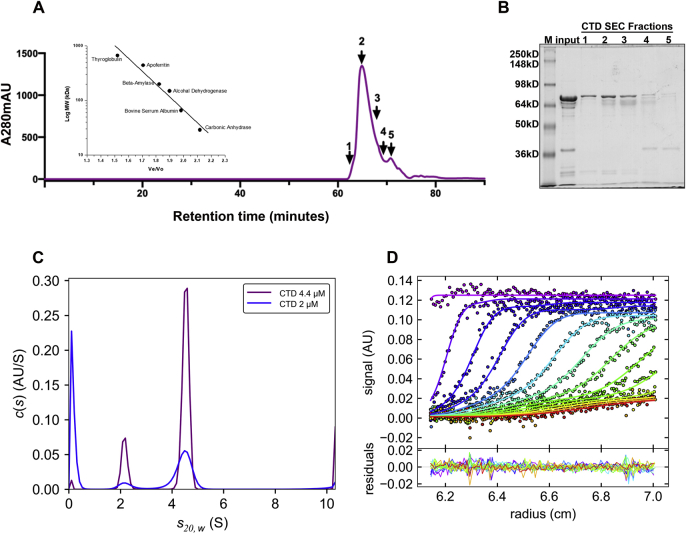
Bromodomain protein 4 (BRD4) is a transcriptional and epigenetic regulator that is a therapeutic target in many cancers and inflammatory diseases. BRD4 plays important roles in transcription as an active kinase, which phosphorylates the carboxy-terminal domain (CTD) of RNA polymerase II (Pol II), the proto-oncogene c-MYC, and transcription factors TAF7 and CDK9. BRD4 is also a passive scaffold that recruits transcription factors. Despite these well-established functions, there has been little characterization of BRD4's biophysical properties or its kinase activity. We report here that the 156 kD mouse BRD4 exists in an extended dimeric conformation with a sedimentation coefficient of ∼6.7 S and a high frictional ratio. Deletion of the conserved B motif (aa 503-548) disrupts BRD4's dimerization. BRD4 kinase activity maps to amino acids 351 to 598, which span bromodomain-2, the B motif, and the BID domain (BD2-B-BID) and contributes to the in vivo phosphorylation of its substrates. As further assessed by analytical ultracentrifugation, BRD4 directly binds purified Pol II CTD. Importantly, the conserved A motif of BRD4 is essential for phosphorylation of Pol II CTD, but not for phosphorylation of TAF7, mapping its binding site to the A motif. Peptides of the viral MLV integrase (MLVIN) protein and cellular histone lysine methyltransferase, NSD3, which have been shown by NMR to bind to the extra-terminal (ET) domain, also are phosphorylated by BRD4. Thus, BRD4 has multiple distinct substrate-binding sites and a common kinase domain. These results provide new insights into the structure and kinase function of BRD4.

Keywords: BRD4; CTD; extended dimer; kinase.


Conflict of interest statement

Conflict of interest The authors declare that they have no conflicts of interest with the contents of this article.

Figures

Figure 1
Figure 1
BRD4 kinase follows classical enzyme kinetics.A, map of mouse BRD4 showing the locations of various domains, the numbers indicate the amino acid residues encompassing the domain. B, in vitro kinase assay using 10uCi radiolabeled ATP showing the auto and trans kinase activities of 10 nM BRD4; 25 nM Pol II CTD27–52 was used as a substrate. Orange line represents the standard error of the best-fit parameters, as determined by Prism. C, Michaelis–Menten plot representing the kinetics of BRD4 autophosphorylation in the presence of increasing concentrations of radiolabeled ATP. D, Michaelis–Menten plot representing the kinetics of 10 nM BRD4 phosphorylation of increasing concentrations of substrate HA-CTD27–52. E, Michaelis–Menten plot representing the kinetics of 10 nM BRD4 phosphorylation of increasing concentration of TAF7 C-terminal fragment. Arbitrary quantification units on Y-axis were plotted against increasing concentrations of TAF7 on X-axis. All Km and Vmax values were calculated as described in Experimental procedures. A and B, conserved motifs; BD1 and BD2, bromodomains 1 and 2; BID, basic residue-rich interaction domain; CTM, C-terminal motif; ET, extra terminal domain; Km, Michaelis–Menten constant; NPS and CPS, N and C-terminal phosphorylation sites respectively; SEED, Ser/Glu/Asp-rich region; Vmax, maximal rate.
Figure 4
Figure 4
BRD4 is an extended dimer in solution.A, plot showing intrinsically disordered regions in BRD4 as predicted by PONDR (Predictor of Natural Disordered Regions); VL-XT scores are plotted on the Y axis, and amino acid residue numbers are plotted on the X axis. The arrowheads indicate the locations of functional domains of BRD4. B, size exclusion profile of mouse BRD4 on Superose 6 increase column at 4  °C. Inset shows the standard calibration curve run on same condition. Arrowhead indicates the approximate predicted elution volume of monomeric BRD4. C, 3 to 12% gradient blue native page showing the migration of mouse BRD4. Arrowhead indicates the expected monomeric BRD4 migration. D, 8% SDS-PAGE showing the migration of mouse BRD4. E, sedimentation boundaries of 3 μM mouse BRD4 sedimenting at 50,000 rpm, as observed by absorbance at 280 nm (for clarity symbols show only every third data point of every second scan) and c(s) sedimentation coefficient distribution model (lines). The color temperature from purple to red indicates temporal evolution. F, normalized sedimentation coefficient distributions c(s) distribution plots of mouse BRD4 at different concentrations, 3 μM (purple), 1 μM (blue), and 0.3 μM (cyan) calculated on the basis of absorbance scans at 280 nm as shown in (F).
Figure 2
Figure 2
BRD4 kinase domain is contained within the BD2-B-BID regions.A, schematic map of WT, deletion mutants, and fragments of BRD4 (see Fig. 1 for definitions of BRD4 domains). B, in vitro kinase assay using radiolabeled ATP showing both auto and trans kinase activities of WT, tΔC, and a Δ351 to 598 recombinant BRD4 proteins, all at 50 nM, using 100 nM GST-CTD1–52 as substrate. Kinase activity of deletion mutant proteins on CTD is shown relative to WT BRD4. C, in vitro kinase assay using radiolabeled ATP showing both the auto and trans kinase activities of WT, A-to-SEED fragment of BRD4 (275–730), BD2-to-SEED (358–730), BD2-to-part of ET (358–646), all at 50 nM, using 100 nM GST-CTD1–52 as substrate. Kinase activity of deletion mutant proteins on CTD is shown relative to full-length WT BRD4. N.d., none detected. D, in vitro kinase assay using radiolabeled ATP showing both the auto and trans kinase activities of 200 nM BD2-SEED (358–730), using 100 nM GST-TAF7 as substrate.
Figure 3
Figure 3
BRD4 phosphorylates substrates that bind to its ET domain.A, left: ribbon diagram of ET domain of BRD4 (pink) bound to MLV integrase peptide (residues 389–405), (green) modified from PDB:2N3K. Right: in vitro kinase assay showing 400 nM MLV IN peptide phosphorylation by 70 nM full-length BRD4. B, left: ribbon diagram of ET domain of BRD4 (orange) bound to NSD3 peptide (residues 152–163) modified from PDB:2NCZ (cyan). Right: in vitro kinase assay showing 750 nM NSD3 peptide phosphorylation by 70 nM full-length BRD4.
Figure 5
Figure 5
Deletion of the BRD4 B motif disrupts dimerization.A, size exclusion profile on Superose 6 increase column at 4 °C of full-length mouse BRD4 and BRD4 deletion mutants spanning the B motif alone (Δ503–548) or the BD2-BID-B domain (Δ351–598). B, normalized sedimentation coefficient c(s) distribution plots of full-length mouse BRD4 and BRD4 deletion mutants spanning the B motif alone (Δ503–548) or the BD2-BID-B domain (Δ351–598), at the indicated concentrations.
Figure 6
Figure 6
BRD4 forms a complex with CTD in a concentration-dependent manner.A, the normalized c(s) distribution plots of BRD4 alone (magenta) and CTD alone (cyan). The slower sedimenting peak of CTD represents a minor degradation component. B, absorbance scans at 280 nm of a mixture of 1 μM BRD4 and 2 μM CTD sedimenting at 50,000 rpm. Every third data point is shown, with solid lines representing the c(s) model with the associated sedimentation coefficient distribution in panel C. C, comparison of normalized c(s) distribution plots of BRD4 alone (black), BRD4 with CTD in 1:2 M ratio (magenta), 1:3 M ratio (blue), and 1:4 M ratio (cyan).
Figure 7
Figure 7
Deletion of BRD4 kinase domain (351–598) leads to a loss of Pol II CTD phosphorylation in vivo. HCT116 cells were transfected with 3 μg of BRD4 WT, Δ351 to 598, or vector plasmids. Cells were harvested after 48 h, and level of phosphorylation measured by immunoblotting. A, immunoblot with antibodies for specific for P-Ser2-CTD, Pol II, FLAG and tubulin. The level of Ser2-CTD phosphorylation was calculated relative to control after normalizing for tubulin. The experiment shown is representative of two independent experiments. B, immunoblot with antibodies specific for pT58 MYC and pT186 CDK9, FLAG, and tubulin. The level of phosphorylation was calculated relative to control after normalizing for tubulin. The experiment shown is representative of two independent experiments.
Figure 8
Figure 8
BRD4 kinase domain and its flanking regions are required for the phosphorylation of its substrates. Schematic summarizing the locations of the BRD4 kinase domain and substrate-binding sites. The BRD4 kinase domain location (BD2-B-BID) is indicated by the green bracket. The predicted CTD-binding location (Motif A- 5′ PDID) is indicated by the purple bracket. The TAF7-binding region (5′PDID-BID) is indicated by the gray bracket, and the MLV IN, NSD3-binding domain (ET) is indicated by orange bracket.
Figure S1
Figure S1
BRD4 kinase activity is affected by buffer conditions. In vitro kinase assays of 10 nM BRD4 under different buffer conditions show differential optima for auto and trans kinase activities using 75 nM TAF7 3′ fragment as a substrate.
Figure S2
Figure S2
Kinase activity is contained within BRD4 subregions spanning BD2-B-BID domains. A, schematic map of WT, deletion mutants, and fragments of BRD4. B, in vitro kinase assay using radiolabeled ATP showing autophosphorylation of WT, tΔC, and ΔN recombinant BRD4 proteins, all at 50 nM. Kinase activity relative to WT is shown. C, in vitro kinase assays of 200 nM BRD4 275 to 730 aa fragment using radiolabeled ATP and 100 nM GST-CTD27-52 and 100 nM GST-TAF7 as substrates.
Figure S3
Figure S3
BRD4 kinase activity maps with the segment 351 to 598 aa, but does not require the B motif. A, schematic map of WT, deletion mutants, and fragments of BRD4. B, in vitro kinase assay using radiolabeled ATP showing kinase activities of WT, Δ351 to 598, ΔET (601–683), ΔET/SEED (600–730), ΔSEED (684–730), and 1 to 600 recombinant BRD4 fragment, all at 50 nM, using 60 nM TAF7 as substrate. Kinase activity relative to WT is shown. C, in vitro kinase assay using radiolabeled ATP showing kinase activities of 25 nM WT and ΔB (503–548), using 100 nM TAF7 as substrate. Kinase activity of ΔB is shown relative to WT.
Figure S4
Figure S4
BRD4 kinase activity is contained within the BD2-B-BID domains. The summary of the auto and trans kinase activities for the recombinant BRD4 proteins is shown. +, indicates phosphorylation, −, indicates no phosphorylation.
Figure S5
Figure S5
BRD4 Elution Profile is Unaffected by Treatment with Nonionic Detergents or Hexanediol. Top: Size exclusion profile of mouse BRD4 on SuperoseTM 6 increase column at 4 °C in standard buffer conditions. Middle: The SEC profile of mouse BRD4 on SuperoseTM 6 increase column at 4 °C in standard buffer conditions with 1 mM PMSF, 2 mM TCEP, and 0.1% DDM. Bottom: The SEC profile of mouse BRD4 on SuperoseTM 6 increase column at 4 °C in standard buffer conditions with 1 mM PMSF, 2 mM TCEP, and 5% hexanediol.
Figure S6
Figure S6
Pol II CTD is a moderately compact monomer. A, size exclusion profile of CTD1-52 on SuperoseTM 6 increase column at 4  °C. The inset shows the standard calibration curve run on same condition. Fraction 2 was used for further AUC experiments. B, 10% SDS-PAGE of the input and SEC fractions of CTD. Full-length CTD migrates at ∼65 kD. A minor degradation product of ∼22 kD was also observed at the bottom of the gel. C, the normalized c(s) distribution plots using two different concentrations of CTD1-52 are shown 4.4 μM (purple) and 2 μM (blue). Data were acquired using A280 absorbance. Additionally, a slower sedimenting population at 2 S is observed (Figs. S2, C and D), which reflects a smaller molecular weight protein species resolved in SDS-PAGE from SEC fractions, as shown in Fig. S2B. Absorbance scans of 4.4 μM CTD sedimenting at 50,000 rpm as observed by absorbance at 280 nm (symbols, for clarity showing only every third data point of every second scan) and c(s) sedimentation coefficient distribution model (lines). The color temperature from purple to red indicates temporal evolution.

References

    1. Devaiah B.N., Gegonne A., Singer D.S. Bromodomain 4: A cellular Swiss army knife. J. Leukoc. Biol. 2016;100:679–686. - PMC - PubMed
    1. Dey A., Ellenberg J., Farina A., Coleman A.E., Maruyama T., Sciortino S., Lippincott-Schwartz J., Ozato K. A bromodomain protein, MCAP, associates with mitotic chromosomes and affects G2-to-M transition. Mol. Cell. Biol. 2000;20:6537–6549. - PMC - PubMed
    1. Uppal S., Gegonne A., Chen Q., Thompson P.S., Cheng D., Mu J., Meerzaman D., Misra H.S., Singer D.S. The bromodomain protein 4 contributes to the regulation of alternative splicing. Cell Rep. 2019;29:2450–2460.e5. - PMC - PubMed
    1. Devaiah B.N., Lewis B.A., Cherman N., Hewitt M.C., Albrecht B.K., Robey P.G., Ozato K., Sims R.J., Singer D.S. BRD4 is an atypical kinase that phosphorylates serine2 of the RNA polymerase II carboxy-terminal domain. Proc. Natl. Acad. Sci. U. S. A. 2012;109:6927–6932. - PMC - PubMed
    1. Devaiah B.N., Singer D.S. Cross-talk among RNA polymerase II kinases modulates C-terminal domain phosphorylation. J. Biol. Chem. 2012;287:38755–38766. - PMC - PubMed

Publication types

MeSH terms