. 2021 Nov:73:103638.
doi: 10.1016/j.ebiom.2021.103638. Epub 2021 Oct 21.

Somatosensory dysfunction is masked by variable cognitive deficits across patients on the Alzheimer's disease spectrum

Affiliations

Somatosensory dysfunction is masked by variable cognitive deficits across patients on the Alzheimer's disease spectrum

Alex I Wiesman et al. EBioMedicine. 2021 Nov.

Abstract

Background: Alzheimer's disease (AD) is generally thought to spare primary sensory function; however, such interpretations have drawn from a literature that has rarely taken into account the variable cognitive declines seen in patients with AD. As these cognitive domains are now known to modulate cortical somatosensory processing, it remains possible that abnormalities in somatosensory function in patients with AD have been suppressed by neuropsychological variability in previous research.

Methods: In this study, we combine magnetoencephalographic (MEG) brain imaging during a paired-pulse somatosensory gating task with an extensive battery of neuropsychological tests to investigate the influence of cognitive variability on estimated differences in somatosensory function between biomarker-confirmed patients on the AD spectrum and cognitively-normal older adults.

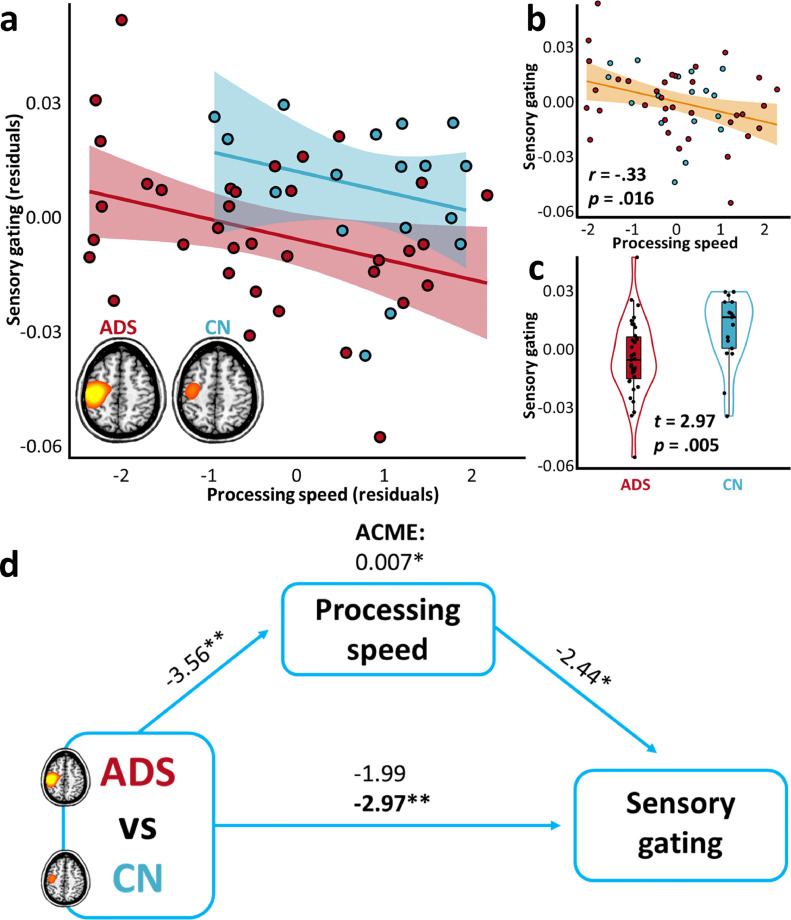
Findings: We show that patients on the AD spectrum exhibit largely non-significant differences in somatosensory function when cognitive variability is not considered (p-value range: .020-.842). However, once attention and processing speed abilities are considered, robust differences in gamma-frequency somatosensory response amplitude (p < .001) and gating (p = .004) emerge, accompanied by significant statistical suppression effects.

Interpretation: These findings suggest that patients with AD exhibit insults to functional somatosensory processing in primary sensory cortices, but these effects are masked by variability in cognitive decline across individuals.

Funding: National Institutes of Health, USA; Fremont Area Alzheimer's Fund, USA.

Keywords: Amyloid-β; Gamma oscillations; Magnetoencephalography; Neuropsychology; Sensory gating.


Conflict of interest statement

Declaration of Competing Interest All authors declare no conflicts of interest. Dr. Murman reported receiving grants from Green Valley Pharmaceuticals, Functional Neuromodulation, Roche, and Eli Lilly and Co. and serving on an advisory board for Biogen. Dr. Wilson reported serving as a board member for the American Clinical Magnetoencephalography Society and the International Society for the Advancement of Clinical Magnetoencephalography.

Figures

Fig 1
Fig. 1
Oscillatory neural responses to paired-pulse somatosensory stimulation. (a) The spectrogram (top) displays time-frequency data from a representative gradiometer (MEG0233), with time represented (in milliseconds) on the x-axis and frequency represented (in Hz) on the y-axis. The two vertical dotted lines represent the onset of the paired-pulse somatosensory stimulations (at 0 and 500 ms), and the time-frequency windows used as the pre-stimulus baseline and those identified as the neural responses to somatosensory stimulation in the sensor-level statistical analysis, are outlined by black dotted rectangles. The topographic maps (bottom left) indicate the spatial distribution of the gamma-frequency (30–80 Hz) responses to first (left; 0–75 ms) and second (right; 500–575 ms) somatosensory stimulations. The color bar in the middle of the figure displays the amplitude thresholds (in percent change from baseline) used for display of both the spectrogram and the topographic maps. (b) Inlaid brain images indicate the source-imaged data, averaged over both somatosensory responses and within each group (ADS: Alzheimer's disease spectrum, red; CN: cognitively-normal, blue), with the amplitude thresholds (in pseudo-t values) used for display shown on the color bar below. The time series represent peak-voxel amplitude envelopes for these gamma responses, per each group, with time (in milliseconds) on the x-axis and response amplitude (in percent change from baseline) on the y-axis. Shaded areas indicate ± 1 standard error of the mean. The baseline interval, as well as the onset of each somatosensory stimulation, are indicated just above the x-axis.
Fig 2
Fig. 2
Processing speed abilities suppress group differences in somatosensory response amplitude. The scatterplot in (a) indicates the relationship between processing speed abilities (x-axis) and response amplitude (y-axis), per each group (ADS: Alzheimer's disease spectrum, red; CN: cognitively-normal, blue), above and beyond the effects of age. The lines of best fit, per each group, are overlaid with 95% confidence intervals indicated in the shaded area. The scatterplot in (b) indicates the same relationship, above and beyond the effects of age and group, with the partial correlation coefficient (r) and corresponding p-value overlaid, along with the line of best-fit and 95% confidence intervals. The plot in (c) represents the difference in response amplitude as a function of group, above and beyond the effects of processing speed and age, with the t-value and corresponding p-value overlaid. Box plots represent conditional means, first and third quartiles, and minima and maxima, and violin plots show the probability density. Paths in (d) between the three variables of interest are represented by blue arrows, with t-values above each indicating the relationship strength, above and beyond the effects of age. The bold t-value at the bottom represents the relationship between group and response amplitude, after accounting for the effect of processing speed scores, and the average causal mediation effect (ACME) at top represents the indirect impact of processing speed on this relationship (10,000 bootstrapping simulations). **p < .005. *p < .05.
Fig 3
Fig. 3
Attention abilities suppress group differences in somatosensory gating. The scatterplot in (a) indicates the relationship between attention abilities (x-axis) and the somatosensory gating ratio (y-axis), per each group (ADS: Alzheimer's disease spectrum, red; CN: cognitively-normal, blue), above and beyond the effects of age. The lines of best fit, per each group, are overlaid with 95% confidence intervals indicated in the shaded area. The scatterplot in (b) indicates the same relationship, above and beyond the effects of age and group, with the partial correlation coefficient (r) and corresponding p-value overlaid, along with the line of best-fit and 95% confidence intervals. The plot in (c) represents the difference in somatosensory gating as a function of group, above and beyond the effects of attention and age, with the t-value and corresponding p-value overlaid. Box plots represent conditional means, first and third quartiles, and minima and maxima, and violin plots show the probability density. Paths in (d) between the three variables of interest are represented by blue arrows, with t-values above each indicating the relationship strength, above and beyond the effects of age. The bold t-value at the bottom represents the relationship between group and somatosensory gating, after accounting for the effect of attention scores, and the average causal mediation effect (ACME) at the top represents the indirect impact of attention on this relationship (10,000 bootstrapping simulations). **p < .005. *p < .05.
Fig 4
Fig. 4
Processing speed abilities suppress group differences in somatosensory gating. The scatterplot in (a) indicates the relationship between processing speed abilities (x-axis) and the somatosensory gating ratio (y-axis), per each group (ADS: Alzheimer's disease spectrum, red; CN: cognitively-normal, blue), above and beyond the effects of age. The lines of best fit, per each group, are overlaid with 95% confidence intervals indicated in the shaded area. The scatterplot in (b) indicates the same relationship, above and beyond the effects of age and group, with the partial correlation coefficient (r) and corresponding p-value overlaid, along with the line of best-fit and 95% confidence intervals. The plot in (c) represents the difference in somatosensory gating as a function of group, above and beyond the effects of processing speed and age, with the t-value and corresponding p-value overlaid. Box plots represent conditional means, first and third quartiles, and minima and maxima, and violin plots show the probability density. Paths in (d) between the three variables of interest are represented by blue arrows, with t-values above each indicating the relationship strength, above and beyond the effects of age. The bold t-value at the bottom represents the relationship between group and somatosensory gating, after accounting for the effect of processing speed scores, and the average causal mediation effect (ACME) at the top represents the indirect impact of processing speed on this relationship (10,000 bootstrapping simulations). **p < .005. *p < .05.
Fig 5
Fig. 5
Amyloid-β uptake in primary somatosensory cortex predicts learning in patients on the AD spectrum. The histogram and density plot on the left indicates the distribution of amyloid-β SUVRs (x-axis) at the peak voxel of the MEG somatosensory response in patients on the AD spectrum (shown on the inlaid PET image). The scatterplot on the right indicates the relationship between this somatosensory amyloid-β uptake (in SUVRs; x-axis) and learning function (y-axis) in patients on the AD spectrum, above and beyond the effects of age. The line of best fit is overlaid with 95% confidence intervals indicated in the shaded area, as are the partial correlation coefficient and corresponding p-value.

Similar articles

Cited by

References

    1. Aisen P.S., Cummings J., Jack C.R., Morris J.C., Sperling R., Frölich L. On the path to 2025: understanding the Alzheimer's disease continuum. Alzheimer's Res Ther. 2017;9(1):60. - PMC - PubMed
    1. Jack C.R., Wiste H.J., Weigand S.D., Therneau T.M., Lowe V.J., Knopman D.S. Defining imaging biomarker cut points for brain aging and Alzheimer's disease. Alzheimer's Dement. 2017;13(3):205–216. - PMC - PubMed
    1. Jones D.T., Knopman D.S., Gunter J.L., Graff-Radford J., Vemuri P., Boeve B.F. Cascading network failure across the Alzheimer's disease spectrum. Brain. 2016;139(2):547–562. - PMC - PubMed
    1. Uylings H.B., De Brabander J. Neuronal changes in normal human aging and Alzheimer's disease. Brain Cogn. 2002;49(3):268–276. - PubMed
    1. Frisoni G.B., Fox N.C., Jack C.R., Scheltens P., Thompson PM. The clinical use of structural MRI in Alzheimer disease. Nat Rev Neurol. 2010;6(2):67–77. - PMC - PubMed

MeSH terms

Substances