. 2021 Nov:73:103646.
doi: 10.1016/j.ebiom.2021.103646. Epub 2021 Oct 21.

Molecular modelling of the FOXO4-TP53 interaction to design senolytic peptides for the elimination of senescent cancer cells

Affiliations

Molecular modelling of the FOXO4-TP53 interaction to design senolytic peptides for the elimination of senescent cancer cells

Hillary H Le et al. EBioMedicine. 2021 Nov.

Abstract

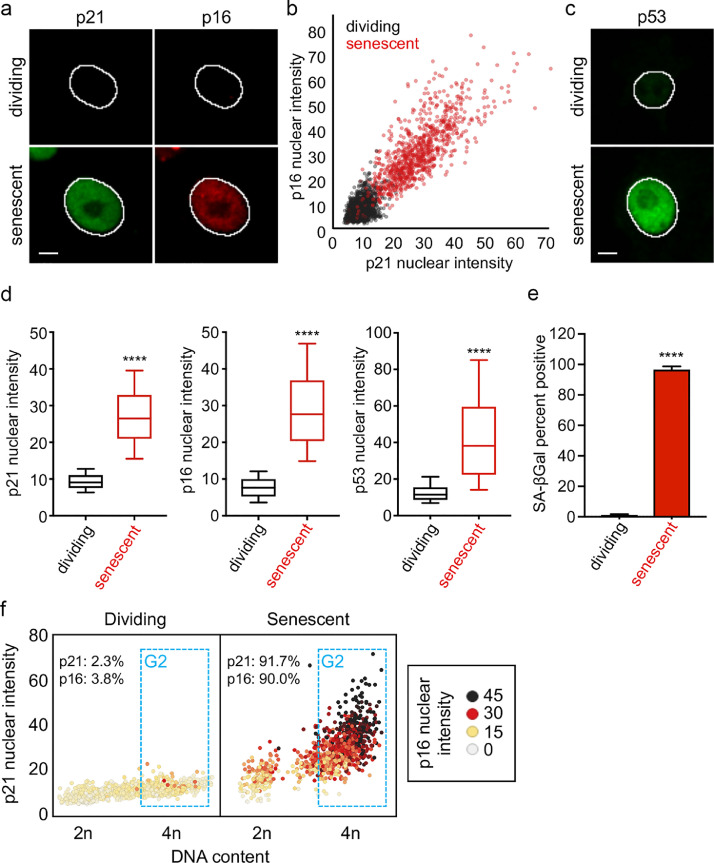
Background: Senescent cells accumulate in tissues over time as part of the natural ageing process and the removal of senescent cells has shown promise for alleviating many different age-related diseases in mice. Cancer is an age-associated disease and there are numerous mechanisms driving cellular senescence in cancer that can be detrimental to recovery. Thus, it would be beneficial to develop a senolytic that acts not only on ageing cells but also senescent cancer cells to prevent cancer recurrence or progression.

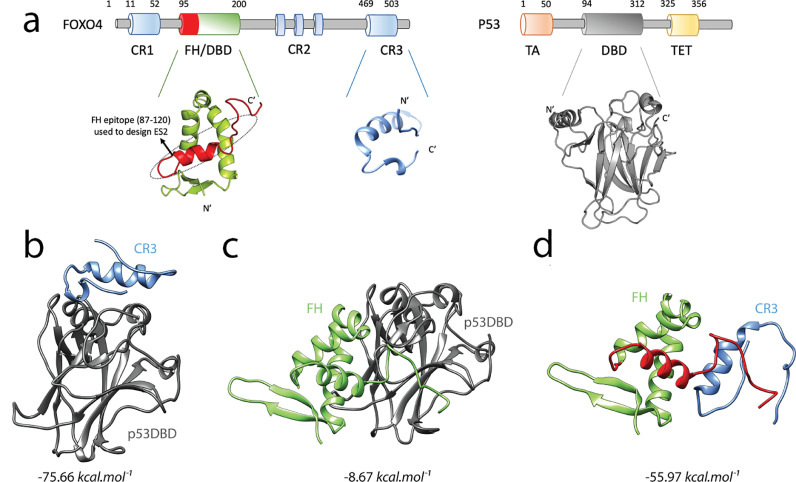
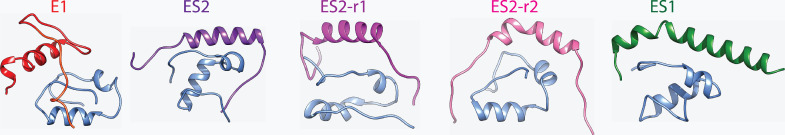
Methods: We used molecular modelling to develop a series of rationally designed peptides to mimic and target FOXO4 disrupting the FOXO4-TP53 interaction and releasing TP53 to induce apoptosis. We then tested these peptides as senolytic agents for the elimination of senescent cells both in cell culture and in vivo.

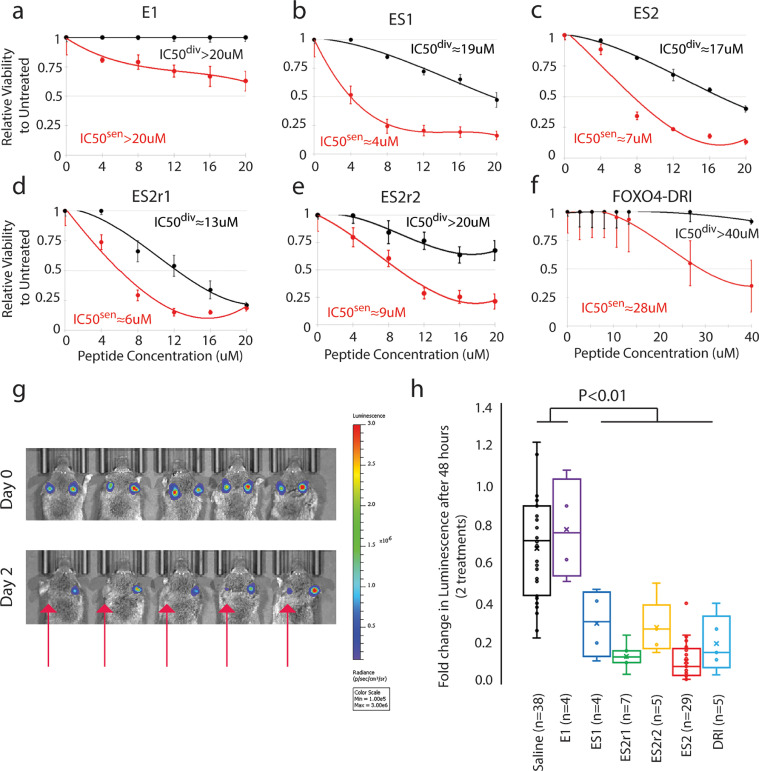
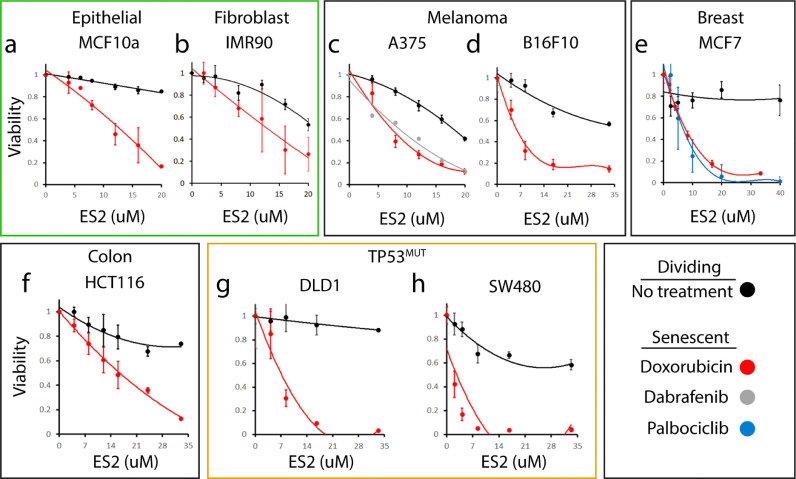
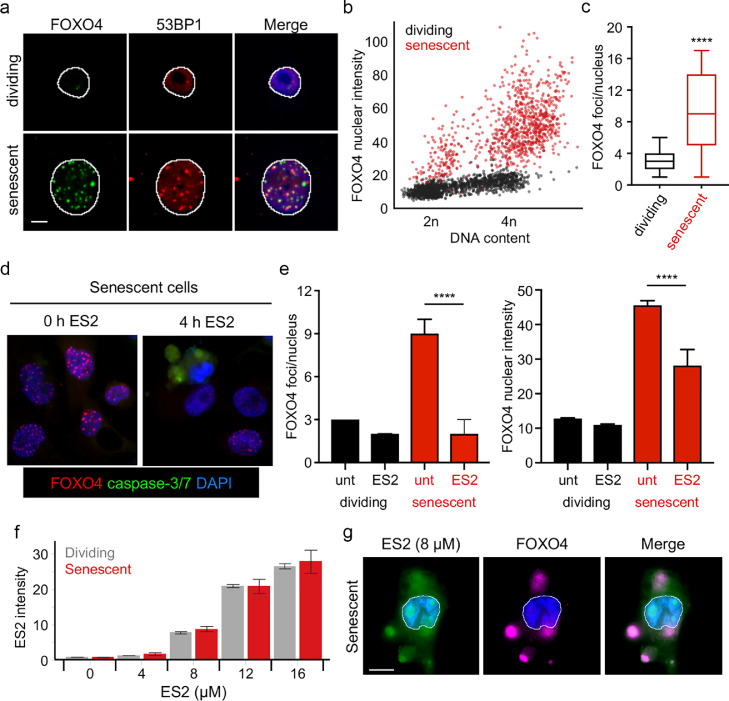
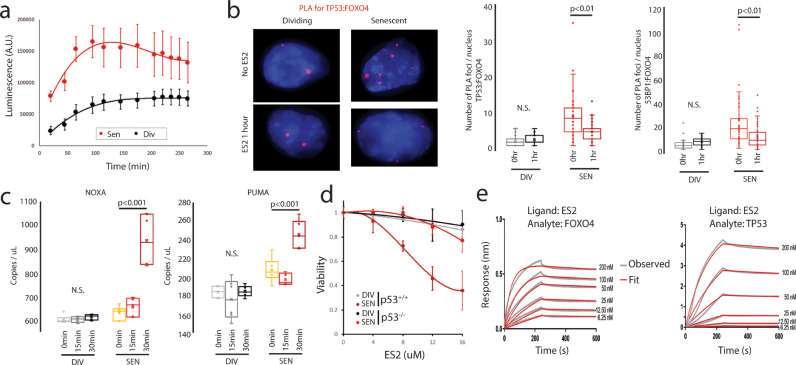
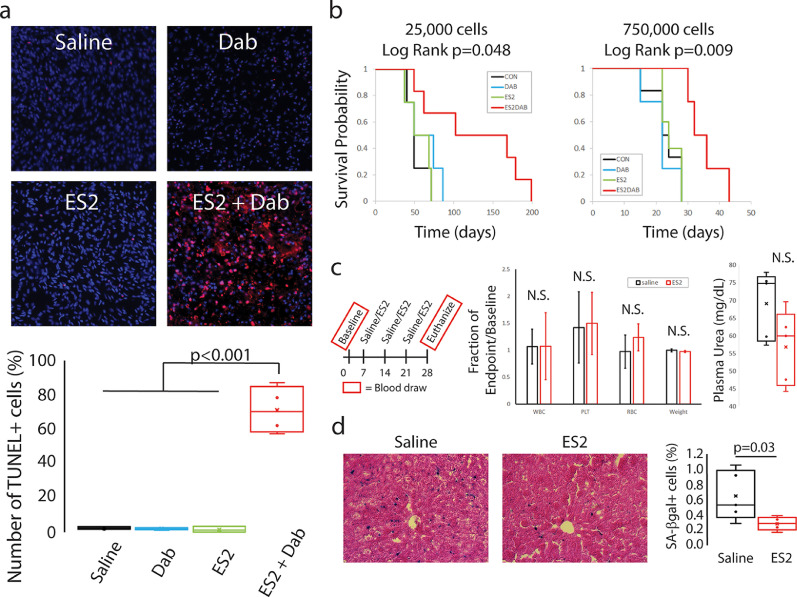
Findings: Here we show that these peptides can act as senolytics for eliminating senescent human cancer cells both in cell culture and in orthotopic mouse models. We then further characterized one peptide, ES2, showing that it disrupts FOXO4-TP53 foci, activates TP53 mediated apoptosis and preferentially binds FOXO4 compared to TP53. Next, we show that intratumoural delivery of ES2 plus a BRAF inhibitor results in a significant increase in apoptosis and a survival advantage in mouse models of melanoma. Finally, we show that repeated systemic delivery of ES2 to older mice results in reduced senescent cell numbers in the liver with minimal toxicity.

Interpretation: Taken together, our results reveal that peptides can be generated to specifically target and eliminate FOXO4+ senescent cancer cells, which has implications for eradicating residual disease and as a combination therapy for frontline treatment of cancer.

Funding: This work was supported by the Cancer Early Detection Advanced Research Center at Oregon Health & Science University.

Keywords: Cancer; FOXO4; Senolytic; TP53.


Conflict of interest statement

Declaration of Competing Interest S.S. Cinaroglu, Y. Ahiska, U. Sezerman, G. Bayram Akcapinar, E. Timucin have a patent for the ES2 structure and are members of a company, Eternans Ltd. that is working on ES2 for therapeutic use. No potential conflicts of interest were disclosed by the other authors.

Figures

Fig 1
Fig. 1
Computational design of peptide targeting FOXO4. a, Domains of FOXO4 and TP53 (p53). FOXO4FH (PDB ID: 3L2C), in its closed state, interacts with FOXO4CR3. TP53DBD (PDB ID: 3KMD), disrupts this intramolecular interaction and binds both FOXO4FH and FOXO4CR3. The FH epitope (87-120) which was used to design the senolytic peptide ES2 is coloured red and framed with dashed lines. Protein-protein docking analysis of b, FOXO4CR3-TP53DBD, c, FOXO4FH-TP53DBD and d, FOXO4FH-CR3. The TP53DBD is colored gray, FOXO4FH is green and FOXO4CR3 is blue. The FOXO4 epitope used to design the senolytic peptide ES2 is coloured red. For b, c and d the binding free energy (ΔGbind) of the complexes which were predicted by MM-GBSA is given. See also Fig. S1 and S2 and Table S1 and S2.
Fig 2
Fig. 2
Structures of CR3-peptide complexes.
Fig 3
Fig. 3
Characterizing senescent cells. a, Representative images of CDKN1A (p21) and CDKN2A (p16) in A375 cells. Senescence was induced using doxorubicin (40 nM) for 4 days. The outline of the nucleus is indicated by the white line. Scale bar is 10 µm. b, Scatterplot of the p21 nuclear intensity vs. the p16 nuclear intensity of individual cells either mock-treated (dividing) or doxorubicin-treated (senescent) A375 cells. Red dots indicate cells that were treated with doxorubicin. Units of fluorescence intensity are arbitrary. c, Representative images of TP53 (p53) in A375 cells treated as described in a. d, Box and whisker plots of p21, p16, and p53 nuclear intensities in A375 cells treated as described in a. **** p-value < 0.0001. e, Bar graph of the percent of A375 cells positive for SA-β-gal. **** p-value < 0.0001. f, Scatterplot of the DNA content vs. the p21 nuclear intensity of individual A375 cells treated as in a. Color scale indicates the p16 nuclear intensity. Units of fluorescence intensity are arbitrary. The G2 phase cells are gated in blue. Percent positive for p21 and p16 is indicated for both dividing and senescent cells. See also Fig. S3.
Fig 4
Fig. 4
Senolytic activity of a series of rationally designed peptides in cell culture and in vivo. a-f, Line plots of the relative viability of the different peptides to dividing (black) or senescent (red) A375 cells: E1 (a), ES1 (b), ES2 (c), ES2r1 (d), ES2r2 (e) and FOXO4-DRI (f). Lines are best fit polynomial. IC50div is the concentration to kill 50% of dividing cells. IC50sen is the concentration to kill 50% of senescent cells. g, Images of mice with luciferase expressing, senescent, human melanoma cells injected orthotopically. Both ears of each mouse were injected with an equal number of doxorubicin-induced senescent A375 cells. The left ear was locally injected with ES2 (50 µL of 5 mg/mL) after imaging on day 0 and day 1 (red arrow). The right ear was injected with saline at the same time. Mice were then again imaged at day 2. h, Quantification of the fold change in radiance before and after saline or peptide treatment. Since the A375 cancer cells are senescent, there is a slight decrease in signal in the saline treated ears. ES2 (n=29), ES2r1 (n=7), ES2r2 (n=5), ES1 (n=4), and DRI (n=5) are significantly different from saline (n=38) and E1 (n=4) (ANOVA Scheffe post-hoc test). See also Fig. S3.
Fig 5
Fig. 5
Senolytic activity of ES2 in different cell lines, different senescence inducers and different TP53 status. a-h, Line plots of relative viability of seven different cell lines on dividing cells (black) or senescent cells from different senescence inducers: Doxorubicin (red), Dabrafenib (grey), and Palbociclib (blue). Solid lines are best fit polynomial. a-b, Normal epithelial cell line, MCF10a, and fibroblast cell line, IMR90. c-d, Melanoma cell lines A375 and B16F10 (mouse). e, Breast cancer cell line MCF7. f, Colorectal cancer cell line HCT116. g-h, TP53 mutant colorectal cancer cell lines DLD1 and SW480.
Fig 6
Fig. 6
ES2 disrupts FOXO4 foci and localizes to FOXO4 foci. a, Representative images of FOXO4 and TP53BP1 (53BP1) in A375 cells treated as described in Fig. 3a. Scale bar is 10 µm. b, Scatterplot of the FOXO4 nuclear intensity vs. the DNA content (DAPI intensity) of individual cells either mock-treated (dividing) or doxorubicin-treated (senescent) A375 cells. Red dots indicate cells treated with doxorubicin. Units of fluorescence intensity are arbitrary. c, Box and whisker plots of the FOXO4 foci/nucleus in A375 cells treated as described in a. **** p-value < 0.0001. d, Representative images of FOXO4 and active caspase-3/7 in senescent A375 cells treated with ES2 8 µM for 4 h. e, Bar graphs of the median FOXO4 foci/nucleus and median FOXO4 nuclear intensity in A375 cells treated as described in e. unt (untreated). Error bars denote the 95% confidence interval. **** p-value < 0.0001. f, Plots of median fluorescence intensity of ES2-BODIPY at 2 h after addition of labeled ES2 to dividing or senescent A375 cells. g, Representative images of A375 senescent cells 2 h after addition of ES2-BODIPY showing the overlay of FOXO4 (purple) and ES2 (green) outside of the nucleus in dying cells. The nucleus is stained with DAPI (blue) and outlined. Scale bar = 10 µm.
Fig 7
Fig. 7
ES2 rapidly destroys TP53-FOXO4 foci leading to TP53 mediated apoptosis. a, Annexin V live staining showing that rapid induction of apoptosis is greater in senescent (Sen) compared to dividing (Div) cells (p=0.001) (n=5 for each time point). b, Proximity Ligation Assay showing increased FOXO4-TP53 and FOXO4-53BP1 foci (red) in senescent cells (n=41 for each) compared to dividing cells (n=41 and 36, respectively) (p<0.001). In addition, FOXO4-TP53 foci and FOXO4-53BP1 foci are reduced 1 hour after ES2 treatment in senescent cells (n=33 and 47 respectively) (p<0.01) but not dividing cells (n=41 and 44). c, ddPCR expression analysis shows that ES2 does not increase TP53 target genes in dividing cells, but shows a statistically significant increase after 30 minutes of ES2 treatment in senescent cells (n=6 for each time point) (p<0.001). d, Line plot of relative viability of MCF10a dividing (black) and senescent (red) cells with or without TP53 following a range of ES2 treatments. e, Bio-layer Interferometry analysis reveals ES2 preferentially binds FOXO4. Representative sensorgrams of FOXO4 binding to biotinylated ES2 peptide immobilized on streptavidin sensors. Representative sensorgrams of TP53 binding to biotinylated ES2 peptide immobilized on streptavidin sensors. See also Fig. S4 and S5.
Fig 8
Fig. 8
Concomitant treatment of ES2 plus dabrafenib results in apoptosis of melanoma cells. a, Images of melanoma sections from Tyr-BE transgenic mice. The tissue sections were stained for TUNEL+ cells (red) to measure apoptosis and DAPI (blue) for total nuclei. Quantification of the number of TUNEL+ cells in saline (n=4), Dabrafenib alone (n=4), ES2 alone (n=3), and ES2 + Dabrafenib (n=4) treatment. ES2 + Dab resulted in a 23-fold induction in apoptosis compared to saline, Dab alone or ES2 alone (p<0.001). There was no difference between saline, Dab alone or ES2 alone (p=0.99). ANOVA Scheffe PostHoc test. b, Concomitant treatment of ES2 plus dabrafenib improves overall survival. Kaplan-Meier curves for survival of mice under different treatments. CON – vehicle alone, ES2 – ES2 alone, DAB – Dabrafenib alone, ES2DAB – ES2 plus Dabrafenib. For 25,000 cells: CON – n=4, ES2 – n=4, DAB – n=4, ES2DAB – n=6. Log rank test of significance. For 750,000 cells: CON – n=6, ES2 – n=5, DAB – n=4, ES2DAB – n=4. c, Treatment regimen for aged mice. No statistically significant (N.S.) difference in change in White Blood Cells (WBC), Platelets (PLT), Red Blood Cells (RBC) or weight of mice between ES2 treatment and controls (n=5 per treatment). No statistically significant difference in endpoint plasma urea between ES2 treatment and controls (n=5 per treatment). d, Representative images of liver sections stained for SA-β-gal. Quantification of SA-β-gal+ cells in liver section shows reduced SA-β-gal+ cells after ES2 treatment (p=0.03) (n=5 per treatment). Student T-test. See also Fig. S6.

References

    1. Lopez-Otin C, Blasco MA, Partridge L, Serrano M, Kroemer G. The hallmarks of aging. Cell. 2013;153(6):1194–1217. Epub 2013/06/12. - PMC - PubMed
    1. Hoeijmakers JH. DNA damage, aging, and cancer. N. Engl. J. Med. 2009;361(15):1475–1485. Epub 2009/10/09. - PubMed
    1. Munoz-Espin D, Canamero M, Maraver A, Gomez-Lopez G, Contreras J, Murillo-Cuesta S. Programmed cell senescence during mammalian embryonic development. Cell. 2013;155(5):1104–1118. Epub 2013/11/19. - PubMed
    1. Demaria M, Ohtani N, Youssef SA, Rodier F, Toussaint W, Mitchell JR. An essential role for senescent cells in optimal wound healing through secretion of PDGF-AA. Dev. Cell. 2014;31(6):722–733. Epub 2014/12/17. - PMC - PubMed
    1. Hayflick L. The Limited in Vitro Lifetime of Human Diploid Cell Strains. Exp. Cell Res. 1965;37:614–636. Epub 1965/03/01. - PubMed

MeSH terms