. 2021 Oct 23;151(12 Suppl 2):75S-92S.
doi: 10.1093/jn/nxab244.

Development and Validation of a Novel Food-Based Global Diet Quality Score (GDQS)

Affiliations

Development and Validation of a Novel Food-Based Global Diet Quality Score (GDQS)

Sabri Bromage et al. J Nutr. .

Abstract

Background: Poor diet quality is a major driver of both classical malnutrition and noncommunicable disease (NCD) and was responsible for 22% of adult deaths in 2017. Most countries face dual burdens of undernutrition and NCDs, yet no simple global standard metric exists for monitoring diet quality in populations and population subgroups.

Objectives: We aimed to develop an easy-to-use metric for nutrient adequacy and diet related NCD risk in diverse settings.

Methods: Using cross-sectional and cohort data from nonpregnant, nonlactating women of reproductive age in 10 African countries as well as China, India, Mexico, and the United States, we undertook secondary analyses to develop novel metrics of diet quality and to evaluate associations between metrics and nutrient intakes and adequacy, anthropometry, biomarkers, type 2 diabetes, and iteratively modified metric design to improve performance and to compare novel metric performance to that of existing metrics.

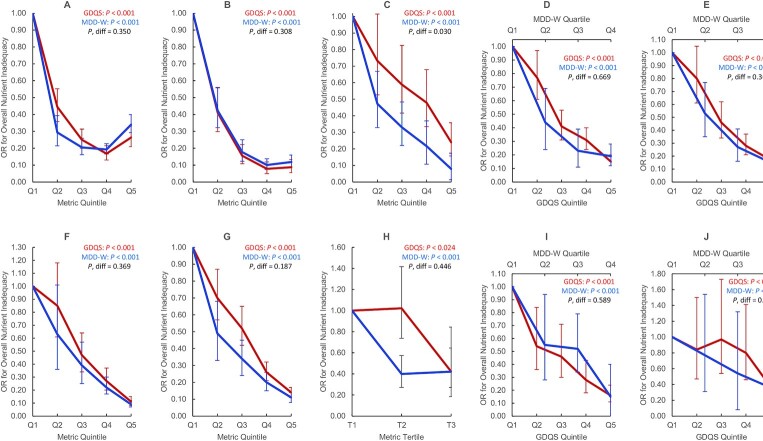
Results: We developed the Global Diet Quality Score (GDQS), a food-based metric incorporating a more comprehensive list of food groups than most existing diet metrics, and a simple means of scoring consumed amounts. In secondary analyses, the GDQS performed comparably with the Minimum Dietary Diversity - Women indicator in predicting an energy-adjusted aggregate measure of dietary protein, fiber, calcium, iron, zinc, vitamin A, folate, and vitamin B12 adequacy and with anthropometric and biochemical indicators of undernutrition (including underweight, anemia, and serum folate deficiency), and the GDQS also performed comparably or better than the Alternative Healthy Eating Index - 2010 in capturing NCD-related outcomes (including metabolic syndrome, change in weight and waist circumference, and incident type 2 diabetes).

Conclusions: The simplicity of the GDQS and its ability to capture both nutrient adequacy and diet-related NCD risk render it a promising candidate for global monitoring platforms. Research is warranted to validate methods to operationalize GDQS assessment in population surveys, including a novel application-based 24-h recall system developed as part of this project.

Keywords: GDQS; diet quality metrics; dietary diversity; double burden of malnutrition; monitoring and evaluation; noncommunicable disease; nutrient adequacy; nutrition surveillance; nutrition transition; nutritional epidemiology.


Figures

FIGURE 1
FIGURE 1
Covariate-adjusted ORs for binary overall nutrient inadequacy by GDQS and MDD-W quintile, quartile, or tertile in nonpregnant nonlactating women of reproductive age in the total population or within urban stratum and rural strata of cross-sectional datasets. We defined several aggregate measures of protein, fiber, calcium, iron, zinc, vitamin A, folate, and vitamin B12 adequacy. In FFQ analysis, a continuous overall nutrient adequacy variable was first constructed for each participant in the data, based on the number of nutrients (out of 8) meeting age- and sex-specific EARs from the Institute of Medicine (or adequate intake level, in the case of fiber) (39); iron adequacy was defined as ≥50% probability of adequacy based on a lognormal requirement distribution (40). In 24HR analysis [based on 3-day averages (China) or estimated usual intakes based on the ISU method (Mexico) (41)], probability of adequacy for all nutrients was estimated using the full probability method (40). Iron requirement distributions and zinc EARs were adjusted to account for absorption characteristics of local diets (,–44). Because nutrient requirements are age-specific, they indirectly account for age differences in energy intake to an extent, but not entirely. To account for residual confounding by energy, we therefore adjusted overall nutrient adequacy for energy using the residual method (45), and added the resulting residuals back to the mean of the raw overall nutrient adequacy variable. We derived a binary measure of overall nutrient inadequacy defined as <4 adequate nutrients (in FFQ data) or < 50% mean probability of adequacy (in 24HR data). We also derived a binary measure of energy-adjusted overall nutrient inadequacy (shown in this figure) by adjusting the continuous overall nutrient adequacy variable for energy using the residual method, ranking the residuals, and assigning a value of 1 to those in the top Xth percentile and 0 to those in the bottom, in which X is the proportion of individuals in the raw data with <4 adequate nutrients (in FFQ data) or <50% mean probability of adequacy (in 24HR data). Energy-adjusted overall nutrient inadequacy therefore preserves the distribution of raw overall nutrient inadequacy. This figure displays linear trends in overall nutrient inadequacy across metric quintiles (P), statistically compared using regression models in which quintiles of 2 metrics are included in the same model and the parameter estimates associated with quintile 5 are compared using a Wald test (P, diff) (35). Models were adjusted for age (India and Millennium Villages); age, urban/rural locality, education, marital status, occupation (Ethiopia); age, socioeconomic status, education, physical activity, smoking, alcohol use, occupation, urban/rural locality (China); age, socioeconomic status, urban/rural locality (Mexico). Trends did not differ between GDQS and MDD-W, except in analysis of Ethiopia FFQ data (in which the MDD-W was more predictive). Due to limited variation across metric quintiles, MDD-W is presented in terms of quartiles in Mexico FFQ and 24HR data, and tertiles in Ethiopia 24HR data. India Total Population FFQ (n = 3065) (A), Millennium Villages Project Rural FFQ (n = 1624) (B), Ethiopia Total Population FFQ (n = 1604) (C), Mexico Urban FFQ (n = 2766) (D), Mexico Rural FFQ (n = 2209) (E), China Urban 24HR (n = 7047) (F), China Rural 24HR (n = 8126) (G), Ethiopia Total Population 24HR (n = 1593) (H), Mexico Urban 24HR (n = 1515) (I), Mexico Rural 24HR (n = 1030) (J). EAR, estimated average requirement; GDQS, Global Diet Quality Score; MDD-W, Minimum Dietary Diversity – Women; 24HR, 24-h recall.

References

    1. GBD 2017 Diet Collaborators. Health effects of dietary risks in 195 countries, 1990–2017: a systematic analysis for the Global Burden of Disease Study 2017. Lancet North Am Ed. 2019;393(10184):1958–72. - PMC - PubMed
    1. International Health Metrics and Evaluation. GBD Compare. [Internet]. Available from:https://vizhub.healthdata.org/gbd-compare/.
    1. Development Initiatives Poverty Research. 2020 Global Nutrition Report: action on equity to end malnutrition. Bristol, United Kingdom: Development Initiatives; 2020.
    1. Arimond M, Deitchler M. Measuring diet quality for women of reproductive age in low- and middle-income countries: towards new metrics for changing diets. Washington, DC: Intake – Center for Dietary Assessment/FHI 360; 2019.
    1. Miller V, Webb P, Micha R, Mozaffarian D, Database GD. Defining diet quality: a synthesis of dietary quality metrics and their validity for the double burden of malnutrition. Lancet Planetary Health. 2020;4(8):e352–70. - PMC - PubMed

Publication types