. 2022 Apr;101(4):465-472.
doi: 10.1177/00220345211046614. Epub 2021 Oct 23.

Genome-wide Gene-by-Sex Interaction Studies Identify Novel Nonsyndromic Orofacial Clefts Risk Locus

Affiliations

Genome-wide Gene-by-Sex Interaction Studies Identify Novel Nonsyndromic Orofacial Clefts Risk Locus

W Awotoye et al. J Dent Res. 2022 Apr.

Abstract

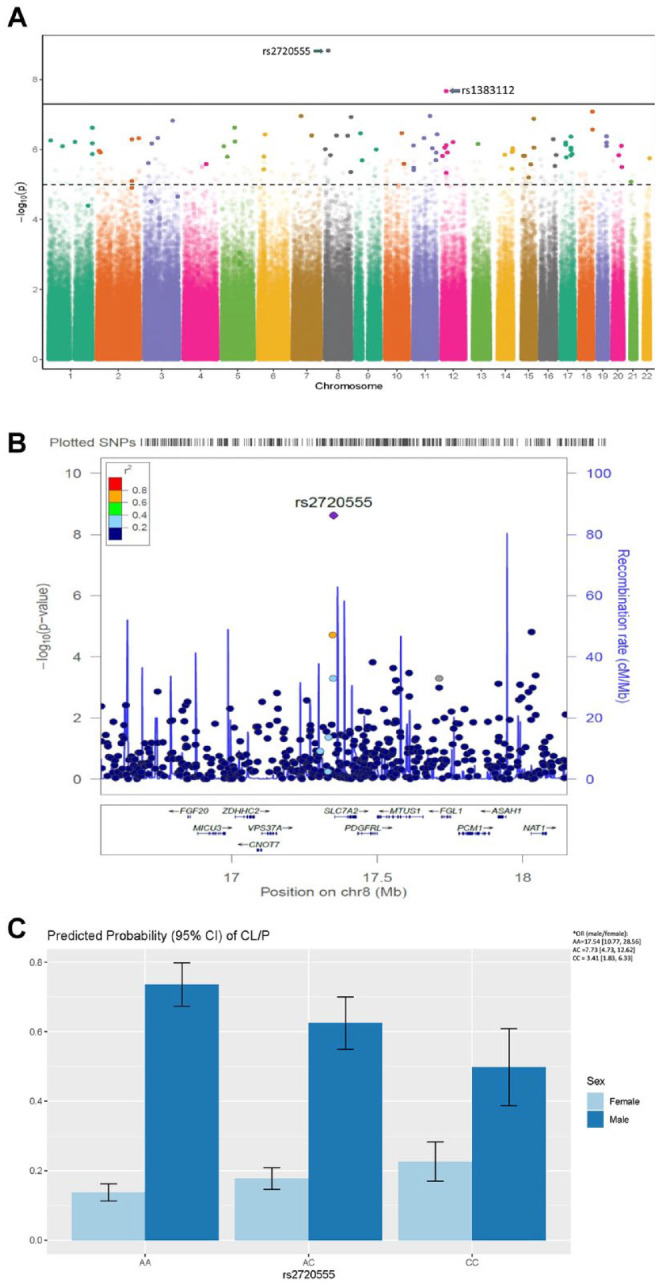
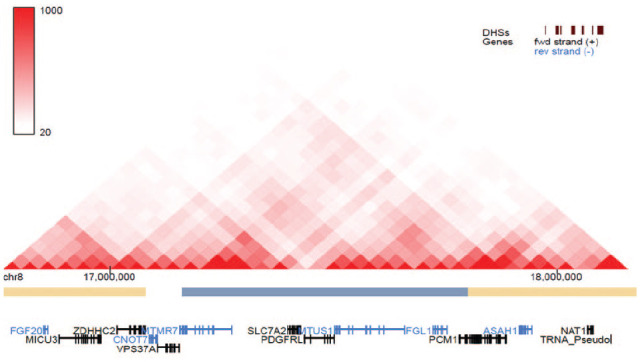
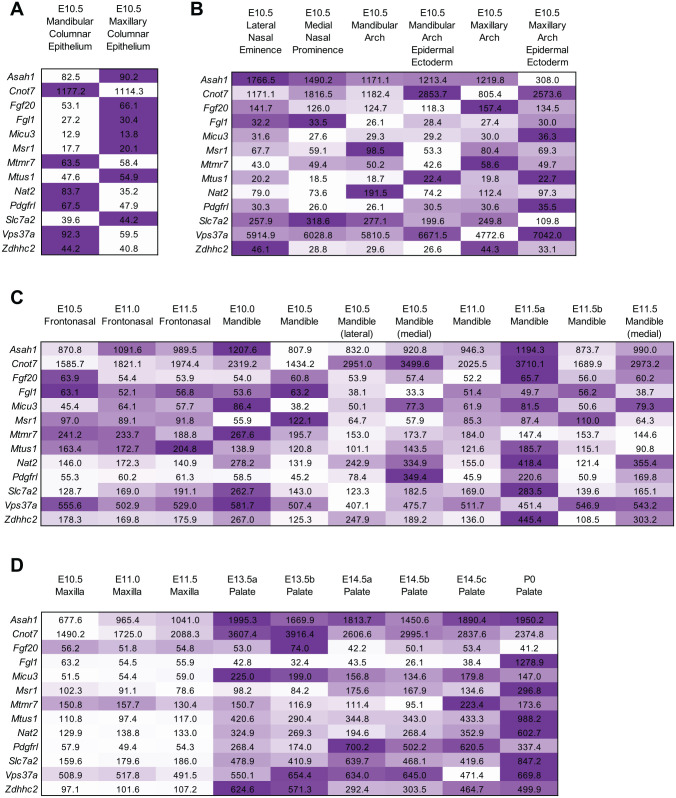
Risk loci identified through genome-wide association studies have explained about 25% of the phenotypic variations in nonsyndromic orofacial clefts (nsOFCs) on the liability scale. Despite the notable sex differences in the incidences of the different cleft types, investigation of loci for sex-specific effects has been understudied. To explore the sex-specific effects in genetic etiology of nsOFCs, we conducted a genome-wide gene × sex (GxSex) interaction study in a sub-Saharan African orofacial cleft cohort. The sample included 1,019 nonsyndromic orofacial cleft cases (814 cleft lip with or without cleft palate and 205 cleft palate only) and 2,159 controls recruited from 3 sites (Ethiopia, Ghana, and Nigeria). An additive logistic model was used to examine the joint effects of the genotype and GxSex interaction. Furthermore, we examined loci with suggestive significance (P < 1E-5) in the additive model for the effect of the GxSex interaction only. We identified a novel risk locus on chromosome 8p22 with genome-wide significant joint and GxSex interaction effects (rs2720555, p2df = 1.16E-08, pGxSex = 1.49E-09, odds ratio [OR] = 0.44, 95% CI = 0.34 to 0.57). For males, the risk of cleft lip with or without cleft palate at this locus decreases with additional copies of the minor allele (p < 0.0001, OR = 0.60, 95% CI = 0.48 to 0.74), but the effect is reversed for females (p = 0.0004, OR = 1.36, 95% CI = 1.15 to 1.60). We replicated the female-specific effect of this locus in an independent cohort (p = 0.037, OR = 1.30, 95% CI = 1.02 to 1.65), but no significant effect was found for the males (p = 0.29, OR = 0.86, 95% CI = 0.65 to 1.14). This locus is in topologically associating domain with craniofacially expressed and enriched genes during embryonic development. Rare coding mutations of some of these genes were identified in nsOFC cohorts through whole exome sequencing analysis. Our study is additional proof that genome-wide GxSex interaction analysis provides an opportunity for novel findings of loci and genes that contribute to the risk of nsOFCs.

Keywords: bioinformatics; craniofacial anomalies; craniofacial biology/genetics; developmental biology; gender differences; gene expression.


Conflict of interest statement

Declaration of Conflicting Interests: The authors declared no potential conflicts of interest with respect to the research, authorship, and/or publication of this article.

Figures

Figure 1.
Figure 1.
Discovery of novel risk locus through genome-wide GxSex interaction analysis in nsOFCs cohorts. (A) Manhattan plot shows the association between the single-nucleotide polymorphisms (SNPs) in the different chromosomes and the –log10(P). The broken line is the threshold P value (1 × 10–5) below which SNPs are considered to be suggestive, while the bold line is the threshold P value (5 × 10–8) below which SNPs are considered to be genome-wide significant. The SNPs plotted in faded colors are not suggestive or significant (P > 1 × 10–5) in the joint test analysis, while those SNPs in bold are at least suggestive (P < 1 × 10–5) in the joint test analysis. The SNP rs2720555 is the most significant with P values of p2df = 1.16E-08 and pGxSex = 1.49E-09 (odds ratio [OR] = 0.44, 95% CI = 0.34 to 0.57). (B) Locus zoom plot illustrates the genome-wide gene × sex interaction significant SNP (rs2720555) and surrounding SNPs with their associated genes. In addition to the parameters shown on the Manhattan plot, this plot presents the recombination rates at different loci. (C) The 95% CI of the predicted probabilities (which estimate the odds) of nonsyndromic cleft lip with or without cleft palate for an additional alternate allele. For every additional minor allele, the odds of nonsyndromic orofacial clefts in males decrease (P < 0.0001, OR = 0.60, 95% CI = 0.48 to 0.74) while the effect is opposite for females (P = 0.0004, OR = 1.36, 95% CI = 1.15 to 1.60). *The odds of nonsyndromic cleft lip with or without cleft palate for an additional minor allele in males versus females is also reported. As expected, this OR (male/female) decreased from 17.54 for alleles AA to 7.73 when there is a copy of the minor allele (AC); this reduced further to 3.41 for a homozygous minor allele (CC).
Figure 2.
Figure 2.
Genes predicted to be in the same topologically associating domain as the genome-wide significant single-nucleotide polymorphism (rs2720555). The single-nucleotide polymorphism is predicted to affect the enhancer-promoter association of the genes listed here. Among these genes are those that are robustly expressed and enriched in different craniofacial tissues during embryonic development.
Figure 3.
Figure 3.
SysFACE analysis of gene expression in mouse craniofacial tissue development. Expression of candidate genes per analysis on (A) FaceBase microarray data sets on platform Affymetrix Mouse Gene 1.0 ST Array, (B) GSE55965 microarray data sets on platform Affymetrix Mouse Gene 1.0 ST Array, and (C, D) GSE7759 microarray data sets on platform Affymetrix Mouse Genome 430 2.0 Array. Heat map is based on expression of individual gene in different tissues (row-wise comparison) per analysis of microarray data sets from different studies. Embryonic (E) and postnatal (P) stages are indicated. Expression of the gene is represented by the intensity of the color. The number indicates the average of the fluorescence signal intensity for the specific gene as determined by microarray meta-analysis.

References

    1. Anand D, Lachke SA. 2017. Systems biology of lens development: a paradigm for disease gene discovery in the eye. Exp Eye Res. 156:22–33. - PMC - PubMed
    1. Beaty TH, Marazita ML, Leslie EJ. 2016. Genetic factors influencing risk to orofacial clefts: today’s challenges and tomorrow’s opportunities. F1000Res. 5:2800. - PMC - PubMed
    1. Beaty TH, Murray JC, Marazita ML, Munger RG, Ruczinski I, Hetmanski JB, Liang KY, Wu T, Murray T, Fallin MD, et al. 2010. A genome-wide association study of cleft lip with and without cleft palate identifies risk variants near MAFB and ABCA4. Nat Genet. 42(6):525–529. - PMC - PubMed
    1. Birnbaum S, Ludwig KU, Reutter H, Herms S, Steffens M, Rubini M, Baluardo C, Ferrian M, de Assis NA, Alblas MA. 2009. Key susceptibility locus for nonsyndromic cleft lip with or without cleft palate on chromosome 8q24. Nat Genet. 41(4):473–477. - PubMed
    1. Burdi AR, Silvey RG. 1969. Sexual differences in closure of the human palatal shelves. Cleft Palate J. 6:1–7. - PubMed

Publication types