

Simultaneous measurement of tadehaginoside and its principal metabolite in rats by HPLC-MS/MS and its application in pharmacokinetics and tissue distribution study
- PMID: 34689683
- PMCID: PMC8547841
- DOI: 10.1080/13880209.2021.1990354
Simultaneous measurement of tadehaginoside and its principal metabolite in rats by HPLC-MS/MS and its application in pharmacokinetics and tissue distribution study
Abstract
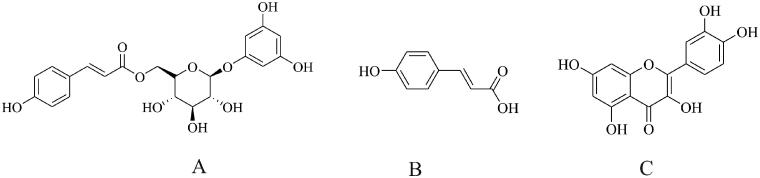
Context: Tadehaginoside, an active ingredient isolated from Tadehagi triquetrum (Linn.) Ohashi (Leguminosae), exhibited various biological activities. However, the pharmacokinetics and tissue distribution which affect tadehaginoside's therapeutic actions and application remain elusive.
Objective: To clarify the metabolism of tadehaginoside in vivo.
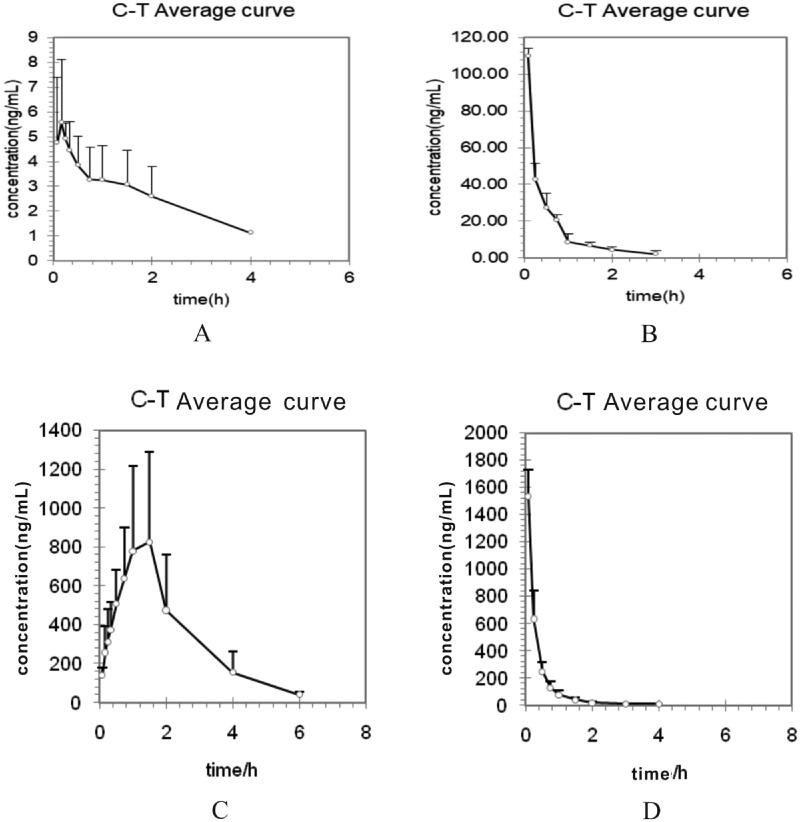
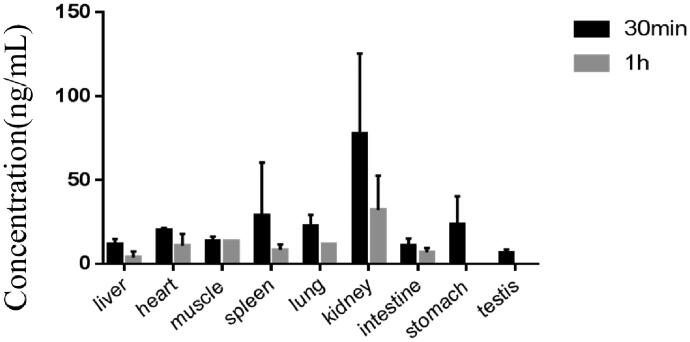
Materials and methods: The pharmacokinetics and tissue distribution of tadehaginoside and its metabolite p-hydroxycinnamic acid (HYD) were investigated using LC-MS/MS. Pharmacokinetic parameters were determined in 10 Sprague-Dawley rats divided into two groups, the intravenous group (5 mg/kg) and the oral group (25 mg/kg). For the tissue-distribution study, 20 rats were intravenously given tadehaginoside (5 mg/kg) before the experiment (n = 4). Biological samples were collected before drug administration (control group) and after drug administration.
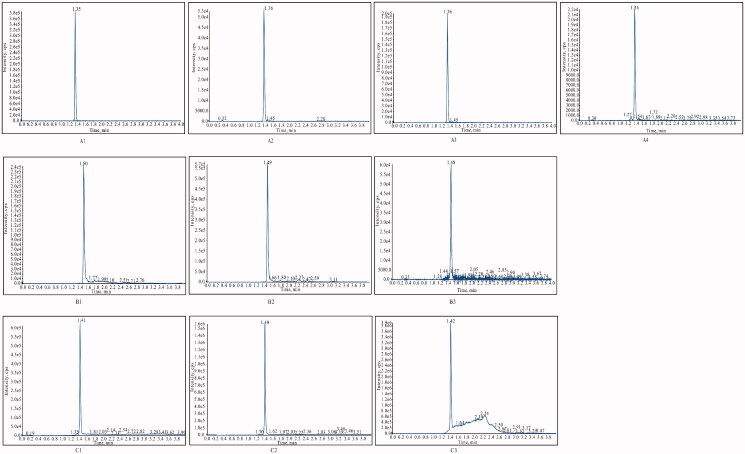
Results: The linearity, accuracy, precision, stability, recovery and matrix effect of the method were well-validated and the results satisfied the requirements of biological sample measurement. Treatment with tadehaginoside via intragastric and intravenous administration, the calculated Cmax in rats was 6.01 ± 2.14 ng/mL and 109.77 ± 4.29 ng/mL, and Tmax was 0.025 ± 0.08 h and 0.08 h, respectively. The results indicated that the quick absorption of tadehaginoside was observed following intravenous administration, and tadehaginoside in plasma of rats with intragastric administration showed relatively low concentration may be due to the formation of its metabolite. Tissue-distribution study indicated that kidney and spleen were the major distribution organs for tadehaginoside in rats and there was no long-term accumulation in most tissues.
Discussion and conclusion: These results could provide clues for exploring the bioactivity of tadehaginoside based on its pharmacokinetic characteristics.
Keywords: metabolic profile; method development and validation; p-Hydroxycinnamic.
Conflict of interest statement
No potential conflict of interest was reported by the author(s).
Figures
Similar articles
-
UPLC-MS/MS simultaneous determination of seven active ingredients of Yaobitong capsule in rat plasma and its integrated pharmacokinetic application.Biomed Chromatogr. 2020 Sep;34(9):e4866. doi: 10.1002/bmc.4866. Epub 2020 Jun 17. Biomed Chromatogr. 2020. PMID: 32330998
-
Evaluation of pharmacokinetics, bioavailability and urinary excretion of scopolin and its metabolite scopoletin in Sprague Dawley rats by liquid chromatography-tandem mass spectrometry.Biomed Chromatogr. 2019 Dec;33(12):e4678. doi: 10.1002/bmc.4678. Epub 2019 Sep 8. Biomed Chromatogr. 2019. PMID: 31412148
-
Tissue distribution profiles of multiple major bioactive components in rats after intravenous administration of Xuebijing injection by UHPLC-Q-Orbitrap HRMS.Biomed Chromatogr. 2019 Feb;33(2):e4400. doi: 10.1002/bmc.4400. Epub 2018 Oct 25. Biomed Chromatogr. 2019. PMID: 30255561
-
Plasma pharmacokinetics and tissue distribution study of roemerine in rats by liquid chromatography with tandem mass spectrometry (LC-MS/MS).J Chromatogr B Analyt Technol Biomed Life Sci. 2014 Oct 15;969:249-55. doi: 10.1016/j.jchromb.2014.08.031. Epub 2014 Aug 28. J Chromatogr B Analyt Technol Biomed Life Sci. 2014. PMID: 25195027
-
UHPLC-MS simultaneous determination and pharmacokinetic study of three aromatic acids and one monoterpene in rat plasma after oral administration of Shaofu Zhuyu decoction.Am J Chin Med. 2013;41(3):697-715. doi: 10.1142/S0192415X13500481. Am J Chin Med. 2013. PMID: 23711150
Cited by
-
A Natural Small Molecule Mitigates Kidney Fibrosis by Targeting Cdc42-mediated GSK-3β/β-catenin Signaling.Adv Sci (Weinh). 2024 Apr;11(13):e2307850. doi: 10.1002/advs.202307850. Epub 2024 Jan 19. Adv Sci (Weinh). 2024. PMID: 38240457 Free PMC article.
References
-
- Amalan V, Vijayakumar N, Indumathi D, Ramakrishnan A.. 2016. Antidiabetic and antihyperlipidemic activity of p-coumaric acid in diabetic rats, role of pancreatic GLUT 2: in vivo approach. Biomed Pharmacother. 84:230–236. - PubMed
-
- Azuma K, Ippoushi K, Nakayama M, Ito H, Higashio H, Terao J.. 2000. Absorption of chlorogenic acid and caffeic acid in rats after oral administration. J Agric Food Chem. 48(11):5496–5500. - PubMed
-
- Bhateria M, Ramakrishna R, Puttrevu SK, Yerrabelli S, Saxena AK, Bhatta RS.. 2016. Pre-clinical investigation of plasma pharmacokinetics and biodistribution of a novel antithrombotic agent S002-333 in mice using LC-MS/MS. J Chromatogr B Analyt Technol Biomed Life Sci. 1031:154–162. - PubMed
-
- Chamberlain CA, Rubio VY, Garrett TJ.. 2019. Impact of matrix effects and ionization efficiency in non-quantitative untargeted metabolomics. Metabolomics. 15(10):1–9. - PubMed
Publication types
MeSH terms
Substances
LinkOut - more resources
Full Text Sources