. 2022 Jun;18(6):1367-1384.
doi: 10.1080/15548627.2021.1985257. Epub 2021 Oct 25.

Muscle-generated BDNF (brain derived neurotrophic factor) maintains mitochondrial quality control in female mice

Affiliations

Muscle-generated BDNF (brain derived neurotrophic factor) maintains mitochondrial quality control in female mice

Palak Ahuja et al. Autophagy. 2022 Jun.

Abstract

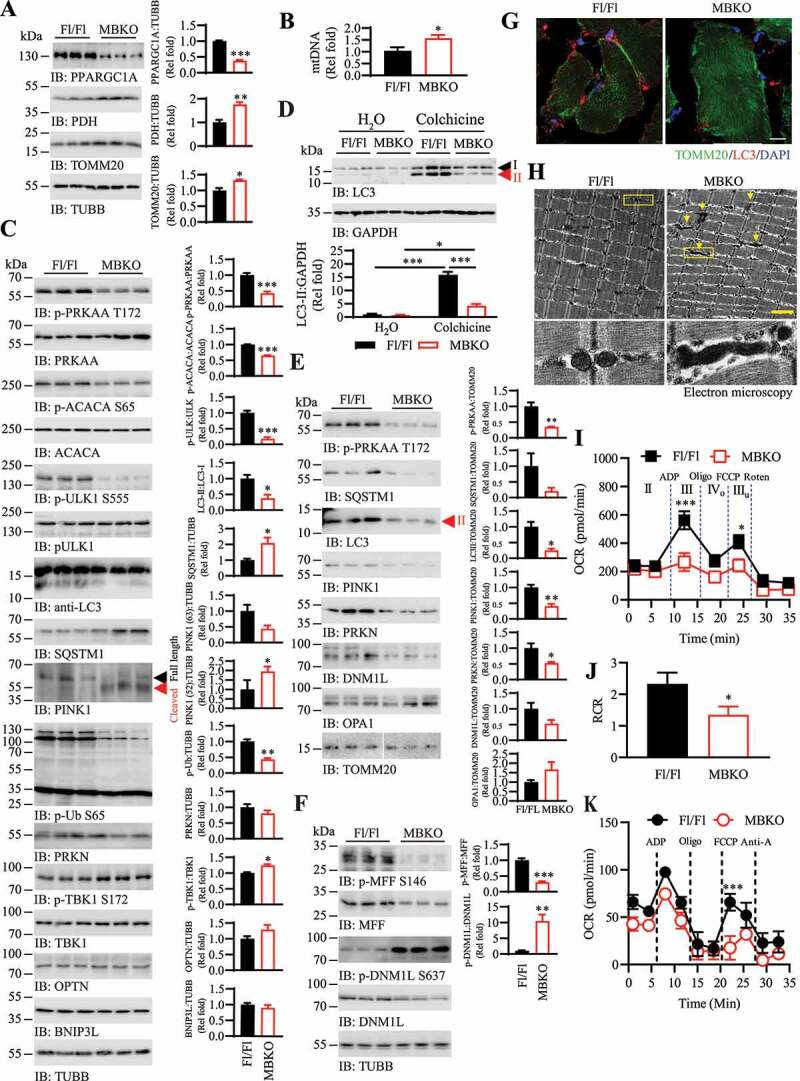
Mitochondrial remodeling is dysregulated in metabolic diseases but the underlying mechanism is not fully understood. We report here that BDNF (brain derived neurotrophic factor) provokes mitochondrial fission and clearance in skeletal muscle via the PRKAA/AMPK-PINK1-PRKN/Parkin and PRKAA-DNM1L/DRP1-MFF pathways. Depleting Bdnf expression in myotubes reduced fatty acid-induced mitofission and mitophagy, which was associated with mitochondrial elongation and impaired lipid handling. Muscle-specific bdnf knockout (MBKO) mice displayed defective mitofission and mitophagy, and accumulation of dysfunctional mitochondria in the muscle when they were fed with a high-fat diet (HFD). These animals also have exacerbated body weight gain, increased intramyocellular lipid deposition, reduced energy expenditure, poor metabolic flexibility, and more insulin resistance. In contrast, consuming a BDNF mimetic (7,8-dihydroxyflavone) increased mitochondrial content, and enhanced mitofission and mitophagy in the skeletal muscles. Hence, BDNF is an essential myokine to maintain mitochondrial quality and function, and its repression in obesity might contribute to impaired metabolism.Abbreviation: 7,8-DHF: 7,8-dihydroxyflavone; ACACA/ACC: acetyl Coenzyme A carboxylase alpha; ACAD: acyl-Coenzyme A dehydrogenase family; ACADVL: acyl-Coenzyme A dehydrogenase, very long chain; ACOT: acyl-CoA thioesterase; CAMKK2: calcium/calmodulin-dependent protein kinase kinase 2, beta; BDNF: brain derived neurotrophic factor; BNIP3: BCL2/adenovirus E1B interacting protein 3; BNIP3L/NIX: BCL2/adenovirus E1B interacting protein 3-like; CCL2/MCP-1: chemokine (C-C motif) ligand 2; CCL5: chemokine (C-C motif) ligand 5; CNS: central nervous system; CPT1B: carnitine palmitoyltransferase 1b, muscle; Cpt2: carnitine palmitoyltransferase 2; CREB: cAMP responsive element binding protein; DNM1L/DRP1: dynamin 1-like; E2: estrogen; EHHADH: enoyl-CoenzymeA hydratase/3-hydroxyacyl CoenzymeA dehydrogenase; ESR1/ER-alpha: estrogen receptor 1 (alpha); FA: fatty acid; FAO: fatty acid oxidation; FCCP: carbonyl cyanide-4-(trifluoromethoxy)phenylhydrazone; FFA: free fatty acids; FGF21: fibroblast growth factor 21; FUNDC1: FUN14 domain containing 1; HADHA: hydroxyacyl-CoA dehydrogenase trifunctional multienzyme complex subunit alpha; HFD: high-fat diet; iWAT: inguinal white adipose tissues; MAP1LC3A/LC3A: microtubule-associated protein 1 light chain 3 alpha; MBKO; muscle-specific bdnf knockout; IL6/IL-6: interleukin 6; MCEE: methylmalonyl CoA epimerase; MFF: mitochondrial fission factor; NTRK2/TRKB: neurotrophic tyrosine kinase, receptor, type 2; OPTN: optineurin; PA: palmitic acid; PARL: presenilin associated, rhomboid-like; PDH: pyruvate dehydrogenase; PINK1: PTEN induced putative kinase 1; PPARGC1A/PGC-1α: peroxisome proliferative activated receptor, gamma, coactivator 1 alpha; PRKAA/AMPK: protein kinase, AMP-activated, alpha 2 catalytic subunit; ROS: reactive oxygen species; TBK1: TANK-binding kinase 1; TG: triacylglycerides; TNF/TNFα: tumor necrosis factor; TOMM20: translocase of outer mitochondrial membrane 20; ULK1: unc-51 like kinase 1.

Keywords: BDNF; mitochondria; mitophagy; muscle; obesity.


Conflict of interest statement

The authors declare that they have no competing interests.

Figures

Figure 1.
Figure 1.
Obesity suppresses Bdnf expression in gastrocnemius muscle. (A) Tissue expression of Bdnf in HFD-fed C57BL/6 J mice was determined by real-time PCR (*: P < 0.05, **: P < 0.01, Student’s t-test, n = 5). (B) Cellular content of BDNF in gastrocnemius muscle of female C57BL/6 J mice fed with chow or HFD for 3 months. Immunoblot quantifications were shown in the right panel (*: P < 0.05, **, P < 0.01, Student’s t-test, n = 3). (C) Bdnf expression in palmitic acid (PA)-stimulated C2C12 myotubes as determined by real-time PCR (***: P < 0.001 vs control, One-way ANOVA, n = 3). (D) Western blot of BDNF content in PA-stimulated C2C12 myotubes.
Figure 2.
Figure 2.
MBKO mice are prone to diet-induced obesity. (A) Body weight of female Fl/Fl and MBKO mice fed with HFD (*: P < 0.05, two-way ANOVA, n = 10). (B) Organ weight of female Fl/Fl and MBKO mice that have been fed with HFD for 14 weeks (**: P < 0.05, Student’s t-test, n = 5–8). (C) Representative adipocyte morphology in the iWAT of female Fl/Fl and MBKO mice that have been fed with HFD for 14 weeks (scale bars: 50 µm). The adipocyte size was quantified and shown in the right panel (*: P < 0.05, Student’s t-test, n = 5). (D) Heat map of circulating adipokine female Fl/Fl and MBKO mice fed with HFD (14 weeks) (*: P < 0.05, **:P < 0.01, Student’s t-test, n = 4). (E) Circulating triacylglyceride (TG) and free fatty acid (FFA) levels in HFD (14 weeks)-fed female Fl/Fl and MBKO mice (*: P < 0.05, Student’s t-test n = 4). (F) Lipid contents in gastrocnemius and soleus muscles of female Fl/Fl and MBKO mice that have been fed with HFD for 14 weeks (*: P < 0.05, **: P < 0.01, Student’s t-test n = 5). (G) Gene expression in gastrocnemius muscle of HFD (14 weeks)-fed female mice as determined by real-time PCR (*: P < 0.05, **: P < 0.01, Student’s t-test, n = 4). (H) The amount of FAO enzymes in the gastrocnemius muscle of HFD-fed female Fl/Fl and MBKO mice was determined by immunoblotting. Quantifications of the immunoblot were shown in the right panels (*: P < 0.05, Student’s t-test, n = 3).
Figure 3.
Figure 3.
Impaired energy metabolism in HFD-fed MBKO mice. Indirect calorimetry values of (A) oxygen consumption, (B) CO2 production, (C) energy expenditure (EE), (D) physical activity, (E) total food intake and respiratory exchange ratio (F) (RER) of female Fl/Fl and MBKO mice fed with HFD for 14 weeks. The gray area represents nighttime (7 pm to 6 am). The average value of the parameter measured in each period was presented (*: P < 0.05, **: P < 0.01, ***: P < 0.001, two-way ANOVA, n = 6). The area under curve (AUC) of each graph was shown in the right panel of the sub-figure (*: P < 0.05, **: P < 0.01, Student’s t-test, n = 6).
Figure 4.
Figure 4.
Defective mitochondrial remodeling and accumulation of dysfunctional mitochondrial in the skeletal muscle of MBKO mice. (A) Mitochondrial biogenesis in gastrocnemius muscle of HFD (14 weeks)-fed female Fl/Fl and MBKO mice was examined by immunoblotting. Immunoblot quantifications were shown in the right panel (*: P < 0.01, **: P < 0.01, ***: P < 0.001, Student’s t-test). (B) Mitochondrial DNA content in the gastrocnemius muscle of HFD-fed (14 weeks) female Fl/Fl and MBKO mice as determined by real-time PCR (*: P < 0.01, Student’s t-test, n = 5). (C) Autophagy and mitophagy signaling in gastrocnemius muscle of HFD (14 weeks)-fed female Fl/Fl and MBKO mice as analyzed by western blot. Immunoblot quantifications were shown in the right panel (*: P < 0.05, **: P < 0.01, ***: P < 0.001, Student’s t-test, n = 3). (D) Colchicine-induced LC3-II accumulation in the gastrocnemius muscle of HFD (14 weeks)-fed female Fl/Fl and MBKO mice were determined by western blotting. Quantifications of the immunoblot were shown in the lower panel (*: P < 0.05, ***: P < 0.001, two-way ANOVA, n = 3). (E) Immunoblots of protein contents in mitochondria isolated from gastrocnemius muscle of HFD (14 weeks)-fed female Fl/Fl and MBKO mice. Immunoblot quantifications were shown in the right panel (*: P < 0.05, **: P < 0.01, Student’s t-test, n = 3). (F) Immunoblotting analysis of mitofission signaling in gastrocnemius muscle of HFD (14 weeks)-fed female Fl/Fl and MBKO mice. Immunoblot quantifications were shown in the right panel (**: P < 0.01, ***;: P < 0.01, Student’s t-test, n = 3). (G) Representative immunofluorescence staining of TOMM20 and LC3 in the gastrocnemius muscle of HFD (14 weeks)-fed Fl/Fl and MBKO mice (scale bar: 10 µm). (H) Representative transmission electron microscopy images showing the mitochondrial morphology in the gastrocnemius muscle of HFD (14 weeks)-fed female Fl/Fl and MBKO mice (scale bar: 2 µm). Elongated mitochondria are indicated by the arrows. The mitochondria in the yellow boxes were magnified and shown in the lower panels. (I) Ex vivo respiration of mitochondria isolated from HFD (14 weeks)-fed female Fl/Fl and MBKO mice (*: P < 0.05, ***: P < 0.01, two-way ANOVA, n = 11). Additions of ADP, oligomycin (Oligo), carbonylcyanide-4-(trifluoromethoxy)-phenylhydrazone (FCCP), and rotenone (Roten) was indicated by dash lines. (J) Respiratory control ratio (RCR) of mitochondria isolated from HFD (14 weeks)-fed female Fl/Fl and MBKO mice (*: P < 0.05, Student’s t-test, n = 11). (K) Respiration of mitochondria isolated from the gastrocnemius muscle of HFD (14 weeks)-fed female Fl/Fl and MBKO mice using palmitoyl carnitine/malate as the substrate. Additions of ADP, Oligo, FCCP, and antimycin A (Anti-A) were indicated by dash lines (***: P < 0.01, two-way ANOVA, n = 6).
Figure 5.
Figure 5.
Diet-induced insulin resistance in MBKO mice. (A) Blood glucose level in HFD-fed (14 weeks) female Fl/Fl and MBKO mice that have been fed with HFD (*: P < 0.05, two-way ANOVA, n = 6). (B) Glucose tolerance test of female Fl/Fl and MBKO mice that have been fed with HFD for 14 weeks (n = 6–8). The area under curve (AUC) for the GTT was shown in the right panel (*: P < 0.05, Student’s t-test, n = 6–8). (C) Circulating insulin levels in female Fl/Fl and MBKO mice that have been fed with HFD for 14 weeks (*: P < 0.05, two-way ANOVA, n = 5–7). (D) Insulin tolerance test of female Fl/Fl and MBKO mice that have been fed with HFD for 14 weeks (n = 5–6). Area under curve (AUC) for the ITT was also shown (*: P < 0.05, Student’s t-test, n = 5–6). (E) Glucose infusion rate of HFD (14 weeks)-fed female Fl/Fl and MBKO mice during hyperinsulinemic-euglycemic clamping (*: P < 0.05, Student’s t-test, n = 5–7). (F) Whole-body glucose turnover in HFD (14 weeks)-fed female Fl/Fl and MBKO mice during hyperinsulinemic-euglycemic clamping (*: P < 0.05, Student’s t-test, n = 5–7). (G) Insulin-stimulated glucose uptake by gastrocnemius muscle of HFD (14 weeks)-fed female Fl/Fl and MBKO mice during hyperinsulinemic-euglycemic clamping (*: P < 0.05, Student’s t-test, n = 5–7). (H) Insulin-stimulated glucose uptake by iWAT of HFD (14 weeks)-fed female Fl/Fl and MBKO mice during hyperinsulinemic-euglycemic clamping (n = 5–7). (I) Hepatic glucose production in HFD (14 weeks)-fed female Fl/Fl and MBKO mice during hyperinsulinemic-euglycemic clamping (n = 5–7). (J) Insulin-stimulated signaling in gastrocnemius muscle isolated from female Fl/Fl and MBKO mice that have been fed with HFD for 14 weeks. Immunoblot quantifications were shown in the right panels (**: P < 0.01, Student’s t-test, n = 3).
Figure 6.
Figure 6.
BDNF promotes mitochondrial fission and mitophagy via PRKAA/AMPK activation. (A) C2C12 cells were stimulated with BDNF (100 ng/ml) for various time intervals, and the cytosolic and mitochondrial proteins were separated. The protein contents in each fraction were analyzed by immunoblotting. An equal amount of proteins (5 µg) was loaded to compare the protein distribution in each fractionated sample. (B) Subcellular fractionation was performed in differentiated C2C12 myotubes after stimulation with BDNF (100 ng/ml). Various proteins in the cytosolic and mitochondrial fractions were analyzed by immunoblotting. (C) C2C12 myotubes were pre-treated with various inhibitors (20 nM K252a, 20 µM Compound C, 10 µM PD98059) for 1 h, following by BDNF stimulation (100 ng/ml) for 6 h. The mitochondria and cytosol were then isolated for immunoblotting analysis. (D) C2C12 myotubes were infected with control adenovirus (Ad-Ctr) or adenovirus expressing shRNA against Bdnf (Ad-shBDNF) for 48 h. Proteins in the mitochondrial and cytosolic fractions were then isolated for immunoblotting analysis. (E) C2C12 myotubes were infected with various adenoviruses for 48 h, followed by BSA-conjugated PA stimulation for 24 h. Cell fractionation was then performed and the amounts of various proteins in the cytosolic and mitochondrial fractions were determined by western blot. (F) Representative immunofluorescence staining of Ad-Ctr or Ad-shBDNF-infected C2C12 myotubes with or without PA (600 µM, 6 h) treatment (scale bar: 15 µm). Pictures in the middle panel are the magnified view of the defined area (yellow square) on the left panels. Mitochondria morphology in the magnified area was highlighted by the computer program MicroP as shown in the right panel. (G) Oxygen consumption rate (OCR) of C2C12 myotubes that have been infected with various adenoviruses (48 h) followed by PA stimulation (600 µM) for 6 h. Additions of oligomycin (oligo, 1 µM), FCCP (1 µM), or antimycin A (AntiA, 1 µM) + rotenone (Roten, 1 µM) were indicated by arrows (n = 4). (H) Mitochondrial activities in Ad-Ctr or Ad-shBDNF-infected C2C12 myotubes after PA (600 µM, 6 h) stimulation (*: P < 0.05, two-way ANOVA, n = 4).
Figure 7.
Figure 7.
BDNF activates PRKAA via CAMKK2. (A) Representative images of Fluro-4-loaded C2C12 myotubes after BDNF (100 ng/ml) stimulation. Scale bar: 100 µm. (B) Time course study of [Ca2+]i elevation in C2C12 myotubes stimulated with BDNF (100 ng/ml. The dashed line indicates the time when BDNF was introduced (n = 3, ***: P < 0.001 vs PBS after BDNF administration for all time points, two-way ANOVA). (C) The [Ca2+]i was measured in Fluro-4-loaded C2C12 myotubes after being stimulated by various concentrations of BDNF for 30 min (n = 3, ***: P < 0.001, one-way ANOVA vs 0). (D) C2C12 myotubes were pretreated with DMSO, BAPTA-AM (50 µM), K252a (100 nM), STO-609 (10 µg/ml), U73122 (3 µM), or wortmannin (1 µM) for 1 h, followed by PBS or BDNF stimulation (100 ng/ml, 30 min). PRKAA T172 phosphorylation was determined by ELISA (n = 6, *: P < 0.05 vs control, b: P < 0.01 vs BDNF, c: P < 0.001 vs BDNF, one-way ANOVA). (E) Control siRNA (siCtr) or siRNA against Camkk2 (siCAMKK2) was introduced to C2C12 cells by transfection. Expression of Camkk2 in Control siRNA (siCtr) or siRNA against Camkk2 (siCAMKK2) was assessed by real-time PCR (top panel, ***: P < 0.001, Student’s t-test, n = 4). The amount of cellular CAMKK2 after siRNA treatment was determined by immunoblotting (middle panel). (F) The siCtr- or siCAMKK2-treated C2C12 cells were stimulated with PBS or BDNF (100 ng/ml, 30 min). PRKAA T172 phosphorylation was determined by ELISA (n = 6, ***: P < 0.001 vs PBS, c: P < 0.001 vs BDNF, two-way ANOVA).
Figure 8.
Figure 8.
7,8-DHF consumption enhances mitophagy and mitofission in diet-induced obese mice. (A) Effect of 7,8-DHF consumption on body weight gain in female diet-induced obese (DIO) mice (*: P < 0.05, two-way ANOVA, n = 5). (B) Western blot analysis of proteins in gastrocnemius muscle of female DIO mice that have been fed with 7,8-DHF for 8 weeks. Immunoblot quantifications were shown in the right panel (*: P < 0.01, **: P < 0.05, Student’s t-test, n = 3). (C) Mitophagy signaling in gastrocnemius muscle of female 7,8-DHF-administrated (8 weeks) DIO mice was analyzed by western blot. Immunoblot quantifications were shown in the right panel (*: P < 0.05, **: P < 0.01, Student’s t-test, n = 3). (D) Colchicine-induced LC3-II accumulation in the gastrocnemius muscle of H2O- or 7,8-DHF-treated DIO mice was determined by western blotting. Quantifications of the immunoblot were shown in the right panel (*: P < 0.05, **: P < 0.01, two-way ANOVA, n = 3). (E) Immunoblotting analysis of mitofission and mitofusion signaling in gastrocnemius muscle of female DIO mice that have been fed with 7,8-DHF for 8 weeks. Immunoblot quantifications were shown in the right panel (*: P < 0.05, Student’s t-test, n = 3). (F) C2C12 myotubes were stimulated with 7,8-DHF (24 h) and the cytosolic and mitochondrial proteins were separated. The proteins in each fraction were analyzed by immunoblotting. An equal amount of proteins (5 µg) was loaded to compare the protein distribution in each fractionated sample. (G) Subcellular fractionation was performed in differentiated C2C12 myotubes after stimulation with 7,8-DHF for 24 h. Various proteins in the cytosolic and mitochondrial fractions were then analyzed by immunoblotting.

References

    1. Mishra P, Chan DC.. Metabolic regulation of mitochondrial dynamics. J Cell Biol. 2016;212(4):379–387. - PMC - PubMed
    1. Bhatti JS, Bhatti GK, Reddy PH. Mitochondrial dysfunction and oxidative stress in metabolic disorders - A step towards mitochondria based therapeutic strategies. Biochim Biophys Acta Mol Basis Dis. 2017;1863:1066–1077. - PMC - PubMed
    1. Palikaras K, Lionaki E, Tavernarakis N. Mechanisms of mitophagy in cellular homeostasis, physiology and pathology. Nat Cell Biol. 2018;20(9):1013–1022. - PubMed
    1. Narendra DP, Jin SM, Tanaka A, et al. PINK1 is selectively stabilized on impaired mitochondria to activate Parkin. PLoS Biol. 2010;8(1):e1000298. - PMC - PubMed
    1. Kondapalli C, Kazlauskaite A, Zhang N, et al. PINK1 is activated by mitochondrial membrane potential depolarization and stimulates Parkin E3 ligase activity by phosphorylating Serine 65. Open Biol. 2012;2(5):120080. - PMC - PubMed

Publication types