. 2021 Oct 24;19(1):338.
doi: 10.1186/s12951-021-01084-z.

Targeted theranostic photoactivation on atherosclerosis

Affiliations

Targeted theranostic photoactivation on atherosclerosis

Joon Woo Song et al. J Nanobiotechnology. .

Abstract

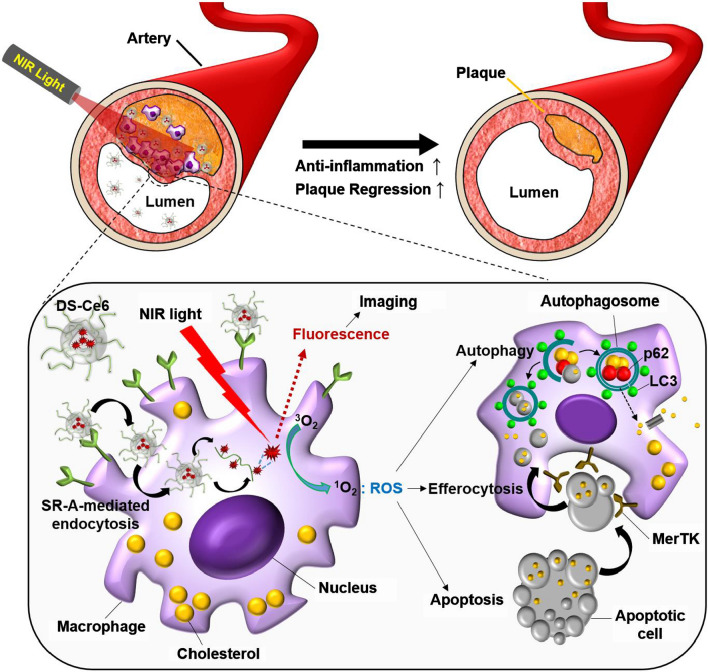
Background: Photoactivation targeting macrophages has emerged as a therapeutic strategy for atherosclerosis, but limited targetable ability of photosensitizers to the lesions hinders its applications. Moreover, the molecular mechanistic insight to its phototherapeutic effects on atheroma is still lacking. Herein, we developed a macrophage targetable near-infrared fluorescence (NIRF) emitting phototheranostic agent by conjugating dextran sulfate (DS) to chlorin e6 (Ce6) and estimated its phototherapeutic feasibility in murine atheroma. Also, the phototherapeutic mechanisms of DS-Ce6 on atherosclerosis were investigated.

Results: The phototheranostic agent DS-Ce6 efficiently internalized into the activated macrophages and foam cells via scavenger receptor-A (SR-A) mediated endocytosis. Customized serial optical imaging-guided photoactivation of DS-Ce6 by light illumination reduced both atheroma burden and inflammation in murine models. Immuno-fluorescence and -histochemical analyses revealed that the photoactivation of DS-Ce6 produced a prominent increase in macrophage-associated apoptotic bodies 1 week after laser irradiation and induced autophagy with Mer tyrosine-protein kinase expression as early as day 1, indicative of an enhanced efferocytosis in atheroma.

Conclusion: Imaging-guided DS-Ce6 photoactivation was able to in vivo detect inflammatory activity in atheroma as well as to simultaneously reduce both plaque burden and inflammation by harmonic contribution of apoptosis, autophagy, and lesional efferocytosis. These results suggest that macrophage targetable phototheranostic nanoagents will be a promising theranostic strategy for high-risk atheroma.

Keywords: Atherosclerosis; Autophagy; Efferocytosis; Foam cells; Macrophage targetable phototheranostic agent; Photodynamic therapy.


Conflict of interest statement

The authors have no competing interests to declare.

Figures

Scheme 1.
Scheme 1.
Schematic overview of the macrophage SR-A targeted photoactivation for autophagy induction and efferocytosis enhancement to regress atherosclerosis. Macrophage-targetable phototheranostic agent DS-Ce6 internalizes into the plaque macrophages through SR-A-mediated endocytosis. Upon laser irradiation, DS-Ce6 emits NIRF and simultaneously produces ROS. The generated ROS activates autophagy and upregulates MerTK expression within foam cells, and then promotes the engulfment of photoactivation-induced apoptotic cells. Macrophage-targeted photoactivation reduces inflammatory activity and results in plaque regression
Fig. 1
Fig. 1
Synthesis and characteristics of macrophage SR-A-targetable DS-Ce6. a Chemical structure and synthetic procedure of DS-Ce6. Amphiphilic DS-Ce6 formed self-assembled nanostructure in aqueous environment. b Size distribution of DS-Ce6 in aqueous condition. Inset: TEM image of DS-Ce6. Scale bar = 100 nm. c Stability test of DS-Ce6 in PBS and 10% FBS as a function of time. de UV/Vis absorption d and fluorescence spectra e of Ce6 (PBS with 1% Tween 20) and DS-Ce6 (PBS only or PBS with 1% Tween 20). Inset: fluorescence images of (1) free Ce6 (PBS with 1% Tween 20), (2) DS-Ce6 (PBS) and (3) DS-Ce6 (PBS with 1% Tween 20). f Fluorescence intensity of SOSG of Ce6 (PBS with 1% Tween 20) and DS-Ce6 (PBS only or PBS with 1% Tween 20) as a function of the laser irradiation time
Fig. 2
Fig. 2
Cellular uptake of DS-Ce6 and induction of apoptotic cell death and autophagy flux by photoactivation. a Immunofluorescence staining of SR-A on macrophages, LPS-activated macrophages, and foam cells. The activated macrophages and foam cells were strongly positive for SR-A (green) compared to the control cells. Blue: nucleus stained with DAPI. Scale bar = 50 μm. b Western blot analysis of the protein expression of SR-A in control macrophages, activated macrophages, and foam cells. Quantification of SR-A normalized to cofilin, presented as fold change over controls. c Dose-dependent cellular uptake of DS-Ce6 in the foam cells. Scale bar = 30 μm. *P < 0.05, ***P < 0.001. d Comparison of the intracellular uptake of free Ce6 (5 μM) and DS-Ce6 (equiv. 5 μM Ce6) in foam cells. To evaluate receptor-mediated endocytosis, the SR-A ligand DS was pre-treated for 1 h before DS-Ce6 incubation (DS + DS-Ce6). Scale bar = 50 μm. e, f Cell viability of the foam cells treated with different concentrations of DS-Ce6, DS, and Ce6 without e and with laser irradiation f (670 nm, 50 mW). ***P < 0.001. g In vitro phototoxicity of DS-Ce6 in endothelial cells (ECs), smooth muscle cells (SMCs), and macrophages treated with LPS or LPS with LDL under laser irradiation. h Annexin V (green) and DAPI (blue)-stained images of foam cells treated with DS-Ce6 (equiv. 5 μM Ce6) after laser irradiation (670 nm, 50 mW). Scale bar = 50 μm. i Immunofluorescence staining of LC3 (green), p62 (red), and DAPI (blue) in foam cells treated with DS-Ce6 (equiv. 5 μM Ce6) after laser irradiation (670 nm, 50 mW). Scale bar = 25 μm. *P < 0.05, **P < 0.01, ***P < 0.001
Fig. 3
Fig. 3
In vivo optical imaging of DS-Ce6 in the carotid plaques of mice with atherosclerosis. a In vivo fluorescence imaging of BALB/c nude mice with intravenous injection of DS-Ce6 at different time points (n = 3). b Schematic diagram of the custom-built multi-channel IVFM. c Representative in vivo imaging of the carotid atheroma at 48 h after the intravenous injection of DS-Ce6 or free Ce6 (intravenous dose: equivalent of 2 mg/kg of Ce6). The fluorescence image in the Ce6 channel (red) demonstrates the DS-Ce6 uptake in a carotid plaque. The FITC angiogram (green) outlines the vasculature. Arrow indicates carotid bifurcation. Scale bar = 400 μm. d pTBR of the carotid atheroma that received the intravenous injection of DS-Ce6 according to the circulation time as assessed by IVFM imaging (n = 3 per group). ***P < 0.001 versus the pTBR1h. e pTBR comparison between the DS-Ce6 and free Ce6 injection groups. *P < 0.05. f Localization of DS-Ce6 to macrophage SR-A in a carotid atheroma. CLSM image of DS-Ce6 deposition (red) in an atheroma, with elastin autofluorescence (gray). IF staining of the SR-A, macrophages (Mac3), SMCs (α-SMA), and ECs (CD31). CLSM exhibits DS-Ce6 accumulation within the atheroma, which co-localizes with the macrophages and SR-A (white arrowhead). Scale bar = 100 μm
Fig. 4
Fig. 4
In vivo theranostic effects of DS-Ce6 photoactivation on plaque burden and inflammation. a In vivo study protocol of the IVFM-assisted photoactivation and serial imaging of the carotid plaques in the atherogenic mice. b Schematic illustration of our custom-built laser modulation system. Mode scrambling technique generates a homogeneous beam profile. c Representative serial in vivo plaque imaging at baseline and 1 week after laser irradiation in the DS-Ce6 photoactivation group. d Quantitative analysis of the plaque area, macrophage area, and pTBR before and after photoactivation. n = 7 mice, *P < 0.05, **P < 0.01. e In vivo optical imaging of the carotid plaques at baseline and 1-week follow-up in the control group administered with DS-Ce6 only. f Quantitative analysis in the DS-Ce6 only control group without laser irradiation. **P < 0.01. n = 5 mice. g-h Serial in vivo imaging of carotid atheroma (g), and quantitative analysis (h) in laser irradiation group without DS-Ce6 administration. n = 5 mice
Fig. 5
Fig. 5
Histological validation of the effects of DS-Ce6 photoactivation on plaque compositions. a Representative images of the H&E, ORO and PSR staining, and Mac3 and α-SMA IHC. Scale bar = 100 μm. b Quantitative analysis of the Mac3-, ORO, α-SMA-, and PSR-positive areas per plaque area. *P < 0.05
Fig. 6
Fig. 6
Autophagy activation and efferocytosis enhancement in advanced atheroma over time after photoactivation. a CLSM images of the double IF of autophagy marker LC3 (green) and p62 (red) at 1 day and 1 week after laser irradiation. Blue: nucleus stained with DAPI. Scale bar = 100 μm. b Quantification of the LC3- and p62-positive areas per plaque. **P < 0.01, ***P < 0.001. c IHC analysis of MerTK expression in the plaques of the DS-Ce6-photoactivated mice and controls. Scale bar = 100 μm. d Quantification of MerTK expression per plaque area. *P < 0.05. e Representative fluorescence micrographs of the carotid plaques double-stained with cleaved caspase-3 (red) and Mac3 (green). Scale bar = 100 μm. f Cleaved caspase-3 expression per plaque area and efferocytosis quantified as macrophage-associated (yellow arrows) versus macrophage-free apoptotic cells (white arrows) in the plaques after DS-Ce6 photoactivation. *P < 0.05. Tx treatment, macrophage, AC apoptotic cells

References

    1. Benjamin EJ, Muntner P, Alonso A, Bittencourt MS, Callaway CW, Carson AP, Chamberlain AM, Chang AR, Cheng S, Das SR, et al. Heart disease and stroke statistics-2019 update: a report from the American Heart Association. Circulation. 2019;139:e56–e528. - PubMed
    1. Ridker PM. Residual inflammatory risk: addressing the obverse side of the atherosclerosis prevention coin. Eur Heart J. 2016;37:1720–1722. - PubMed
    1. Bourantas CV, Jaffer FA, Gijsen FJ, van Soest G, Madden SP, Courtney BK, Fard AM, Tenekecioglu E, Zeng Y, van der Steen AFW, et al. Hybrid intravascular imaging: recent advances, technical considerations, and current applications in the study of plaque pathophysiology. Eur Heart J. 2017;38:400–412. - PMC - PubMed
    1. Libby P. Collagenases and cracks in the plaque. J Clin Invest. 2013;123:3201–3203. - PMC - PubMed
    1. Moore KJ, Tabas I. Macrophages in the pathogenesis of atherosclerosis. Cell. 2011;145:341–355. - PMC - PubMed

Substances