Review
. 2021 Nov;59(6):1027-1043.
doi: 10.1016/j.rcl.2021.07.010.

Clinical Artificial Intelligence Applications: Breast Imaging

Affiliations
Review

Clinical Artificial Intelligence Applications: Breast Imaging

Qiyuan Hu et al. Radiol Clin North Am. 2021 Nov.

Abstract

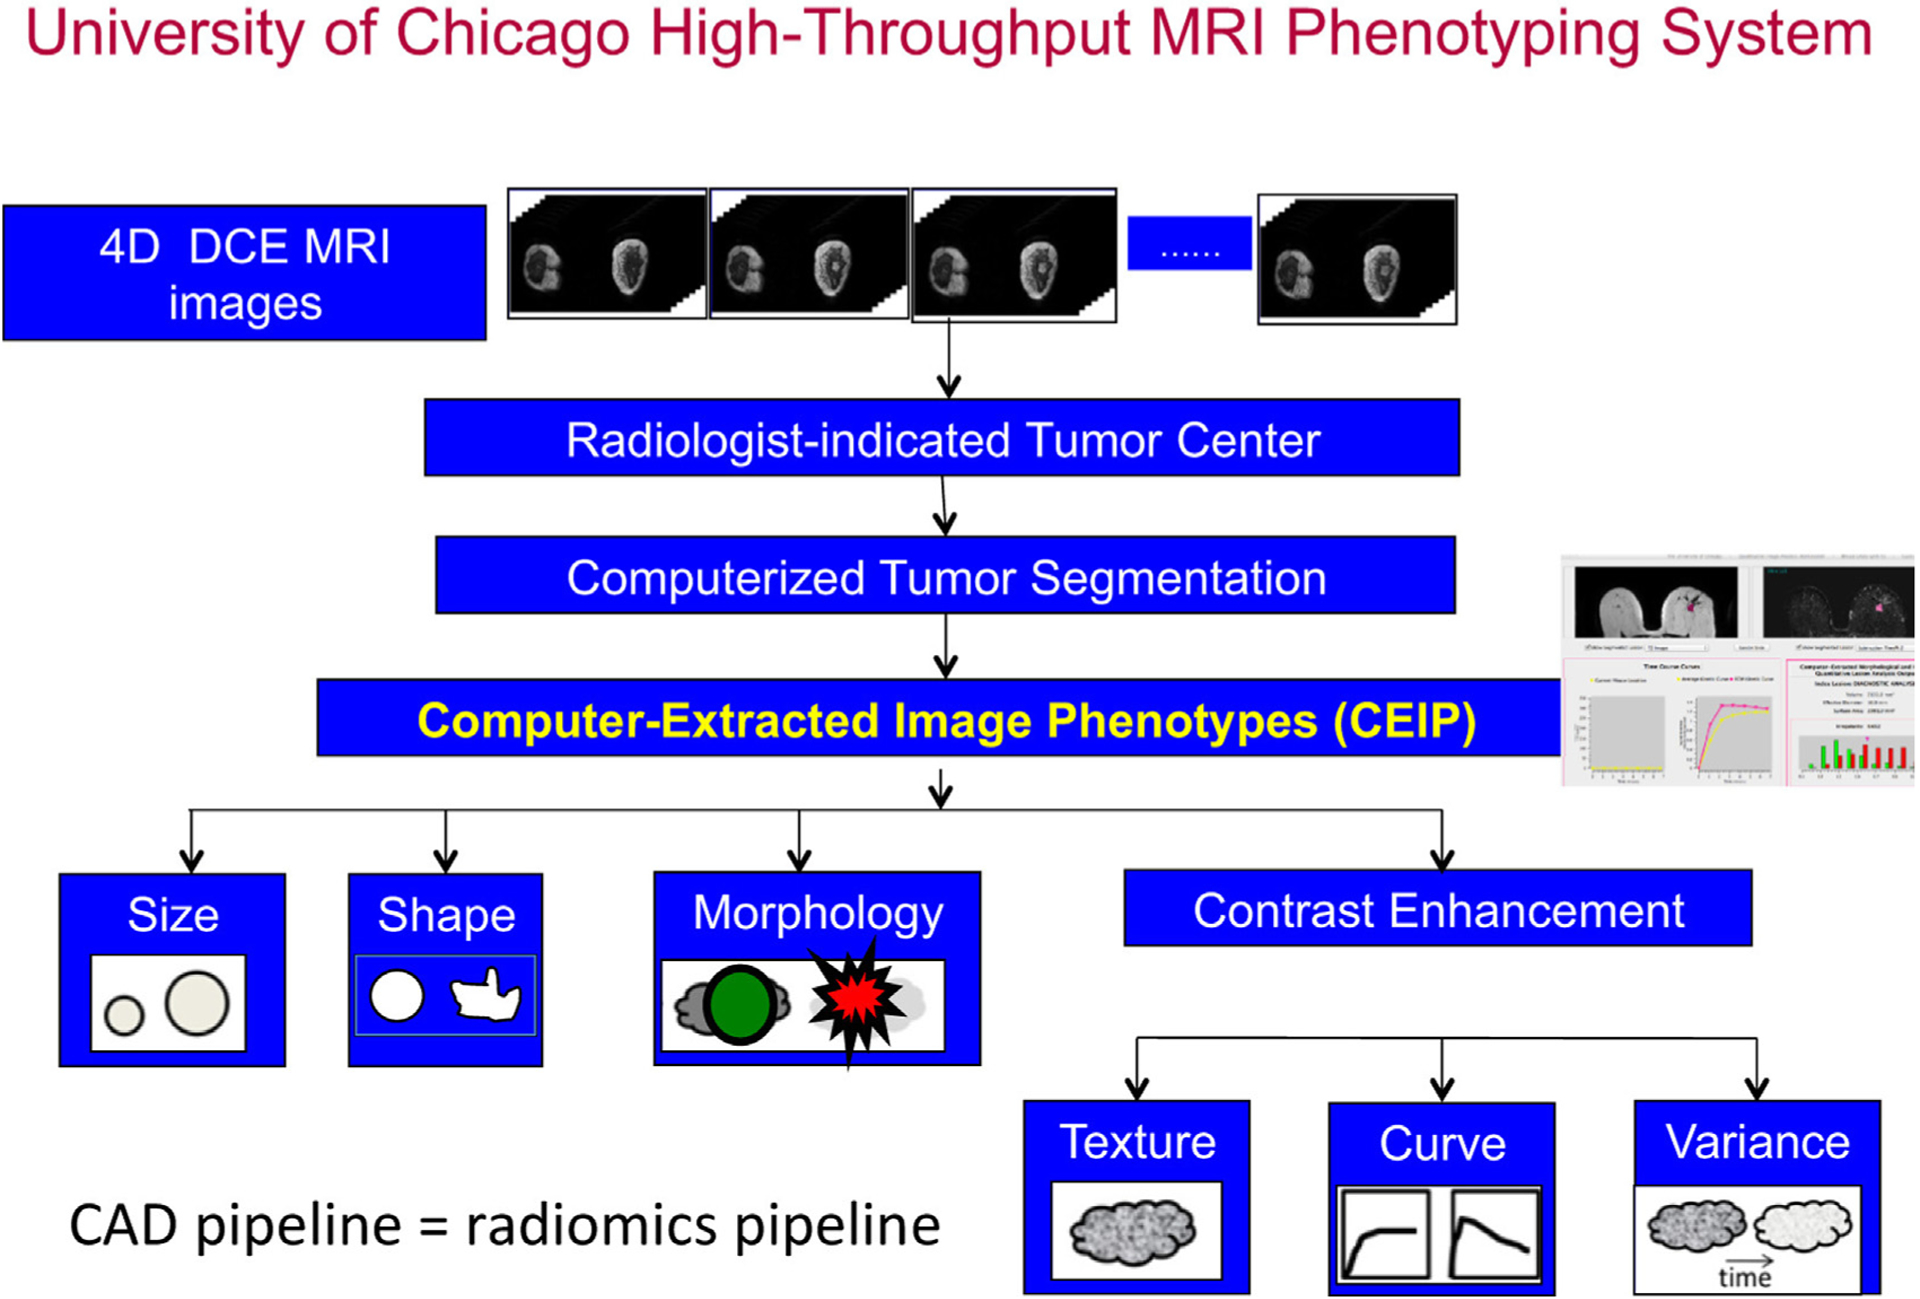
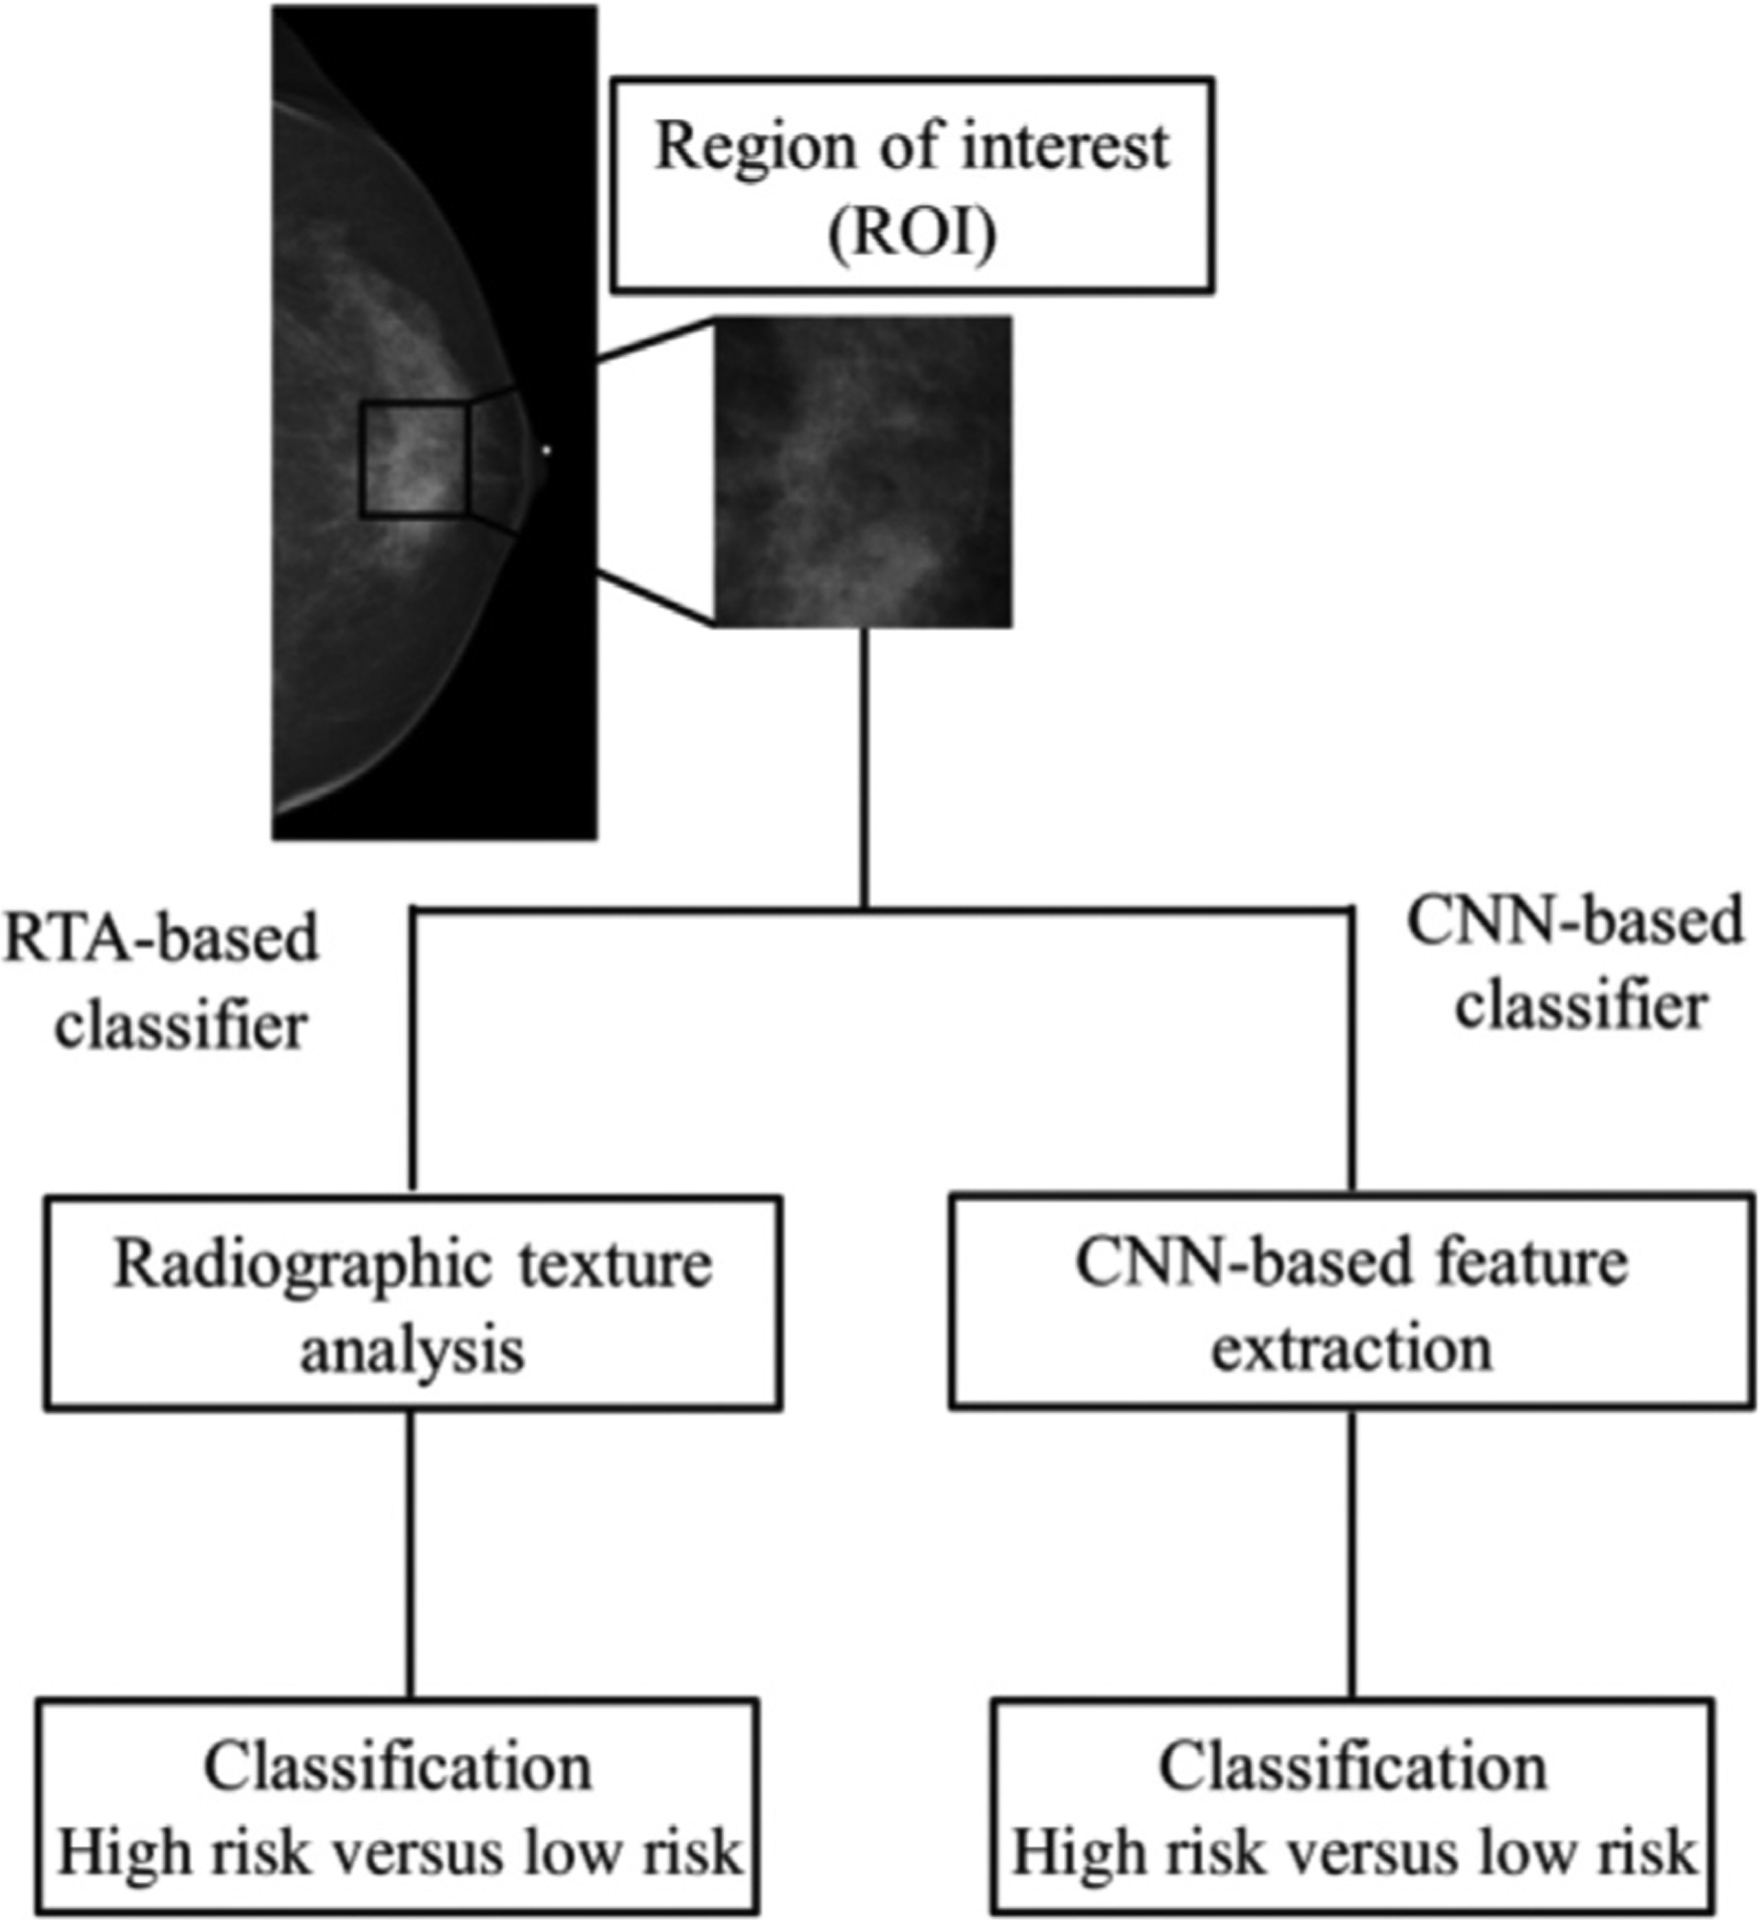
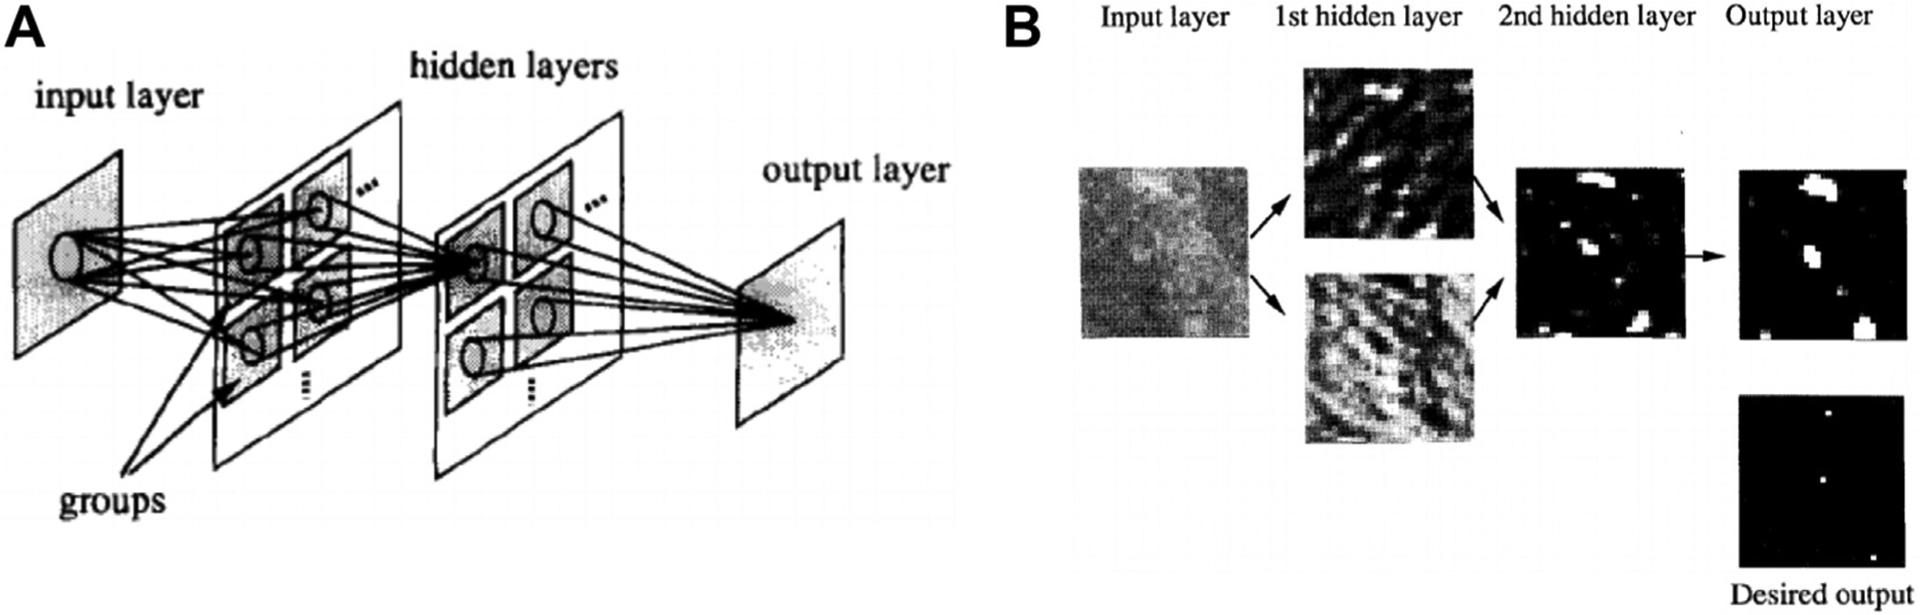
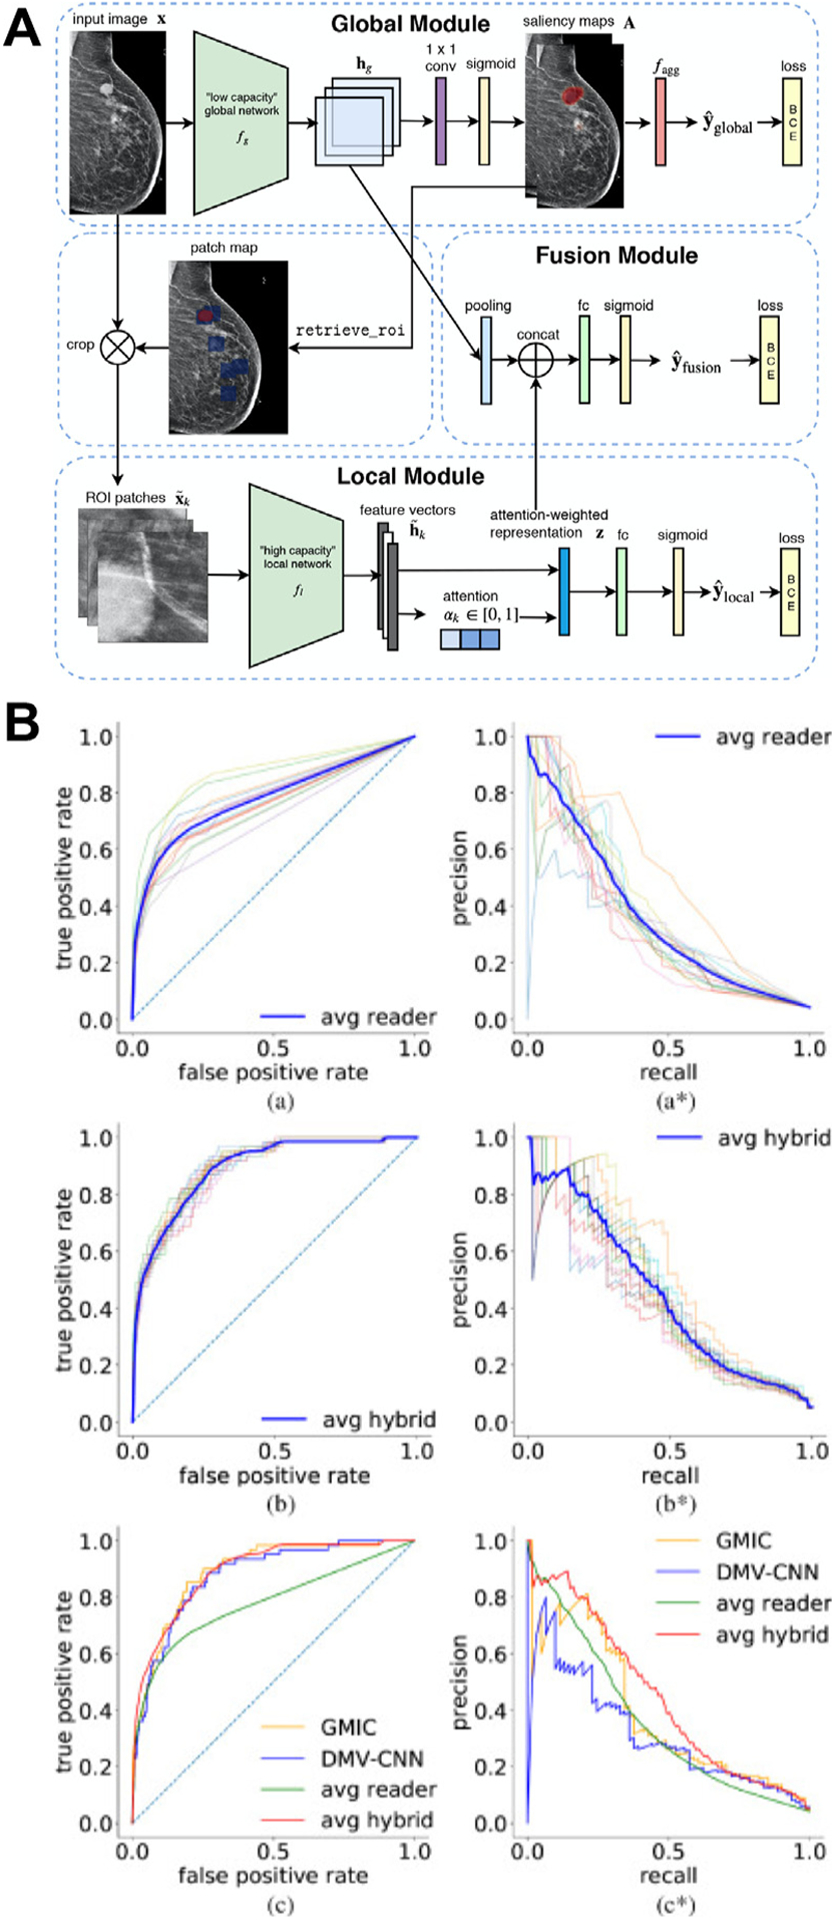
This article gives a brief overview of the development of artificial intelligence in clinical breast imaging. For multiple decades, artificial intelligence (AI) methods have been developed and translated for breast imaging tasks such as detection, diagnosis, and assessing response to therapy. As imaging modalities arise to support breast cancer screening programs and diagnostic examinations, including full-field digital mammography, breast tomosynthesis, ultrasound, and MRI, AI techniques parallel the efforts with more complex algorithms, faster computers, and larger data sets. AI methods include human-engineered radiomics algorithms and deep learning methods. Examples of these AI-supported clinical tasks are given along with commentary on the future.

Keywords: Breast cancer; Computer-aided diagnosis; Deep learning; Diagnosis; Machine learning; Medical imaging; Screening; Treatment response.


Conflict of interest statement

Disclosure Q.Hu declares no competing interests. M.L. Giger is a stockholder in R2 technology/Hologic and QView; receives royalties from Hologic, GE Medical Systems, MEDIAN Technologies, Riverain Medical, Mitsubishi, and Toshiba; and is a cofounder of Quantitative Insights (now Qlarity Imaging). Following the University of Chicago Conflict of Interest Policy, the investigators disclose publicly actual or potential significant financial interest that would reasonably appear to be directly and significantly affected by the research activities.

Figures

Fig. 1.
Fig. 1.
Schematic flowchart of a computerized tumor phenotyping system for breast cancers on DCE-MRI. The CAD radiomics pipeline includes computer segmentation of the tumor from the local parenchyma and computer-extraction of human-engineered radiomic features covering six phenotypic categories: (1) size (measuring tumor dimensions), (2) shape (quantifying the 3D geometry), (3) morphology (characterizing tumor margin), (4) enhancement texture (describing the heterogeneity within the texture of the contrast uptake in the tumor on the first postcontrast MRIs), (5) kinetic curve assessment (describing the shape of the kinetic curve and assessing the physiologic process of the uptake and washout of the contrast agent in the tumor during the dynamic imaging series, and (6) enhancement-variance kinetics (characterizing the time course of the spatial variance of the enhancement within the tumor). CAD, computer-aided diagnosis; DCE-MRI, dynamic contrast-enhanced MRI. (From Giger ML. Machine learning in medical imaging. J Am Coll Radiol. 2018;15(3):512–520; with permission.)
Fig. 2.
Fig. 2.
Schematic of methods for the classification of ROIs using human-engineered texture feature analysis and deep convolutional neural network methods. ROI, region of interest. (From Li H. et al. Deep learning in breast cancer risk assessment: evaluation of convolutional neural networks on a clinical dataset of full-field digital mammograms. J Med Imaging 2017;4; with permission.)
Fig. 3.
Fig. 3.
Illustration of the first journal publication on the use of a convolutional neural network (CNN), that is, a shift-invariant neural network, in medical image analysis. The CNN was used in a computer-aided detection system to detect microcalcification on digitized mammograms and later on full-field digital mammograms. (A) A 2D shift-invariant neural network. (B) Illustration of input testing image, output image, desired output image, and responses in hidden layers. (From Zhang W. et al. Computerized detection of clustered microcalcifications in digital mammograms using a shift-invariant artificial neural network. Med Phys. 1994;21(4):517–524; with permission.)
Fig. 4.
Fig. 4.
(A) Overall architecture of the globally aware multiple instance classifier (GMIC), in which the patch map indicates positions of the region of interest patches (blue squares) on the input. (B) The receiver operating characteristic curves and precision-recall curves computed on the reader study set. (a, a*): Curves for all 14 readers. (b, b*): Curves for hybrid models with each single reader. The curve highlighted in blue indicates the average performance of all hybrids. (c, c*): Comparison among the GMIC, deep multiview convolutional neural network (DMV-CNN), the average reader, and average hybrid. (From Shen Y. et al. An interpretable classifier for high-resolution breast cancer screening images utilizing weakly supervised localization. Med Image Anal. 2021;68:101908; with permission. (For interpretation of the references to color in this figure legend, the reader is referred to the web version of this article.))
Fig. 5.
Fig. 5.
Diagram illustrating the experimental setup for triage analysis (CADt). In the standard scenario, radiologists read all mammograms. In CADt (or rule-out), radiologists only read mammograms above the model’s cancer-free threshold. (From Yala A. et al. A deep learning model to triage screening mammograms: a simulation study. Radiology 2019;293:38–46; with permission.)
Fig. 6.
Fig. 6.
Comparisons of classifier performance in distinguishing between benign and malignant breast lesions when different methods are used to incorporate volumetric information of breast lesions on DCE-MRI. (A) Using the maximum intensity projection (MIP) of the second postcontrast subtraction image outperformed using the central slice of both the second postcontrast subtraction images and the second-post contrast images. CS, central slice. (B) Feature MIP, that is, max pooling the feature space of all slices along the axial dimension, outperformed using image MIP at the input. (From [A] Antropova N, Abe H, Giger ML. Use of clinical MRI maximum intensity projections for improved breast lesion classification with deep convolutional neural networks. J Med Imaging 2018;5(1):14503; with permission. [B] Hu Q, et al. Improved Classification of Benign and Malignant Breast Lesions using Deep Feature Maximum Intensity Projection MRI in Breast Cancer Diagnosis using Dynamic Contrast-Enhanced MRI. Radiol Artif Intell. 2021:e200159; with permission.)
Fig. 7.
Fig. 7.
Illustrations of image two approaches of using the temporal sequence of images in DCE-MRI in deep learning–based computer-aided diagnosis methods in distinguishing between benign and malignant breast lesions. (A) The same region of interest (ROI) is cropped from the first, second, and third postcontrast subtraction images and combined in the red, green, and blue (RGB) channels to form an RGB ROI. (B) Features extracted using a pretrained convolutional neural network (CNN) from all time points in DCE-MRI sequences are analyzed by a long short-term memory (LSTM) network to predict the probability of malignancy. (From [A] Hu Q. et al. Improved Classification of Benign and Malignant Breast Lesions using Deep Feature Maximum Intensity Projection MRI in Breast Cancer Diagnosis using Dynamic Contrast-Enhanced MRI. Radiol Artif Intell. 2021:e200159; with permission. [B] Antropova N, et al. Breast lesion classification based on dynamic contrast-enhanced magnetic resonance images sequences with long short-term memory networks. J Med Imaging 2018;6(1):1–7; with permission.)
Fig. 8.
Fig. 8.
Breast lesion classification pipeline using multiparametric MRI exams using (A) human-engineered radiomics and (B) deep learning. (A) Radiomic features are extracted from dynamic contrast-enhanced (DCE), T2-weighted (T2w), and diffusion-weighted (DWI) MRI sequences. Information from the three sequences is integrated using two fusion strategies: feature fusion, that is, concatenating features extracted from all sequences to train a classifier, and classifier fusion, that is, aggregating the probability of malignancy output from all single-parametric classifiers via soft voting. Parentheses contain the numbers of features extracted from each sequence. The dashed lines for DWI indicate that the DWI sequence is not available in all cases and is included in the classification process when it is available. (B) Information DCE and T2w MRI sequences are integrated using three fusion strategies: image fusion, that is, fusing DCE and T2w images to create RGB composite image, feature fusion as defined in (A), and classifier fusion as defined in (A). ADC, apparent diffusion coefficient; CNN, convolutional neural network; MIP, maximum intensity projection; ROI, region of interest; ROC, receiver operating characteristic; SVM, support vector machine. ([A] From Hu Q, Whitney HM, Giger ML. Radiomics methodology for breast cancer diagnosis using multiparametric magnetic resonance imaging. J Med Imaging. 2020;7(4):44502; with permission. [B] Adapted from Hu Q, Whitney HM, Giger ML. A deep learning methodology for improved breast cancer diagnosis using multiparametric MRI. Sci Rep. 2020;10(1):1–11; with permission. This article is licensed under a Creative Commons Attribution 4.0 International License: http://creativecommons.org/licenses/by/4.0/.)
Fig. 9.
Fig. 9.
A diagonal classifier agreement plot between the T2-weighted (T2w) and dynamic contrast-enhanced (DCE)-MRI single-sequence deep learning–based classifiers. The x-axis and y-axis denote the probability of malignancy (PM) scores predicted by the DCE classifier and the T2w classifier, respectively. Each point represents a lesion for which predictions were made. Points along or near the diagonal from bottom left to top right indicate high classifier agreement; points far from the diagonal indicate low agreement. A notable disagreement between the two classifiers is observed, suggesting that features extracted from the two MRI sequences provide complementary information, and it is likely valuable to incorporate multiple sequences in multiparametric MRI when making a computer-aided diagnosis prediction. Examples of lesions on which the two classifiers are in extreme agreement/disagreement are also included. (From Hu Q, Whitney HM, Giger ML. A deep learning methodology for improved breast cancer diagnosis using multiparametric MRI. Sci Rep. 2020;10(1):1–11; with permission. This article is licensed under a Creative Commons Attribution 4.0 International License: http://creativecommons.org/licenses/by/4.0/.)
Fig. 10.
Fig. 10.
Left column: Fitted binormal ROC curves comparing the performances of classifiers based on human-engineered radiomics, convolutional neural network (CNN), and fusion of the two on three imaging modalities. Right column: Associated Bland-Altman plots illustrating agreement between the classifiers based on human-engineered radiomics and CNN. Since the averaged output is used in the fusion classifier, these plots also help visualize potential decision boundaries for the fusion classifier. (From Antropova N, Huynh BQ, Giger ML. A deep feature fusion methodology for breast cancer diagnosis demonstrated on three imaging modality datasets. Med Phys 2017;44(10):5162–71; with permission.)
Fig. 11.
Fig. 11.
Imaging features significantly associated with molecular subtypes (after correction for multiple testing) in both discovery and validation cohorts, (A–D) four features for distinguishing luminal A versus nonluminal A; (E, F) two features for distinguishing luminal B versus nonluminal B; and (G, H) two features for distinguishing basal-like versus nonbasal-like. Wilcoxon rank-sum test was implemented to investigate pairwise differences. Also, the FDR adjusted for multiple testing is reported. (From Wu J, Sun X, Wang J, et al. Identifying relations between imaging phenotypes and molecular subtypes of breast cancer: Model discovery and external validation. J Magn Reson Imaging. 2017;46(4):1017–1027; with permission.)
Fig. 12.
Fig. 12.
Statistically significant associations between genomic features and radiomic features on MRI in breast carcinoma. Genomic features are organized into circles by data platform and indicated by different node colors. Genomic features without statistically significant associations are not shown. Radiomic phenotypes in six categories are also indicated by different node colors. The node size is proportional to its connectivity relative to other nodes in the category. (From Zhu Y. et al. Deciphering genomic underpinnings of quantitative MRI-based radiomic phenotypes of invasive breast carcinoma. Sci Rep 2015;42(6):3603; with permission.)

Similar articles

Cited by

References

    1. Siegel RL, Miller KD, Fuchs HE, et al. Cancer statistics, 2021. CA Cancer J Clin 2021;71(1):7–33. - PubMed
    1. Niell BL, Freer PE, Weinfurtner RJ, et al. Screening for breast cancer. Radiol Clin North Am 2017;55(6): 1145–62. - PubMed
    1. ACR appropriateness criteria: breast cancer screening. American College of Radiology; 2017. Available at: https://acsearch.acr.org/docs/70910/Narrative. Accessed January 17, 2021. - PubMed
    1. Nelson HD, O’Meara ES, Kerlikowske K, et al. Factors associated with rates of false-positive and false-negative results from digital mammography screening: an analysis of registry data. Ann Intern Med 2016;164(4):226–35. - PMC - PubMed
    1. Mann RM, Cho N, Moy L. Breast MRI: state of the art. Radiology 2019;292(3):520–36. - PubMed

MeSH terms