. 2021 Oct 6:12:737139.
doi: 10.3389/fpls.2021.737139. eCollection 2021.

Cell Wall Composition and Structure Define the Developmental Fate of Embryogenic Microspores in Brassica napus

Affiliations

Cell Wall Composition and Structure Define the Developmental Fate of Embryogenic Microspores in Brassica napus

Carolina Camacho-Fernández et al. Front Plant Sci. .

Abstract

Microspore cultures generate a heterogeneous population of embryogenic structures that can be grouped into highly embryogenic structures [exine-enclosed (EE) and loose bicellular structures (LBS)] and barely embryogenic structures [compact callus (CC) and loose callus (LC) structures]. Little is known about the factors behind these different responses. In this study we performed a comparative analysis of the composition and architecture of the cell walls of each structure by confocal and quantitative electron microscopy. Each structure presented specific cell wall characteristics that defined their developmental fate. EE and LBS structures, which are responsible for most of the viable embryos, showed a specific profile with thin walls rich in arabinogalactan proteins (AGPs), highly and low methyl-esterified pectin and callose, and a callose-rich subintinal layer not necessarily thick, but with a remarkably high callose concentration. The different profiles of EE and LBS walls support the development as suspensorless and suspensor-bearing embryos, respectively. Conversely, less viable embryogenic structures (LC) presented the thickest walls and the lowest values for almost all of the studied cell wall components. These cell wall properties would be the less favorable for cell proliferation and embryo progression. High levels of highly methyl-esterified pectin are necessary for wall flexibility and growth of highly embryogenic structures. AGPs seem to play a role in cell wall stiffness, possibly due to their putative role as calcium capacitors, explaining the positive relationship between embryogenic potential and calcium levels.

Keywords: androgenesis; arabinogalactan proteins; callose; cell totipotency; cell wall; cellulose; microspore embryogenesis; subintinal layer.


Conflict of interest statement

The authors declare that the research was conducted in the absence of any commercial or financial relationships that could be construed as a potential conflict of interest.

Figures
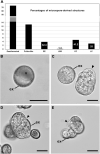
FIGURE 1
FIGURE 1
Development of isolated microspore cultures. (A) Percentages of the different structures derived from in vitro cultured microspores, including dead or arrested microspores, pollen-like structures, exine-enclosed (EE) structures, loose bicellular structures (LBS), compact calli (CC), and loose calli (LC). Percentages were calculated from a total of 1245 randomly selected structures. The numbers in EE, LBS, CC, and LC represent the relative percentages of each type of potentially embryogenic structure, excluding non-embryogenic forms (dead/arrested and pollen-like). (B–E) Confocal microscopy images of a vacuolated microspore at the start of culture (day 0; B), an EE structure (C left), a LBS (C right), a CC (D), and a LC (E). Arrowheads point to areas devoid of exine (ex). Bars: 20 μm.
FIGURE 2
FIGURE 2
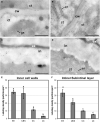
Cell wall width. (A) Electron microscopy image of an exine-enclosed (EE) structure, showing the inner cell wall (cw), subintinal layer (sl), intine (in), and exine (ex). ct, cytoplasm. (B–D) Images of structures stained with SCRI Renaissance Cell 2200 observed by confocal microscopy. (B) Young, EE-derived embryo, (C) compact callus (CC), and (D) loose callus (LC). (E) Subintinal layer width (in nm) in each type of structure. (F) Width (in nm) of the intine + subintinal layer in each type of structure. Different letters represent significant differences according to the LSD test. Bars: (A), 500 nm; (B–D), 10 μm.
FIGURE 3
FIGURE 3
Confocal microscopy images of EE structures at 2 (A,A′), 5 (B,B′), and 8 days of culture (C,C′), stained with aniline blue for callose (blue in A–C) together with propidium iodide (red), and with Direct Red for cellulose (red in A′–C′) together with DAPI (blue). Arrowheads indicate regions of exine (ex) rupture or absence. cw, cell wall; n, nucleus; sl, subintinal layer. Bars: 20 μm.
FIGURE 4
FIGURE 4
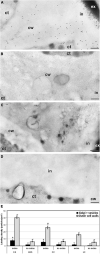
Callose detection by immunogold labeling and quantification in TEM images of 5-day-old microspore cultures. Inner cell wall images from EE (A), LBS (B), and LC (C) structures. Outer cell wall images from EE (D), LBS (E), and CC (F) structures. (G) Callose labeling density in inner cell walls. (H) Callose labeling density in external cell walls. Different letters represent significant differences according to the LSD test. Labeling density is expressed in number of particles per μm2. a, autophagosome; ct, cytoplasm; cw, cell wall; er, endoplasmic reticulum; ex, exine; gs, Golgi stack; in, intine; m, mitochondrion; v, vacuole. Bars: 500 nm.
FIGURE 5
FIGURE 5
Detection of JIM13 cross-reacting AGPs by immunogold labeling and quantification in TEM images of 5-day-old microspore cultures. Inner cell wall images of EE (A) and LC structures (B). Outer cell wall (intine + subintinal layer) images of EE (C) and CC structures (D). (E) Quantification of JIM13-cross-reacting AGPs in inner cell walls. (F) Quantification of JIM13-cross-reacting AGPs in outer cell walls (intine + subintinal layer). Labeling density is expressed as number of particles/μm2. Different letters represent significant differences according to the LSD test. ct, cytoplasm; cw, cell wall; er, endoplasmic reticulum; ex, exine; gs, Golgi stack; in, intine; m, mitochondria; v, vacuole. Bars: 500 nm.
FIGURE 6
FIGURE 6
Detection of JIM5 cross-reacting low methyl-esterified pectin by immunogold labeling and quantification in TEM images of 5-day-old microspore cultures. Inner cell wall images of EE (A) and LC (B). (C) Outer cell wall image of EE. (D) Quantification of JIM5 cross-reacting low methyl-esterified pectin in cytoplasmic Golgi stacks and vesicles. (E) Quantification of JIM5 cross-reacting low methyl-esterified pectin in inner cell walls. (F) Quantification of JIM5 cross-reacting low methyl-esterified pectin in outer cell walls (intine + subintinal layer). Labeling density is expressed in number of particles per μm2. Different letters represent statistically significant differences according to the LSD test. ct, cytoplasm; cw, cell wall; ex, exine; in, intine; m, mitochondrion. Bars: 500 nm.
FIGURE 7
FIGURE 7
Detection of JIM7-cross-reacting highly methyl-esterified pectin by immunogold labeling and quantification in TEM images of 5-day-old microspore cultures. External cell wall images of EE (A) and CC (B). Inner cell wall images of EE (C) and CC (D). (E) Quantification of JIM7-cross-reacting highly methyl-esterified pectin in cytoplasmic Golgi stacks and vesicles. (F) Quantification of JIM7-cross-reacting highly methyl-esterified pectin in inner cell walls. (G) Quantification of JIM7-cross-reacting highly methyl-esterified pectin in outer cell walls (intine + subintinal layer). Labeling density is expressed in number of particles per μm2. Different letters represent statistically significant differences according to LSD test. ct, cytoplasm; cw, cell wall; ex, exine; in, intine; m, mitochondria. Bars: 200 nm.
FIGURE 8
FIGURE 8
Detection of JIM7 cross-reacting highly methyl-esterified by immunogold labeling and quantification in TEM images of cell wall regions connecting to outer walls from 5-day-old microspore cultures. Images of cell wall regions connecting with outer walls in EE (A), LBS without exine (B), and LC with (C) and without exine (D). (E) Quantification of JIM7-cross-reacting highly methyl-esterified pectin in cytoplasmic Golgi stacks and vesicles and outer cell wall in different types of structures and in areas with or without exine. Labeling density is expressed in number of particles per μm2. Different letters represent statistically significant differences obtained with LSD test. ct, cytoplasm; cw, cell wall; ex, exine; in, intine. Bars: 200 nm.
FIGURE 9
FIGURE 9
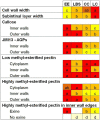
Summary of the cell wall composition characteristics of the different embryogenic microspore-derived structures. Different letters represent statistically significant differences in labeling density according to the LSD test, ranging from a (the highest labeling density) to d (the lowest labeling density). For a better comparison among structures, each letter is associated with a different background color.

References

    1. Abramova L. I., Avalkina N. A., Golubeva E. A., Pyzhenkova Z. S., Golubovskaya I. N. (2003). Synthesis and deposition of callose in anthers and ovules of meiotic mutants of maize (Zea mays). Russ. J. Plant Physiol. 50 324–329. 10.1023/a:1023866019102 - DOI
    1. Albersheim P., Darvill A., Roberts K., Sederoff R., Staehelin A. (2011). Plant Cell Walls. New York: Garland Science.
    1. Aouar L., Chebli Y., Geitmann A. (2010). Morphogenesis of complex plant cell shapes: the mechanical role of crystalline cellulose in growing pollen tubes. Sex. Plant. Reprod. 23 15–27. 10.1007/s00497-009-0110-7 - DOI - PubMed
    1. Borderies G., Le Bechec M., Rossignol M., Lafitte C., Le Deunff E., Beckert M., et al. (2004). Characterization of proteins secreted during maize microspore culture: arabinogalactan proteins (AGPs) stimulate embryo development. Eur. J. Cell Biol. 83 205–212. - PubMed
    1. Bou Daher F., Braybrook S. A. (2015). How to let go: pectin and plant cell adhesion. Front. Plant Sci. 6:523. 10.3389/fpls.2015.00523 - DOI - PMC - PubMed