. 2021 Oct;16(10):104052.
doi: 10.1088/1748-9326/ac2a63. Epub 2021 Oct 19.

Latin American cities with higher socioeconomic status are greening from a lower baseline: evidence from the SALURBAL project

Affiliations

Latin American cities with higher socioeconomic status are greening from a lower baseline: evidence from the SALURBAL project

Yang Ju et al. Environ Res Lett. 2021 Oct.

Abstract

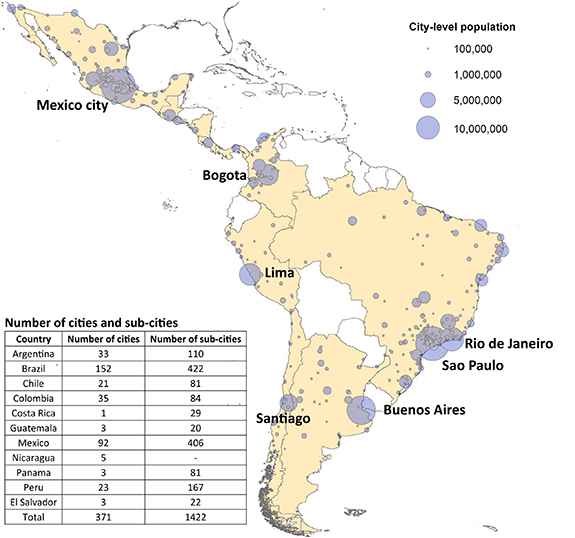
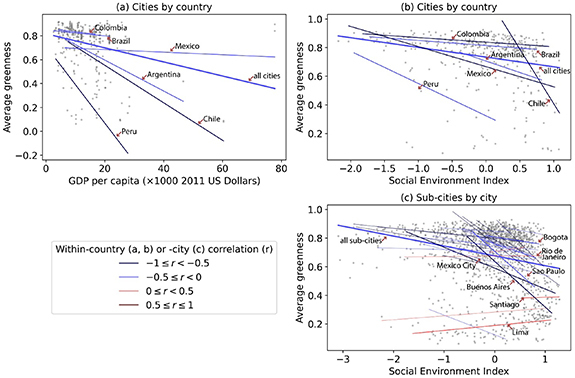
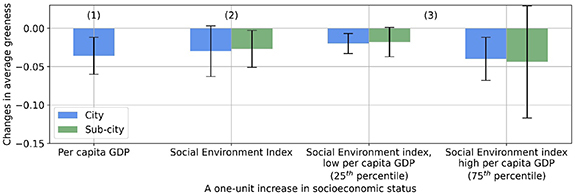
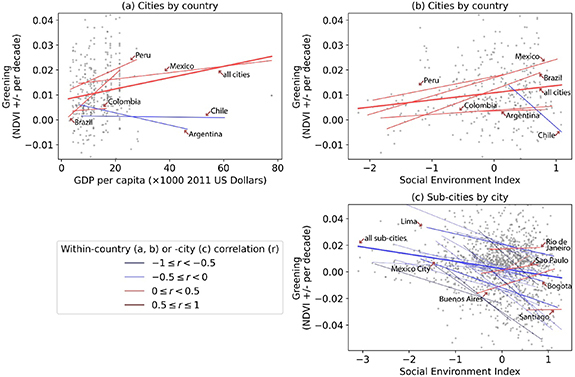
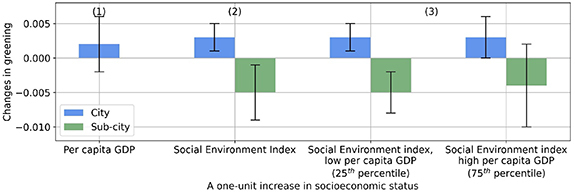
The characteristics of urban green space have context-dependent associations with socioeconomic status (SES). Latin American cities provide a unique but understudied context to assess the green space-SES associations. We measured the quantity and quality of green space as greenness from satellite-derived Normalized Difference Vegetation Index, and we modeled the relationship between greenness and SES in 371 major Latin American cities between 2000 and 2010. We found that SES was negatively associated with average greenness at city and sub-city scales, which could be explained by urbanization generally improving SES while reducing the provision of green space. About 82% of the cities and 64% of the sub-cities experienced greening or increases in greenness over time. Although with lower average greenness, cities with higher SES had greater greening; however, it was the opposite for sub-cities. We suggest that greening is more likely to take place in peripheral sub-cities where SES tends to be lower. The findings challenge the belief that places with higher SES have better access to environmental resources and amenities; instead, this relationship is context dependent.

Keywords: Latin America; environmental justice; green space; socioeconomic status; urban.


Figures

Figure 1.
Figure 1.
Study area, and number of cities and sub-cities by country. Reproduced from Quistberg et al (2018). CC BY 4.0.
Figure 2.
Figure 2.
Scatter plot and correlations between SES and average greenness between 2000 and 2015 at city (a), (b) and sub-city (c) levels. The lines are with-country (a), (b) or -city (c) linear fits between SES and average greenness, with their correlations in colors. Due to smaller sample sizes, countries with less than ten cities and cities with less than ten sub-cities are excluded from the linear fit and correlation analysis.
Figure 3.
Figure 3.
Average marginal effect (AME) of social economic status (SES) on average greenness. AME is the change in average greenness for a one-unit increase in a SES variable when holding other covariates constant, averaged across the samples. A one-unit increase corresponds to a 10 000 USD raise in per capita GDP and an interquartile range increase in Social Environment Index. The 95% confidence intervals for the AMEs are shown in error bars. AMEs for cities in columns (1)–(3) are estimated based on models (1)–(3) in table S3. AMEs for sub-cities in columns (2) and (3) are estimated based on models (4) and (5) in table S3.
Figure 4.
Figure 4.
Associations between greening (changes in greenness per decade) and SES variables at city (a), (b) and sub-city (c) levels. The dots represent cities nested in countries (a), (b) or sub-cities nested in cities (c). The dash lines are country- or city-specific linear fits between greening and a SES variable, with their correlations shown in colors. Due to smaller sample sizes, countries with less than ten cities and cities with less than ten sub-cities are excluded from the linear fit and correlation analysis. For display purpose, the plots are constrained to the middle 90% range of greening.
Figure 5.
Figure 5.
Average marginal effect (AME) of social economic status on greening (changes in greenness per decade). AME is the change in greening for a one-unit increase in a SES variable when holding other covariates constant, averaged across the samples. A one-unit increase corresponds to a 10 000 USD raise in per capita GDP and an interquartile range increase in Social Environment Index. The 95% confidence intervals for the AMEs are shown in error bars. AMEs for cities in columns (1)–(3) are estimated based on models (6)–(8) in table S4. AMEs for sub-cities in columns (2) and (3) are estimated based models (9) and (10) in table S4.

References

    1. Aroca P, Atienza M. Spatial Concentration in Latin America and the Role of Institutions. Investigaciones Regionales – J. Regional Res. 2016:233–53.
    1. Bilal U, et al. Life expectancy and mortality profiles are highly heterogeneous in 363 cities of Latin America: the SALURBAL project. Nat. Med. 2020;27:463–70. doi: 10.1038/s41591-020-01214-4. - DOI - PMC - PubMed
    1. Buhaug H, Urdal H. An urbanization bomb? Population growth and social disorder in cities. Glob. Environ. Change. 2013;23:1–10. doi: 10.1016/j.gloenvcha.2012.10.016. - DOI
    1. Casey J A, James P, Cushing L, Jesdale B M, Morello-Frosch R. Race, ethnicity, income concentration and 10-year change in urban greenness in the United States. Int. J. Environ. Res. Public Health. 2017;14:12. doi: 10.3390/ijerph14121546. - DOI - PMC - PubMed
    1. Chen M, Zhang H, Liu W, Zhang W. The global pattern of urbanization and economic growth: evidence from the last three decades. PLoS One. 2014;9 doi: 10.1371/journal.pone.0103799. - DOI - PMC - PubMed

LinkOut - more resources