. 2020 Aug 24;8(3):nwaa180.
doi: 10.1093/nsr/nwaa180. eCollection 2021 Mar.

Single-cell transcriptomic landscape of human blood cells

Affiliations

Single-cell transcriptomic landscape of human blood cells

Xiaowei Xie et al. Natl Sci Rev. .

Abstract

High throughput single-cell RNA-seq has been successfully implemented to dissect the cellular and molecular features underlying hematopoiesis. However, an elaborate and comprehensive transcriptome reference of the whole blood system is lacking. Here, we profiled the transcriptomes of 7551 human blood cells representing 32 immunophenotypic cell types, including hematopoietic stem cells, progenitors and mature blood cells derived from 21 healthy donors. With high sequencing depth and coverage, we constructed a single-cell transcriptional atlas of blood cells (ABC) on the basis of both protein-coding genes and long noncoding RNAs (lncRNAs), and showed a high consistence between them. Notably, putative lncRNAs and transcription factors regulating hematopoietic cell differentiation were identified. While common transcription factor regulatory networks were activated in neutrophils and monocytes, lymphoid cells dramatically changed their regulatory networks during differentiation. Furthermore, we showed a subset of nucleated erythrocytes actively expressing immune signals, suggesting the existence of erythroid precursors with immune functions. Finally, a web portal offering transcriptome browsing and blood cell type prediction has been established. Thus, our work provides a transcriptional map of human blood cells at single-cell resolution, thereby offering a comprehensive reference for the exploration of physiological and pathological hematopoiesis.

Keywords: hematopoietic cells; human; lncRNAs; single-cell RNA-seq; transcription factor.


Figures

Figure 1.
Figure 1.
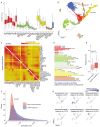
Transcriptome reference of human blood cells. (A) Scheme of the experimental design. (B) Box plot shows the detected gene number for 32 immunophenotypic cell types. Colors indicate cell types. (C) Atlas of Blood Cells (ABC) detects more genes and transcription factors than the bone marrow samples from Human Cell Atlas (HCA) (P values < 2.2e−16, Wilcoxon test). (D) Transcriptional atlas of 7551 human hematopoietic cells by UMAP. Colors indicate cell populations and arrows show the differentiation trajectories of lymphoid, neutrophil/monocyte and erythroid lineages. (E) UMAP displays of transcription activities for hematopoiesis-related genes (AVP, CD79B, GZMH, CCR7, SPI1 and GATA1, respectively, for HSPCs, B cells, NK cells, T cells, neutrophil/monocytes and erythrocytes).
Figure 2.
Figure 2.
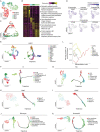
Transcription factor regulatory networks underlie hematopoiesis. (A) UMAP displays the distributions of 32 immunophenotypic cell types based on regulons. Colors indicate cell types and arrows reflect the differentiation trajectories of lymphoid, neutrophil/monocyte and erythroid lineages. (B) 20 regulatory clusters determined by Seurat package. C1 to C20 indicates the regulatory clusters. (C) Heat map displays the on/off states of cluster-specific regulons. Black represents when the network is activated, and white represents when the network is inactivated. Red boxes emphasize the regulons for identical cell types or lineages. (D) Cytoscape shows the regulatory networks comprising transcription factors and their target genes underlying the lymphoid lineage. Edges connect transcription factor-target gene pairs while nodes represent genes. Transcription factors are displayed in larger font size and red color highlights the novel ones. Enriched biological processes and motif sequences (above: annotated motif from JASPAR; below: enriched motif) of target genes for novel transcription factors are shown. Shadows highlight the cell-type specific sub-networks.
Figure 3.
Figure 3.
Reconstruction of hematopoietic hierarchy by using lncRNAs. (A) Box plot shows the detected lncRNA number for 32 immunophenotypic cell types. Colors indicate cell types. (B) Transcriptional atlas of 7192 human hematopoietic cells based on lncRNAs by UMAP. (C) Heat map shows the scaled DEG numbers between 32 immunophenotypic cell types based on protein-coding genes (the lower triangle) and lncRNAs (the upper triangle). (D) Bar plot shows the proportion of signature lncRNAs adjacent to signature protein-coding genes for each immunophenotypic cell type. (E and F) Signature lncRNAs show higher PhastCons conservation scores (E) and higher cell specificity (F) (P values < 2.2e−16, Wilcoxon test). (G) UMAP displays of transcription activities for hematopoiesis-related lncRNAs such as NONHSAG031143.2, NONHSAG073805.1, NONHSAG069091.1, NONHSAG108638.1, NONHSAG008235.2 and NONHSAG103763.2 (respectively adjacent to AVP, CD79B, GZMH, CCR7, SPI1 and GATA1).
Figure 4.
Figure 4.
Immune activation of CD74+ nucleated erythrocytes and elaborate atlas for other hematopoietic cell populations. (A) UMAP displays the transcriptional clusters for erythrocytes. Colors correspond to cell clusters. (B) Heat map shows the relative expression of the top 50 signature genes for each cluster. Significantly enriched biological processes for corresponding clusters are presented on the right. (C) The differentiation trajectory of erythrocytes by pseudotime analysis using Monocle3. (D) UMAP displays of transcription activities for surface markers and signature genes related to erythroid and granulocyte lineages. (E–K) UMAP displays of the transcriptional clusters (on the left by Seurat) and differentiation trajectory (on the right by Monocle3) for HSPCs (E), B cells (F), NK cells (G), CD4 T cells (H), CD8 T cells (I), monocytes (J) and neutrophils (K). Colors correspond to cell clusters. (L) Percentages of single cells in S and G2M phase for each cell population by line chart.

References

    1. Orkin SH, Zon LI. Hematopoiesis: an evolving paradigm for stem cell biology. Cell 2008; 132: 631–44.10.1016/j.cell.2008.01.025 - DOI - PMC - PubMed
    1. Laurenti E, Gottgens B. From haematopoietic stem cells to complex differentiation landscapes. Nature 2018; 553: 418–26.10.1038/nature25022 - DOI - PMC - PubMed
    1. Scala S, Aiuti A. In vivo dynamics of human hematopoietic stem cells: novel concepts and future directions. Blood Adv 2019; 3: 1916–24.10.1182/bloodadvances.2019000039 - DOI - PMC - PubMed
    1. Jacobsen SEW, Nerlov C. Haematopoiesis in the era of advanced single-cell technologies. Nat Cell Biol 2019; 21: 2–8.10.1038/s41556-018-0227-8 - DOI - PubMed
    1. Karamitros D, Stoilova B, Aboukhalil Zet al. . Single-cell analysis reveals the continuum of human lympho-myeloid progenitor cells. Nat Immunol 2018; 19: 85–97.10.1038/s41590-017-0001-2 - DOI - PMC - PubMed