. 2020 Aug 28;8(5):nwaa194.
doi: 10.1093/nsr/nwaa194. eCollection 2021 May.

Ultra-sensitive hybrid diamond nanothermometer

Affiliations

Ultra-sensitive hybrid diamond nanothermometer

Chu-Feng Liu et al. Natl Sci Rev. .

Abstract

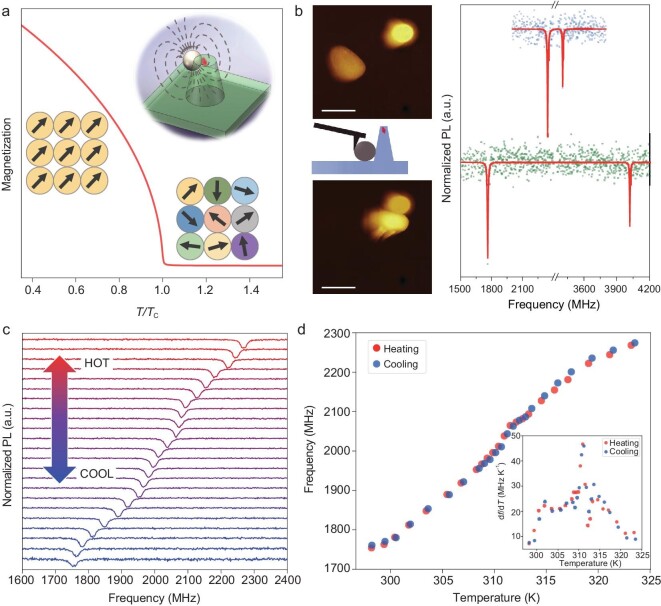
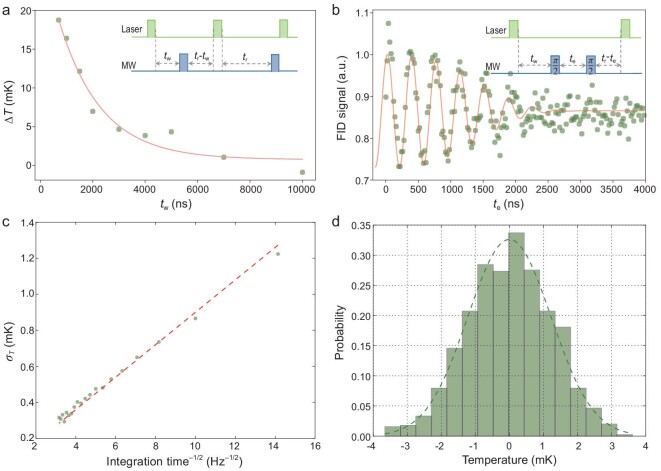
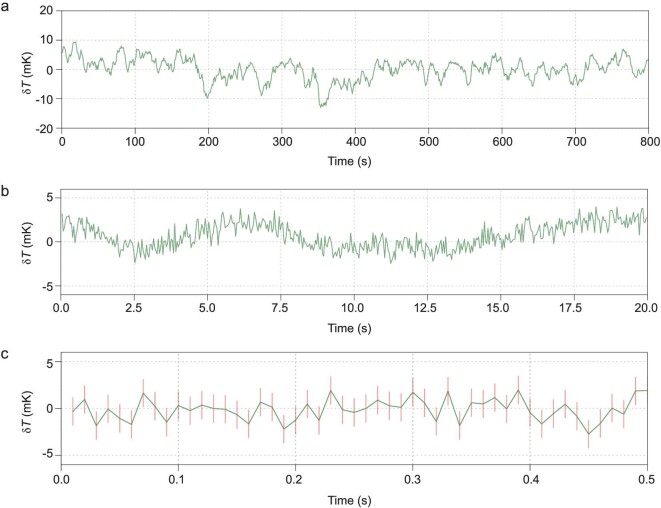
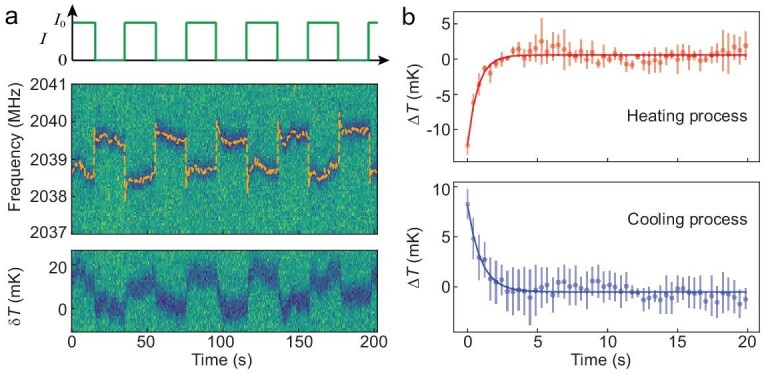
Nitrogen-vacancy (NV) centers in diamond are promising quantum sensors because of their long spin coherence time under ambient conditions. However, their spin resonances are relatively insensitive to non-magnetic parameters such as temperature. A magnetic-nanoparticle-nanodiamond hybrid thermometer, where the temperature change is converted to the magnetic field variation near the Curie temperature, were demonstrated to have enhanced temperature sensitivity ([Formula: see text]) (Wang N, Liu G-Q and Leong W-H et al. Phys Rev X 2018; 8: 011042), but the sensitivity was limited by the large spectral broadening of ensemble spins in nanodiamonds. To overcome this limitation, here we show an improved design of a hybrid nanothermometer using a single NV center in a diamond nanopillar coupled with a single magnetic nanoparticle of copper-nickel alloy, and demonstrate a temperature sensitivity of [Formula: see text]. This hybrid design enables detection of 2 mK temperature changes with temporal resolution of 5 ms. The ultra-sensitive nanothermometer offers a new tool to investigate thermal processes in nanoscale systems.

Keywords: diamond; magnetic nanoparticle; nano-thermometry; nitrogen-vacancy center; quantum sensing.


Figures

Figure 1.
Figure 1.
Design of a hybrid nanothermometer composed of a single magnetic copper-nickel alloy nanoparticle and a single nitrogen-vacancy (NV) center in a diamond nanopillar. (a) Simulation of the magnetization M of a copper-nickel alloy nanoparticle as a function of temperature under a magnetic field of 100 Gauss. The inset illustrates the configuration of the hybrid nanothermometer. (b) Atomic force microscopy (AFM) image of the copper-nickel alloy magnetic nanoparticle (MNP) and the diamond nanopillar before the nanomanipulation (upper graph) and after the nanomanipulation (lower graph), and the corresponding optically detected magnetic resonance (ODMR) spectra of the single NV center before and after nanomanipulation (dots being measurement data and lines the double Lorentzian peak fitting). Scale bar is 1 formula image. (c) ODMR spectra of the hybrid nanothermometer at different environmental temperatures (from 298 K to 324 K from bottom to top). (d) ODMR frequency shifts in the heating (red) and cooling (blue) processes. The inset shows the temperature susceptibility of the hybrid nanothermometer, which has the maximum formula image (at 311 K).
Figure 2.
Figure 2.
Sensitivity of the hybrid nanothermometer. (a) Cooling curve of the copper-nickel alloy MNP after the laser was turned off. Inset: pulse sequence for measuring the cooling dynamics of the MNP in the hybrid nanothermometer. (b) Free induction decay (FID) of the NV center spin in the hybrid nanothermometer. The inset shows the pulse sequence. The delay time formula image between the initialization laser and the microwave pulse sequence was chosen to be the cooling time of the MNP (formula image = 1500 ns). (c) Dependence of the temperature standard deviation on data integration time using FID real-time measurement. The shot-noise limited sensitivity is derived from the slope of the fitting curve (red dashed line). (d) A typical histogram of temperature measured in a period of 30 seconds (with sampling time 5 ms).
Figure 3.
Figure 3.
Real-time monitoring of local thermal dynamics. (a–c) Environmental temperature fluctuation measured by the hybrid nanothermometer with various data integration times (0.5 s, 40 ms and 10 ms, in a, b, and c, respectively).
Figure 4.
Figure 4.
Heat dissipation dynamics in the hybrid nanothermometer under pulsed heating. (a) Upper figure shows the chopped DC current passing through the microwave stripline. Middle figure plots the corresponding ODMR spectra of the NV center in the hybrid nanothermometer. The sudden shift of the ODMR frequency is caused by the magnetic field from the chopped DC current. The lower figure is the temperature variation of the hybrid sensor under heating by the chopped current. (b) Heating and cooling dynamics measured by the hybrid nanothermometer. The formula image point is defined by the average of the data at the steady state of the heating/cooling process.

References

    1. Mecklenburg M, Hubbard WA, White ERet al. . Nanoscale temperature mapping in operating microelectronic devices. Science 2015; 347: 629–32. 10.1126/science.aaa2433 - DOI - PubMed
    1. Baffou G, Quidant R. Thermo-plasmonics: using metallic nanostructures as nano-sources of heat. Laser Photon Rev 2013; 7: 171–87. 10.1002/lpor.201200003 - DOI
    1. Wu J, Kwok TY, Li Xet al. . Mapping three-dimensional temperature in microfluidic chip. Sci Rep 2013; 3: 3321.10.1038/srep03321 - DOI - PMC - PubMed
    1. Baffou G, Rigneault H, Marguet Det al. . A critique of methods for temperature imaging in single cells. Nat Methods 2014; 11: 899–901. 10.1038/nmeth.3073 - DOI - PubMed
    1. Kiyonaka S, Sakaguchi R, Hamachi Iet al. . Validating subcellular thermal changes revealed by fluorescent thermosensors. Nat Methods 2015; 12: 801–2. 10.1038/nmeth.3548 - DOI - PubMed