

Mapping intrinsic electromechanical responses at the nanoscale via sequential excitation scanning probe microscopy empowered by deep data
- PMID: 34691831
- PMCID: PMC8291420
- DOI: 10.1093/nsr/nwy096
Mapping intrinsic electromechanical responses at the nanoscale via sequential excitation scanning probe microscopy empowered by deep data
Abstract
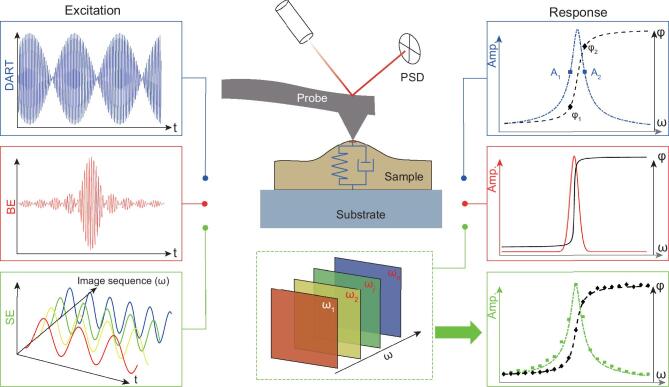
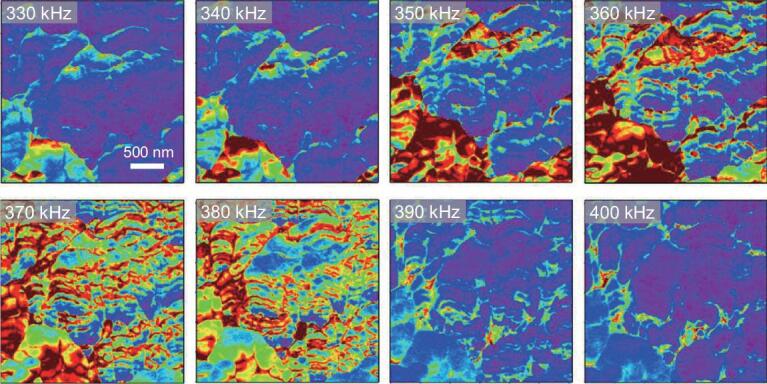
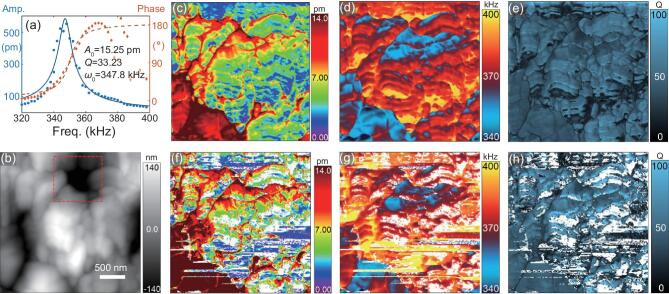
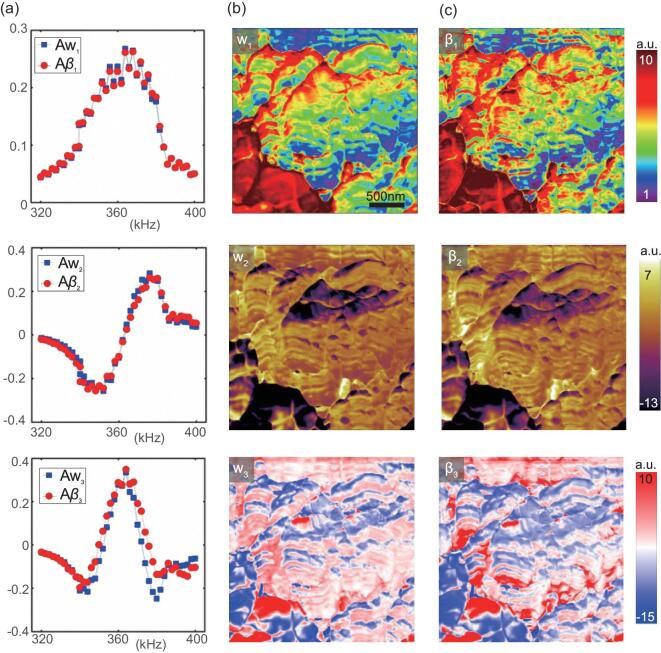
Ever-increasing hardware capabilities and computation powers have enabled acquisition and analysis of big scientific data at the nanoscale routine, though much of the data acquired often turn out to be redundant, noisy and/or irrelevant to the problems of interest, and it remains nontrivial to draw clear mechanistic insights from pure data analytics. In this work, we use scanning probe microscopy (SPM) as an example to demonstrate deep data methodology for nanosciences, transitioning from brute-force analytics such as data mining, correlation analysis and unsupervised classification to informed and/or targeted causative data analytics built on sound physical understanding. Three key ingredients of such deep data analytics are presented. A sequential excitation scanning probe microscopy (SE-SPM) technique is first developed to acquire high-quality, efficient and physically relevant data, which can be easily implemented on any standard atomic force microscope (AFM). Brute-force physical analysis is then carried out using a simple harmonic oscillator (SHO) model, enabling us to derive intrinsic electromechanical coupling of interest. Finally, principal component analysis (PCA) is carried out, which not only speeds up the analysis by four orders of magnitude, but also allows a clear physical interpretation of its modes in combination with SHO analysis. A rough piezoelectric material has been probed using such a strategy, enabling us to map its intrinsic electromechanical properties at the nanoscale with high fidelity, where conventional methods fail. The SE in combination with deep data methodology can be easily adapted for other SPM techniques to probe a wide range of functional phenomena at the nanoscale.
Keywords: principal component analysis; scanning probe microscopy; sequential excitation; simple harmonic oscillator model.
© The Author(s) 2018. Published by Oxford University Press on behalf of China Science Publishing & Media Ltd.
Figures
Similar articles
-
Resolving fine electromechanical structure of collagen fibrils via sequential excitation piezoresponse force microscopy.Nanotechnology. 2019 May 17;30(20):205703. doi: 10.1088/1361-6528/ab0340. Epub 2019 Jan 30. Nanotechnology. 2019. PMID: 30699396
-
High-throughput sequential excitation for nanoscale mapping of electrochemical strain in granular ceria.Nanoscale. 2019 Dec 28;11(48):23188-23196. doi: 10.1039/c9nr07438d. Epub 2019 Nov 28. Nanoscale. 2019. PMID: 31778138
-
Microscopic techniques bridging between nanoscale and microscale with an atomically sharpened tip - field ion microscopy/scanning probe microscopy/ scanning electron microscopy.Microscopy (Oxf). 2014 Nov;63 Suppl 1:i11-i12. doi: 10.1093/jmicro/dfu040. Microscopy (Oxf). 2014. PMID: 25359799
-
Applications of scanning probe-atomic force microscopy in nanobioelectronics.J Nanosci Nanotechnol. 2014 Jan;14(1):924-31. doi: 10.1166/jnn.2014.8759. J Nanosci Nanotechnol. 2014. PMID: 24730309 Review.
-
"May the Force Be with You!" Force-Volume Mapping with Atomic Force Microscopy.ACS Omega. 2021 Sep 13;6(40):25860-25875. doi: 10.1021/acsomega.1c03829. eCollection 2021 Oct 12. ACS Omega. 2021. PMID: 34660949 Free PMC article. Review.
Cited by
-
Piezoelectricity of Bi2Se3 Nanosheet.Nanomaterials (Basel). 2023 Sep 5;13(18):2504. doi: 10.3390/nano13182504. Nanomaterials (Basel). 2023. PMID: 37764533 Free PMC article.
-
Multiferroics under the tip: probing magnetoelectric coupling at the nanoscale.Natl Sci Rev. 2019 Jul;6(4):626-628. doi: 10.1093/nsr/nwz056. Epub 2019 May 9. Natl Sci Rev. 2019. PMID: 34691918 Free PMC article. No abstract available.
References
-
- Agrawal A, Choudhary A. Perspective: materials informatics and big data: realization of the ‘fourth paradigm' of science in materials science. APL Mater 2016; 4: 53208.
-
- Kalinin SV, Sumpter BG, Archibald RK. Big-deep-smart data in imaging for guiding materials design. Nat Mater 2015; 14: 973–80. - PubMed
-
- Munevar S. Unlocking big data for better health. Nat Biotechnol 2017; 35: 684–6. - PubMed
-
- Collins L, Belianinov A, Proksch Ret al. . G-mode magnetic force microscopy: separating magnetic and electrostatic interactions using big data analytics. Appl Phys Lett 2016; 108: 193103.
-
- Yuan R, Liu Z, Balachandran PVet al. . Accelerated discovery of large electrostrains in BaTiO3-based piezoelectrics using active learning. Adv Mater 2018; 30: 1702884. - PubMed
LinkOut - more resources
Full Text Sources
Miscellaneous