Climate and litter C/N ratio constrain soil organic carbon accumulation
- PMID: 34691930
- PMCID: PMC8291401
- DOI: 10.1093/nsr/nwz045
Climate and litter C/N ratio constrain soil organic carbon accumulation
Abstract
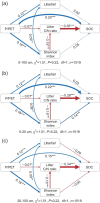
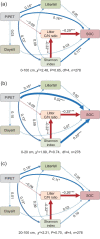
Soil organic carbon (SOC) plays critical roles in stabilizing atmospheric CO2 concentration, but the mechanistic controls on the amount and distribution of SOC on global scales are not well understood. In turn, this has hampered the ability to model global C budgets and to find measures to mitigate climate change. Here, based on the data from a large field survey campaign with 2600 plots across China's forest ecosystems and a global collection of published data from forested land, we find that a low litter carbon-to-nitrogen ratio (C/N) and high wetness index (P/PET, precipitation-to-potential-evapotranspiration ratio) are the two factors that promote SOC accumulation, with only minor contributions of litter quantity and soil texture. The field survey data demonstrated that high plant diversity decreased litter C/N and thus indirectly promoted SOC accumulation by increasing the litter quality. We conclude that any changes in plant-community composition, plant-species richness and environmental factors that can reduce the litter C/N ratio, or climatic changes that increase wetness index, may promote SOC accumulation. The study provides a guideline for modeling the carbon cycle of various ecosystem scales and formulates the principle for land-based actions for mitigating the rising atmospheric CO2 concentration.
Keywords: annual litterfall; litter carbon-to-nitrogen; soil organic carbon; soil texture; wetness index.
Published by Oxford University Press on behalf of China Science Publishing & Media Ltd. 2019.
Figures


References
-
- Rumpel C, Farshad A, Koutika LSet al. .. Put more carbon in soils to meet Paris climate pledges. Nature 2018; 564: 32–4. - PubMed
-
- Smith P. Soil carbon sequestration and biochar as negative emission technologies. Glob Change Biol 2016; 22: 1315–24. - PubMed
-
- Harden JW, Hugelius G, Ahlström Aet al. .. Networking our science to characterize the state, vulnerabilities, and management opportunities of soil organic matter. Glob Change Biol 2018; 24: e705–18. - PubMed
-
- Scharlemann JPW, Tanner EVJ, Hiederer Ret al. .. Global soil carbon: understanding and managing the largest terrestrial carbon pool. Carbon Manag 2014; 5: 81–91.
-
- Luo YQ, Ahlström A, Allison SDet al. .. Toward more realistic projections of soil carbon dynamics by Earth system models. Global Biogeochem Cy 2016; 30: 40–56.
LinkOut - more resources
Full Text Sources
