. 2019 Nov;6(6):1223-1238.
doi: 10.1093/nsr/nwz124. Epub 2019 Aug 28.

High-resolution mapping of brain vasculature and its impairment in the hippocampus of Alzheimer's disease mice

Affiliations

High-resolution mapping of brain vasculature and its impairment in the hippocampus of Alzheimer's disease mice

Xiaochuan Zhang et al. Natl Sci Rev. 2019 Nov.

Abstract

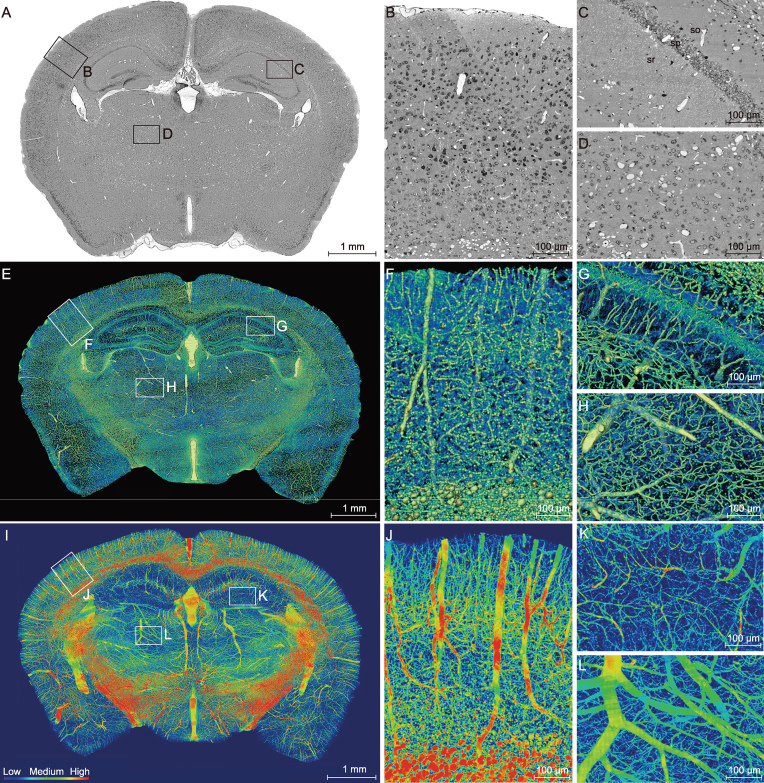
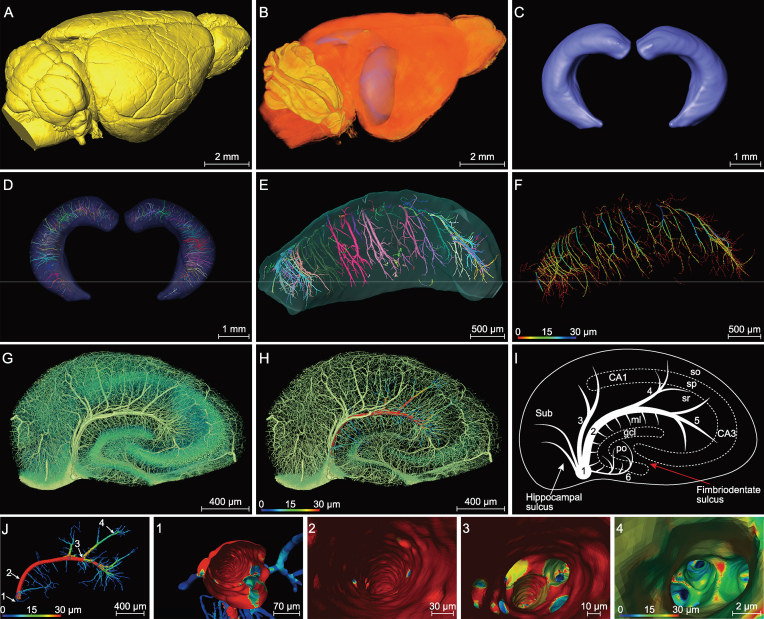
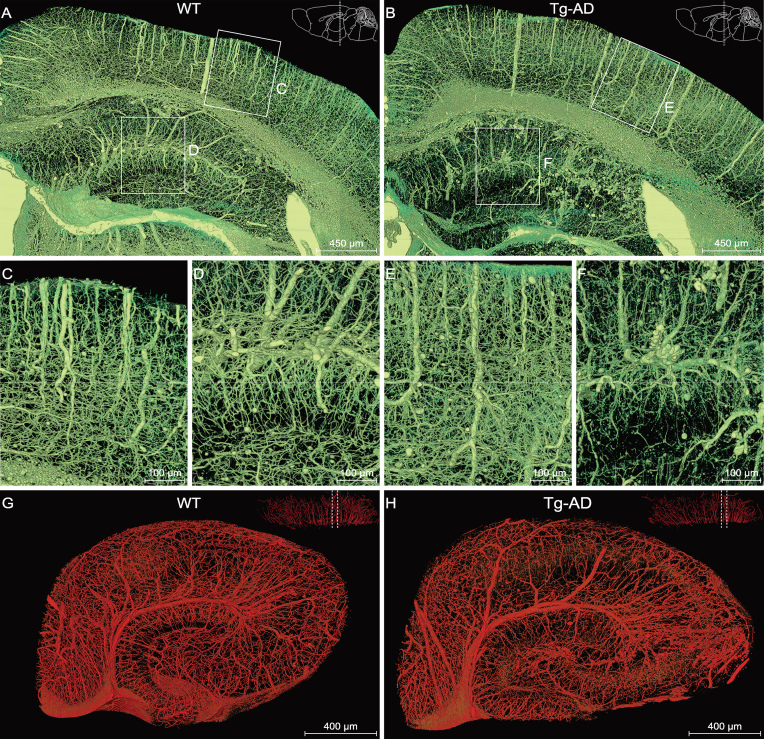
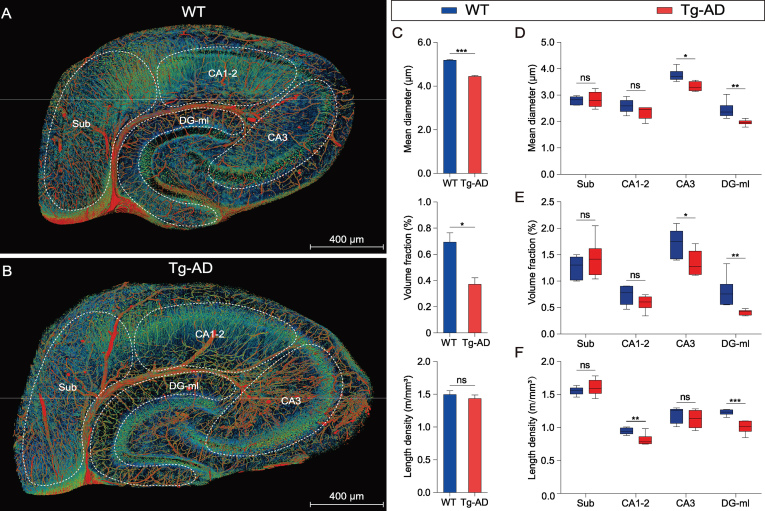
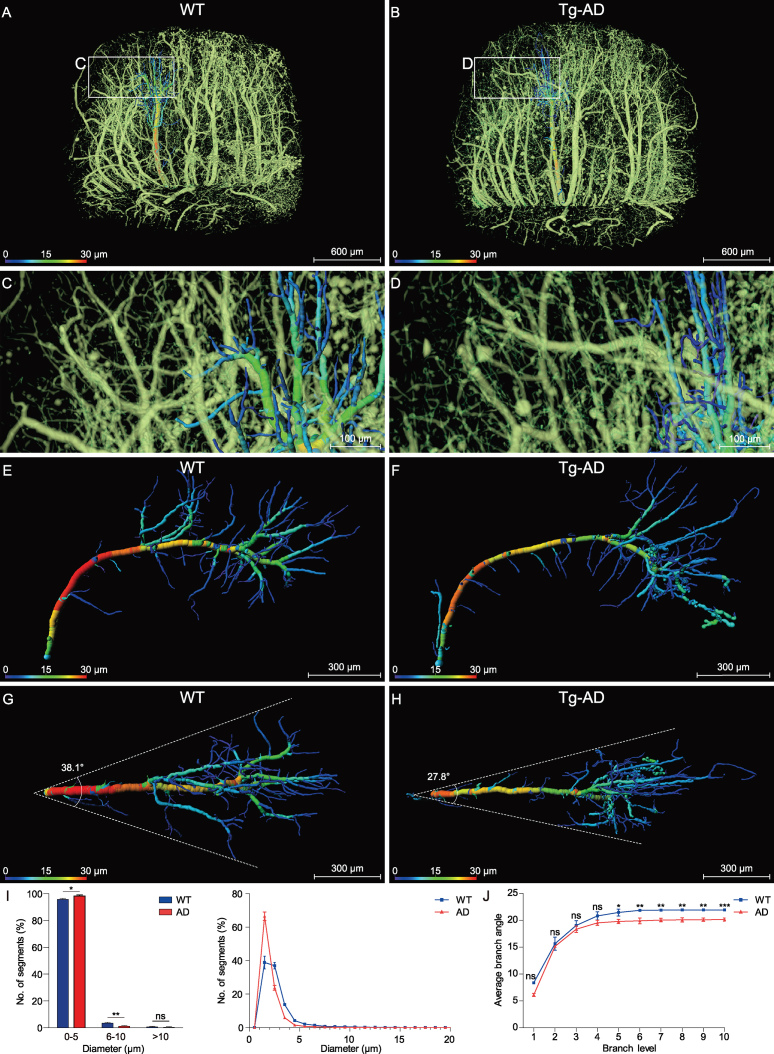
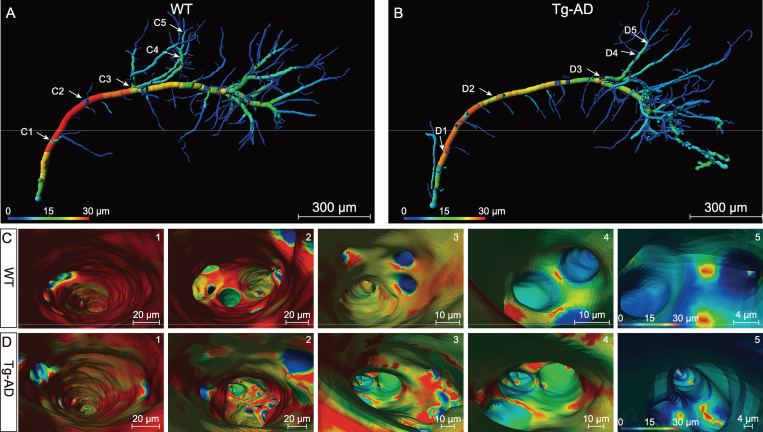
Accumulating evidence indicates the critical importance of cerebrovascular dysfunction in the pathogenesis of Alzheimer's disease (AD). However, systematic comparative studies on the precise brain vasculature of wild-type and AD model mice are still rare. Using an image-optimization method for analysing Micro-Optical Sectioning Tomography (MOST) data, we generated cross-scale whole-brain 3D atlases that cover the entire vascular system from large vessels down to smallest capillaries at submicron resolution, for both wild-type mice and a transgenic (APP/PS1) mouse model of AD. In addition to distinct vascular patterns in different brain regions, we found that the main vessels of the molecular layer of the hippocampal dentate gyrus (DG-ml) undergo abrupt changes in both diameter and branch angle, spreading a unique comb-like pattern of capillaries. By using a quantitative analysis workflow, we identified in the hippocampus of AD mice an overall reduction of the mean vascular diameter, volume fraction and branch angle, with most significant impairment in the DG-ml. In addition, virtual endoscopy revealed irregular morphological features in the vessel lumen of the AD mice, potentially contributing to the impairment of blood flow. Our results demonstrate the capability of high-resolution cross-scale evaluation of brain vasculature and underscore the importance of studying hippocampal microcirculation for understanding AD pathogenesis.

Keywords: Alzheimer's disease; Micro-Optical Sectioning Tomography; image optimization; impaired hippocampal vasculature; virtual vascular endoscopy.


Figures

Figure 1.
Figure 1.
High-resolution brain atlas providing a global view of the complex vascular network in a C57BL/6 mouse. (A) Representative coronal section showing the cortex (B), hippocampus (C) and thalamus (D), using the whole-brain Nissl-staining method. Boxed areas in A are shown in B, C and D, revealing somata (black) and vessels (white). The stratum oriens (so), strata pyramidale (sp), strata radiatum (sr), cell layers in the hippocampus. Smaller white circles in sr, nerve processes. (E–H) An image of a 200-μm-thick coronal section of the mouse brain reconstructed using volume rendering, with gray levels color-coded. Boxed areas in the cortex F, hippocampus G and thalamus H are shown at a higher magnification. Yellow/green lines, blood vessels; green dots in sp, somata; radial blue lines in sr, dendrites. (I–L) Maximum intensity projection (MIP) of the 400-μm-thick coronal section adjacent to that shown in E, revealing only blood vessels, with the vascular volumetric density coded in color. Boxed areas of the cortex (J), hippocampus (K) and thalamus (L) are shown at a higher magnification.
Figure 2.
Figure 2.
Segmented hippocampus for high-resolution vasculature analysis in a C57BL/6 mouse. (A) Lateral view of the 3D-reconstructed whole mouse brain, with a network of pial blood vessels visible on the surface. (B) and (C) Two segmented hippocampi from the mouse brain shown in (A), showing the location in the brain and the anterior view, respectively. (D) and (E) The inner vasculature of the bilateral hippocampi showing equally spaced transverse hippocampal vessels distributed in a rake-like pattern. Individual vessels labeled by different colors. (F) The same hippocampus as that in (E), with vessel diameters coded by colors. (G–I) Images of a hippocampal section perpendicular to the longitudinal axis, showing branches of transverse hippocampal vessels, with the gray level coded by the color in (G) (revealing both vessels, somata and nerve processes in sr). In (H), a selected vessel with the diameter of its main trunk and branches was coded for its diameters in colors (mainly vessels only). (I) Schematic diagram depicting the pattern of the transverse hippocampal vessels. 1: LHV, giving off ITHVs and ETHVs; 2: ITHA, entering the cornu ammonis by the hippocampal sulcus; 3: the branches directly generating from LHV to supply CA1; 4/5: the branches of ITHV respectively supplying CA2 and CA3; 6: ETHV, entering the dentate gyrus by penetrating the fimbriodentate sulcus. In cornu ammonis: so, stratum oriens; sp, stratum pyramidale; sr, stratum radiatum. In dentate gyrus: ml, molecular layer; po, polymorph layer; gcl, granule cell layer. (J) Representative individual hippocampal vessel the same as that shown in (H) was manually segmented, with vessel diameters coded by colors. The transverse hippocampal vessel appears like an arch with microvessels extending from its both dorsal and ventral sides. (1–4) The virtual vascular endoscopic tracking of the individual transverse hippocampal vessel. (1) Initial entry into the vessel. Subsequent images along the tracking pathway are shown in (2)–(4), revealing endovascular structures. The scale bar in each endoscopic image indicates the magnification of field of view.
Figure 3.
Figure 3.
Comparison of the hippocampal vasculature between WT and Tg-AD mice. (A), (C), (D) and (G) WT group; (B), (E), (F) and (H) Tg-AD group. (A) and (B) Representative coronal view of the vascular network of the right hippocampus and its neighboring brain regions in WT and Tg-AD mice. The brain contours in the top-right corner indicate that the coronal slices between the two dotted lines were reconstructed. Boxed areas in the cortex ((C) and (E)) and hippocampus ((D) and (F)) are shown at a higher magnification. (G) and (H) Representative sectional views of the hippocampal vasculature perpendicular to the longitudinal hippocampal axis. The dotted lines in the top-right corner denote the data displayed in sectional view.
Figure 4.
Figure 4.
Quantitative comparison of the hippocampal vasculature between WT and Tg-AD mice. (A) and (B) The same sections as shown in Fig. 3G and H are displayed with somata, vessels and nerve processes together to facilitate the demarcation of hippocampal sub-regions. The hippocampal vasculatures were divided into four subareas based on the hippocampal functional partition including the subiculum (Sub), CA1–2, CA3 and molecular layer of the dentate gyrus (DG-ml). The quantitative analyses of the main morphometric parameters were conducted on the basis of these segmented sub-regions. (C–F) Quantitative analysis of the hippocampal vascular network. Columns and boxes in blue are the WT group; columns or boxes in red are the Tg-AD group. (C) Comparison of the mean diameter, volume fraction and length density in the whole hippocampus between WT and Tg-AD mice (unpaired t-test; *P < 0.05; ***P < 0.001; ns, non-significant, P > 0.05; n = 3 mice per group). (D–F) Comparison of the mean diameter, volume fraction and length density in the four segmented sub-regions between the WT and Tg-AD mice (unpaired t-test; *P < 0.05; **P < 0.01; ***P < 0.001; ns, non-significant, P > 0.05; n = 2 sections per mouse for three WT mice and three Tg-AD mice). Error bars in (C) represent s.e.m.; error bars in (D–F) represent the greatest value (above) and lowest value (below).
Figure 5.
Figure 5.
Analysis of the morphology and architecture in an individual hippocampal vessel. (A), (C), (E) and (G) WT group; (B), (D), (F) and (H) Tg-AD group. (A) and (B) The two middle hippocampal regions were extracted from the WT and Tg-AD mice in similar spatial positions. (C) and (D) Enlarged views of the boxes in (A) and (B) show the distal end of the transverse hippocampal vessels. (E) and (F) The individual hippocampal vessels were segmented manually from (A) and (B) and displayed from a lateral view, with the vessel diameters coded by colors. (G) and (H) The top view of the same vessel as shown in (E) and (F). The divergent angle of the single vascular branch is 38.1° in the WT group and 27.8° in the Tg-AD group. (I) and (J) Columns or lines in blue are the WT group; columns or lines in red are the Tg-AD group. (I) Quantitative comparison of the percentage of the number of vascular segments with different diameters (0–20 μm) between the WT and Tg-AD mice. The 98.3% number of the vascular segments was below 5 μm in the Tg-AD mice and 95.7% in the WT mice (unpaired t-test; *P < 0.05; **P < 0.01; ns, non-significant; P > 0.05; n = 3 mice per group). (J) Quantitative comparison of the average branching angles with different branch levels between the WT and Tg-AD mice. The average branch angles in the Tg-AD mice were significantly decreased beginning at branch level 5 (unpaired t-test; *P < 0.05; **P < 0.01; ***P < 0.001; ns, non-significant, P > 0.05; n = 3 mice per group). Error bars in (I) and (J) represent s.d.
Figure 6.
Figure 6.
Virtual endoscopic views in the lumen of single hippocampal vessels. (A) and (B) Representative individual hippocampal vessels the same as shown in Fig. 5E and F were used to illustrate the virtual vascular endoscopy for viewing the vessel lumen, with vessel diameters coded by colors and representative viewpoints marked by the white number (C1–5 for WT mice; D1–5 for Tg-AD mice). (1–5) The virtual vascular endoscopic tracking of individual transverse hippocampal vessels in WT mice (C) and Tg-AD mice (D). (1) Initial entry into the vessels. Subsequent images along the tracking pathway are shown in (2)–(5), revealing different endovascular structures between WT and Tg-AD mice. The scale bar in each endoscopic image indicates the magnification of field of view.

References

    1. Martin P, Anders W, Maëlenn G. World Alzheimer report. In: the global impact of dementia. Alzheimer's Disease International. London: ADI, 2015.
    1. Sugino H, Watanabe A, Amada Net al. . Global trends in Alzheimer disease clinical development: increasing the probability of success. Clin Ther 2015; 37: 1632–42. - PubMed
    1. Wang YJ. Lessons from immunotherapy for Alzheimer disease. Nat Rev Neurol 2014; 10: 188–9. - PubMed
    1. Sharma P, Srivastava P, Seth Aet al. . Comprehensive review of mechanisms of pathogenesis involved in Alzheimer's disease and potential therapeutic strategies. Prog Neurobiol 2019; 174: 53–89. - PubMed
    1. Cao J, Hou J, Ping Jet al. . Advances in developing novel therapeutic strategies for Alzheimer's disease. Mol Neurodegener 2018; 13: 64. - PMC - PubMed