

Expansion tomography for large volume tissue imaging with nanoscale resolution
- PMID: 34692204
- PMCID: PMC8515992
- DOI: 10.1364/BOE.431696
Expansion tomography for large volume tissue imaging with nanoscale resolution
Abstract
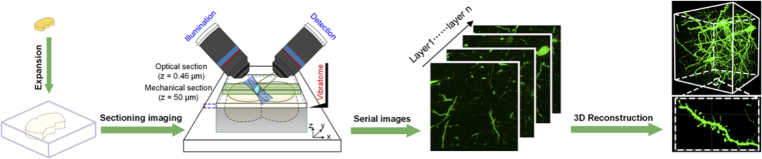
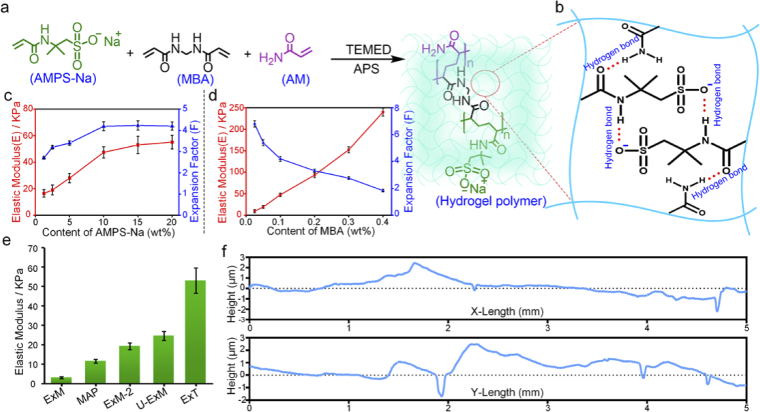
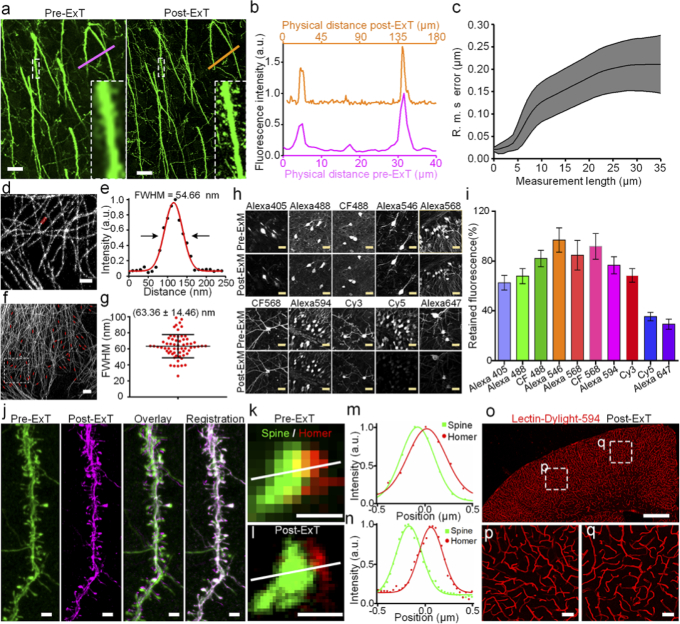
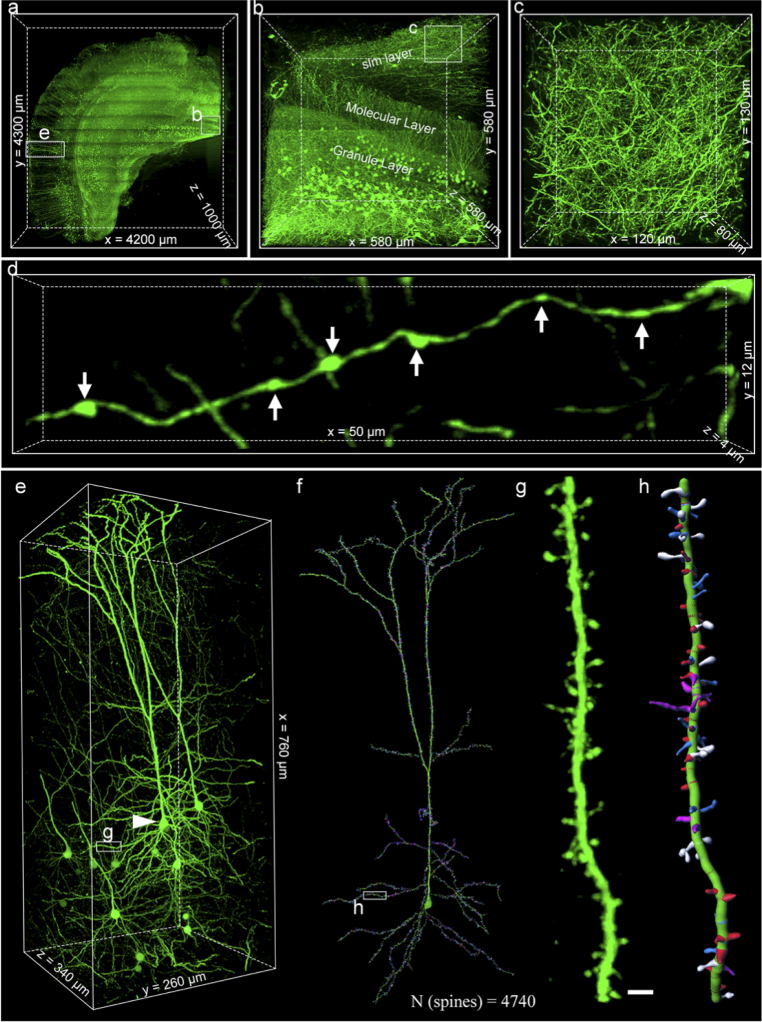
Expansion microscopy enables conventional diffraction limit microscopy to achieve super-resolution imaging. However, the enlarged tissue lacks an objective lens with sufficient working distance that can image tissues with whole-brain-scale coverage. Here, we present expansion tomography (ExT) to solve this problem. We have established a modified super-absorbent hydrogel (ExT gel) that possesses high mechanical strength and enables serial sectioning. ExT gel enables tissue and cell imaging and is compatible with various fluorescent labeling strategies. Combining with the high-throughput light-sheet tomography (HLTP) system, we have shown the capability of large volume imaging with nanoscale resolution of mouse brain intact neuronal circuits. The ExT method would allow image samples to support super-resolution imaging of intact tissues with virtually unlimited axial extensions.
© 2021 Optical Society of America under the terms of the OSA Open Access Publishing Agreement.
Conflict of interest statement
The authors declare no conflict of interest.
Figures
Similar articles
-
Light-sheet fluorescence expansion microscopy: fast mapping of neural circuits at super resolution.Neurophotonics. 2019 Jan;6(1):015005. doi: 10.1117/1.NPh.6.1.015005. Epub 2019 Feb 8. Neurophotonics. 2019. PMID: 30796881 Free PMC article.
-
Continuous imaging of large-volume tissues with a machinable optical clearing method at subcellular resolution.Biomed Opt Express. 2020 Nov 12;11(12):7132-7149. doi: 10.1364/BOE.405801. eCollection 2020 Dec 1. Biomed Opt Express. 2020. PMID: 33408985 Free PMC article.
-
Expansion microscopy: A powerful nanoscale imaging tool for neuroscientists.Neurobiol Dis. 2021 Jul;154:105362. doi: 10.1016/j.nbd.2021.105362. Epub 2021 Apr 2. Neurobiol Dis. 2021. PMID: 33813047 Free PMC article. Review.
-
Comparison of Light-Sheet Fluorescence Microscopy and Fast-Confocal Microscopy for Three-Dimensional Imaging of Cleared Mouse Brain.Methods Protoc. 2023 Nov 10;6(6):108. doi: 10.3390/mps6060108. Methods Protoc. 2023. PMID: 37987355 Free PMC article.
-
Tissue Clearing and Expansion Methods for Imaging Brain Pathology in Neurodegeneration: From Circuits to Synapses and Beyond.Front Neurosci. 2020 Oct 5;14:914. doi: 10.3389/fnins.2020.00914. eCollection 2020. Front Neurosci. 2020. PMID: 33122983 Free PMC article. Review.
Cited by
-
Rapid lightsheet fluorescence imaging of whole Drosophila brains at nanoscale resolution by potassium acrylate-based expansion microscopy.Nat Commun. 2024 Dec 30;15(1):10911. doi: 10.1038/s41467-024-55305-8. Nat Commun. 2024. PMID: 39738207 Free PMC article.
-
GelMap: intrinsic calibration and deformation mapping for expansion microscopy.Nat Methods. 2023 Oct;20(10):1573-1580. doi: 10.1038/s41592-023-02001-y. Epub 2023 Sep 18. Nat Methods. 2023. PMID: 37723243 Free PMC article.
-
Visualizing cellular and tissue ultrastructure using Ten-fold Robust Expansion Microscopy (TREx).Elife. 2022 Feb 18;11:e73775. doi: 10.7554/eLife.73775. Elife. 2022. PMID: 35179128 Free PMC article.
-
Expansion-assisted selective plane illumination microscopy for nanoscale imaging of centimeter-scale tissues.Elife. 2025 Jun 30;12:RP91979. doi: 10.7554/eLife.91979. Elife. 2025. PMID: 40586775 Free PMC article.
-
Expanding boundaries - a cell biologist's guide to expansion microscopy.J Cell Sci. 2024 Apr 1;137(7):jcs260765. doi: 10.1242/jcs.260765. Epub 2024 Apr 17. J Cell Sci. 2024. PMID: 38629499 Free PMC article. Review.
References
-
- Oh S. W., Harris J. A., Ng L., Winslow B., Cain N., Mihalas S., Wang Q., Lau C., Kuan L., Henry A. M., Mortrud M. T., Ouellette B., Nguyen T. N., Sorensen S. A., Slaughterbeck C. R., Wakeman W., Li Y., Feng D., Ho A., Nicholas E., Hirokawa K. E., Bohn P., Joines K. M., Peng H., Hawrylycz M. J., Phillips J. W., Hohmann J. G., Wohnoutka P., Gerfen C. R., Koch C., Bernard A., Dang C., Jones A. R., Zeng H., “A mesoscale connectome of the mouse brain,” Nature 508(7495), 207–214 (2014).10.1038/nature13186 - DOI - PMC - PubMed
-
- Abbe E., “Beiträge zur Theorie des Mikroskops und der mikroskopischen Wahrnehmung,” Arch. Mikrosk. Anat. 9(1), 413–468 (1873).10.1007/BF02956173 - DOI
LinkOut - more resources
Full Text Sources