. 2021 Aug 16;12(9):5670-5690.
doi: 10.1364/BOE.432687. eCollection 2021 Sep 1.

Optimization of data acquisition operation in optical tomography based on estimation theory

Affiliations

Optimization of data acquisition operation in optical tomography based on estimation theory

Mahshad Javidan et al. Biomed Opt Express. .

Abstract

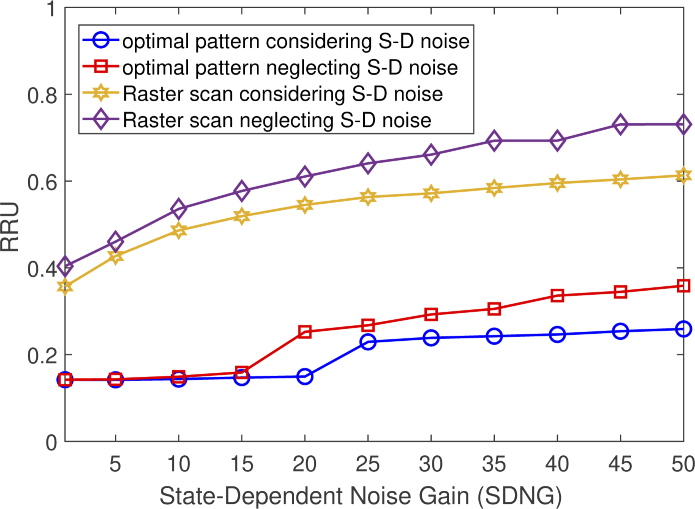
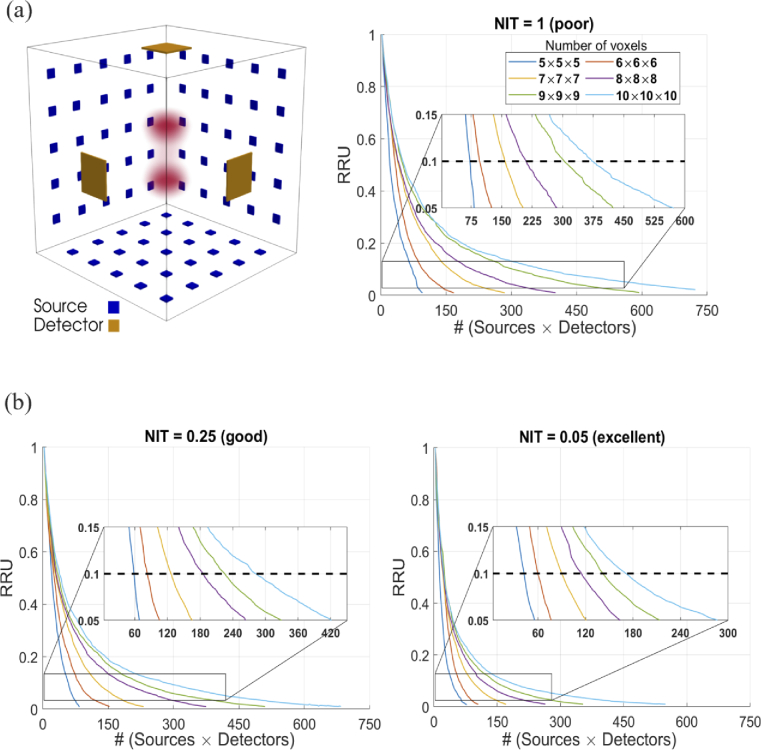
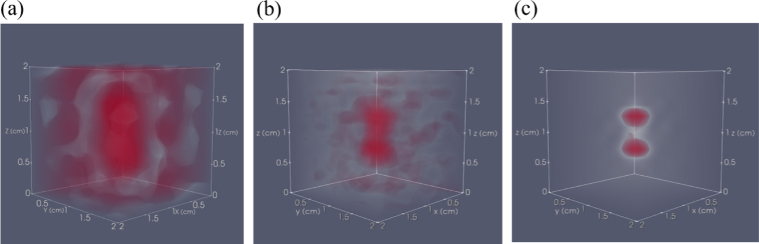
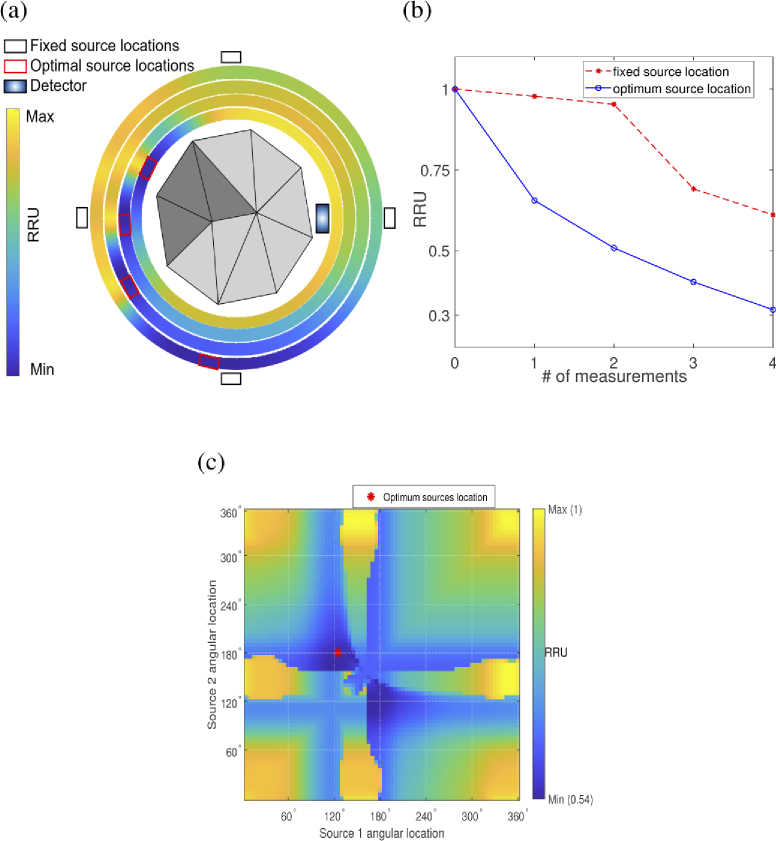
The data acquisition process is occasionally the most time consuming and costly operation in tomography. Currently, raster scanning is still the common practice in making sequential measurements in most tomography scanners. Raster scanning is known to be slow and such scanners usually cannot catch up with the speed of changes when imaging dynamically evolving objects. In this research, we studied the possibility of using estimation theory and our prior knowledge about the sample under test to reduce the number of measurements required to achieve a given image quality. This systematic approach for optimization of the data acquisition process also provides a vision toward improving the geometry of the scanner and reducing the effect of noise, including the common state-dependent noise of detectors. The theory is developed in the article and simulations are provided to better display discussed concepts.


Conflict of interest statement

The authors declare no conflicts of interest.

Figures

Fig. 1.
Fig. 1.
Schematic of a typical scanner. The medium under test is placed between an array of S sources and D detectors and the medium is divided to V number of voxels. The energy from source j at r¯sj propagates to all voxels including voxel k at r¯vk. The energy is scattered by the medium and then detected by all detectors including detector i at r¯di.
Fig. 2.
Fig. 2.
Expression of green florescence protein (GFP) following the procedure for viral gene delivery. Controlled amount of the solution that contains the virus was injected in the cortical area about 500 micron inside the tissue. The solution diffused into the tissue and the virus delivered the genetic construct to the cells which led to the expression of GFP in excitatory neurons. The volume and position of injection can provide a good estimation of the distribution of fluorescence proteins after a given period of time post injection. This information can be used to find the initial estimation prior to any fluorescence tomography test.
Fig. 3.
Fig. 3.
Structure of a 2D circular single-detector scanner and the comparison between computed RRU values for optimal illumination and raster scanning. Following optimal illumination algorithm, one can reconstruct images with superior certainty while taking a smaller number of measurements.
Fig. 4.
Fig. 4.
Effect of noise power on optimal illumination design: (right) structure of a 2D scanner used for the demonstration, (left) the algorithm starts by choosing the first optimal weight vector, W¯1, as close as possible to the first principal component. Since noise power is larger than the uncertainty along the second principal component, the second optimal weight vector, W¯2, chosen by the algorithm is close to the first measurement. In other words, power and distribution of noise suggest that repeating the measurement along the first principal component helps reduce uncertainty more than making the second measurement along the second principal component. This effect leads to superior performance, particularly when noise power is comparable to residual uncertainty along some directions. σp1 and σp2 are the variances along the first and second principal components, respectively. Noise variance, σn1 is uniform in all directions.
Fig. 5.
Fig. 5.
Effect of state-dependent noise on final RRU values plotted as a function of SDNG for four different data acquisition scenarios. Data shows optimal illumination protocol, when state-dependent noise is included in the model, outperforms other algorithms.
Fig. 6.
Fig. 6.
Analysis of main factors impacting resolution in the statistical framework: (a) geometry of the cubical scanner, (b) relationship between the quality of prior information, number of sources-detectors, and achievable resolution.
Fig. 7.
Fig. 7.
Reconstruction of two spherical objects: (a) no prior information, (b) poor prior information about the location/distribution of targets, (c) adequate prior information, quality and resolution are significantly improved.
Fig. 8.
Fig. 8.
Effect of source location on acquired information: (a) First, a source rotates around the scanner and RRU is computed at each location. Rings show color-coded values of RRU for each angular position. Red rectangles show locations where RRU is minimum. Next, RRU was computed for fixed predefined locations (black). (b) Quantitative analysis of experiment of panel (a). Selecting optimal location results in a considerable decrease in RRU, (c) Color map of RRU computed for every two combinations of 72 source locations. The red marker indicates the optimal location.
Fig. 9.
Fig. 9.
(a) Digital mouse phantom simulation setup. (b) Cross-section of digital mouse phantom at z = 12mm. (c) effect of prior information on reconstruction error in three different scanning protocols. (d) Cross-sections of fluorescence targets reconstructed via raster scanning (top row), random scanning (middle row), and optimal pattern method (bottom row) shown for different number of measurements. The proposed method is able to reconstruct while taking less number of measurements.

Similar articles

Cited by

  • Optimal data acquisition in tomography.
    Javidan M, Esfandi H, Anderson R, Pashaie R. Javidan M, et al. J Opt Soc Am A Opt Image Sci Vis. 2023 Dec 1;40(12):2259-2276. doi: 10.1364/JOSAA.506113. J Opt Soc Am A Opt Image Sci Vis. 2023. PMID: 38086034 Free PMC article.

References

    1. Sabir S., Kim C., Cho S., Heo D., Kim K. H., Ye J. C., Cho S., “Sampling scheme optimization for diffuse optical tomography based on data and image space rankings,” J. Biomed. Opt. 21(10), 106004 (2016).10.1117/1.JBO.21.10.106004 - DOI - PubMed
    1. Belanger S., Abran M., Intes X., Casanova C., Lesage F., “Real-time diffuse optical tomography based on structured illumination,” J. Biomed. Opt. 15(1), 016006 (2010).10.1117/1.3290818 - DOI - PubMed
    1. Ripoll J., “Hybrid Fourier-real space method for diffuse optical tomography,” Opt. Lett. 35(5), 688–690 (2010).10.1364/OL.35.000688 - DOI - PubMed
    1. Ducros N., Dandrea C., Valentini G., Rudge T., Arridge S., Bassi A., “Full-wavelet approach for fluorescence diffuse optical tomography with structured illumination,” Opt. Lett. 35(21), 3676–3678 (2010).10.1364/OL.35.003676 - DOI - PubMed
    1. Joshi A., Bangerth W., Hwang K., Rasmussen J., Sevick-Muraca E. M., “Plane-wave fluorescence tomography with adaptive finite elements,” Opt. Lett. 31(2), 193–195 (2006).10.1364/OL.31.000193 - DOI - PubMed

LinkOut - more resources