. 2021 Aug 24;12(9):5812-5828.
doi: 10.1364/BOE.433240. eCollection 2021 Sep 1.

Disassembly of microtubules by intense terahertz pulses

Affiliations

Disassembly of microtubules by intense terahertz pulses

Cameron M Hough et al. Biomed Opt Express. .

Abstract

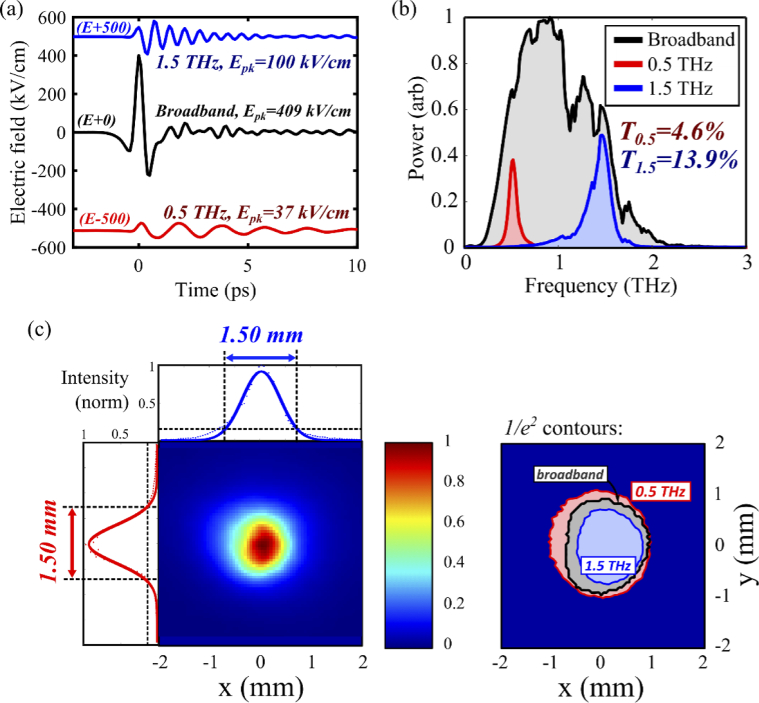
The biological effects of terahertz (THz) radiation have been observed across multiple levels of biological organization, however the sub-cellular mechanisms underlying the phenotypic changes remain to be elucidated. Filamentous protein complexes such as microtubules are essential cytoskeletal structures that regulate diverse biological functions, and these may be an important target for THz interactions underlying THz-induced effects observed at the cellular or tissue level. Here, we show disassembly of microtubules within minutes of exposure to extended trains of intense, picosecond-duration THz pulses. Further, the rate of disassembly depends on THz intensity and spectral content. As inhibition of microtubule dynamics is a mechanism of clinically-utilized anti-cancer agents, disruption of microtubule networks may indicate a potential therapeutic mechanism of intense THz pulses.


Conflict of interest statement

The authors declare no conflicts of interest.

Figures

Fig. 1.
Fig. 1.
Microtubule structure and fluorescence microscopy image. (a) Bound αβ-tubulin dimers comprise the hydrogen-bonded protofilaments [8]. 13 protofilaments laterally bind to form a hollow cylindrical polymer with a 25 nm diameter. Green outlines indicate a tubulin dimer that comprises a protofilament, and a single protofilament that comprises the polymerized MT. (b) Fluorescence image of rhodamine-labelled polymerized microtubules in solution, with an average length of 10 μm. The inset shows a zoomed window of polymerized MTs in a 20 μm square window.
Fig. 2.
Fig. 2.
THz source generation and exposure schematics. (a) The intense THz pulse source for tilted-pulse-front optical rectification in lithium niobate (LN, LiNbO3), using an 1800mm-1 reflective diffraction grating (RDG) and a pair of 4f-imaging lenses (L1 and L2), as described in [39]. Cross-absent bandpass filters (BPF) are used to isolate individual frequency bands. The THz beam is focused to either the sample location (beam propagating in the +z direction out of the page), or to the EO sampling system (beam in the –x direction) with a rotating gold off-axis parabolic mirror (ROAPM). A fraction of the pump pulse energy from a beamsplitter (BS) is attenuated (AT) and propagated colinearly with the THz beam for EO sampling in gallium phosphide (GaP). (b) The ROAPM is set at 0 (+z, upwards) for through-substrate exposure of MTs in solution. The fluorescence excitation line is focused through the hole in the mirror and propagates to the sample colinearly with the focusing THz beam. The sample fluorescence emission is collected by long-working distance objectives, passed through a 578±16 nm bandpass filter, and analyzed in real-time with a CCD camera. For EO sampling, the ROAPM is set to 90.
Fig. 3.
Fig. 3.
Waveforms and spot areas for the intense THz pulse beam. (a) Broadband and bandpass EO sampled THz waveforms, shifted vertically for clarity. The peak broadband field and pulse energy are 409 kV/cm and 1.2 μJ, respectively. (b) The corresponding power spectra and total energy transmission factors. (c) Pyroelectric camera image of the focused THz spot. Gaussian fits to horizontal (top) and vertical (left) line profiles define the 1/e2 broadband spot size as 1.5×1.5 mm2. The contours (right) represent the 1/e2 boundaries corresponding to the labelled frequency bands. Individual frequency bands that comprise the broadband pulse focus to different areas of space.
Fig. 4.
Fig. 4.
Alignment procedure for light and fluorescence microscopy imaging of the THz focus and sample planes. The horizontal dashed line indicates the THz beam waist. (1) The dish is levelled, and the THz beam focus is located by translating the holder and maximizing pulse energy through a 1 mm pinhole aperture centred over the beam input window. (2) The microscope is centred (x-y) and longitudinally (z) aligned to the THz focus by bringing the alignment aperture used for THz energy measurements into focus in the brightfield FOV. (3) The sample plane for a given substrate is aligned to the THz focus by longitudinally (z) translating the sample holder until a test sample is in focus.
Fig. 5.
Fig. 5.
Real-time fluorescence images of THz-exposed MTs. At low concentration (Ctub, left), MTs are individually resolvable and are stabilized at an average length of ∼10 μm. At high Ctub (right), MTs form large aggregate structures and are not individually resolvable.
Fig. 6.
Fig. 6.
Broadband MT exposure results. (a) High magnification (40x) fluorescence images of low tubulin concentration (0.25 mg/mL) show detailed structural disassembly to individual MTs. A single motion-tracked MT disassembling within 11 minutes of THz exposure. The ImageJ hill-shade algorithm is utilized to enhance edge contrast. (b) Low magnification (10x) images of high tubulin concentration (5 mg/mL) show large-scale disassembly of MT aggregate structures in a varying intensity distribution. The three sets of time-series images correspond to three 100×100 μm2 regions indicated in the THz spot image (right), having approximate energy densities of 80, 50, and 30 μJ/cm2. Greater disassembly is observed in the highest intensity central region. (c) High magnification (40x) and high tubulin concentration (5 mg/mL) show MT aggregates in a nearly uniform intensity FOV. Both time series are separate results with similar pulse energy (1.2 μJ) and peak field (409 kV/cm [top] and 400 kV/cm [bottom]). At larger THz energy and field strengths, significant MT disassembly is observed within 5 min. Red labels highlight regions of MT polymer breakage.
Fig. 7.
Fig. 7.
Analysis and results of MT exposures with varying spectral content. (a) An example image analysis of MT structural change. By converting quantitative fluorescence images (column 1) to a binary image with a common threshold (column 2), the disassembly of MTs over time may be quantified by the change of area fraction with rhodamine signal above a common intensity threshold. The area fractions are determined by algorithmic contours with the ImageJ plugin, “Analyze Particles”. The reduction of area fractions follow an exponential decay curve. (b) Fractional MT area calculated using the procedure in (a) for varying THz bands, with dashed curves representing exponential fits, and τ is the associated characteristic time. Each dataset was normalized to the initial relative MT area. The exponential fit qualities (R2) are 0.99, 0.96, and 0.92 for the broadband, 0.5 THz, and 1.5 THz fits, respectively. An equivalent analysis on unexposed MTs is included for reference. Top: The total pixel intensity of the raw images. The total rhodamine signal of all images does not degrade significantly (<5%) over the exposure duration, indicating the MT area fraction decay is not due to photobleaching. (c) The MT area fraction vs. total dose (J/cm2), which corrects for differences in pulse energy and focused spot area (see Table 1). DX is the characteristic dose for the corresponding curve (eD/DX) . The characteristic total dose for the low-frequency 0.5 THz band (1.4 J/cm2) is significantly lower than both the broadband and high-frequency 1.5 THz band (13 J/cm2 and 23 J/cm2, respectively), indicating frequency-dependence of THz-induced MT disassembly, with greater disassembly induced by low-frequency THz energy (∼0.5 THz).
Fig. 8.
Fig. 8.
Intense THz pulses significantly downregulate several members of tubulin/MT gene families. (a) Volcano plot showing differential expression of the tubulin superfamily and other microtubule-associated genes induced by intense THz pulses in human skin. Dashed lines indicate conventional thresholds of expression significance (|Log2(I/I0)|>0.58, p<0.05). Genes that encode for structural α/β tubulin (TUBA/TUBB) subunits are significantly downregulated. (b) Gene Ontology (GO) analysis of the global expression dataset identifies significant over-representation in eight cytoskeleton-related processes, components, and functions.

References

    1. Fletcher D. A., Mullins R. D., “Cell mechanics and the cytoskeleton,” Nature 463(7280), 485–492 (2010).10.1038/nature08908 - DOI - PMC - PubMed
    1. Philips R., Kondev J., Theriot J., Garcia H., Physical Biology of the Cell (Garland Science, 2013).
    1. Margolis R. L., Wilson L., “Microtubule treadmilling: what goes around comes around,” BioEssays 20(10), 830–836 (1998).10.1002/(SICI)1521-1878(199810)20:10<830::AID-BIES8>3.0.CO;2-N - DOI - PubMed
    1. Ayoub A., Craddock T., Klobukowski M., Tuszynski J., “Analysis of the strength of interfacial hydrogen bonds between tubulin dimers using quantum theory of atoms in molecules,” Biophys. J. 107(3), 740–750 (2014).10.1016/j.bpj.2014.05.047 - DOI - PMC - PubMed
    1. Moix J. M., Parker J. E., Echchgadda I., “Qualitative behavior of the low-frequency vibrational dynamics of microtubules and the surrounding water,” J. Phys. Chem. B 121(14), 3024–3031 (2017).10.1021/acs.jpcb.7b01508 - DOI - PubMed

LinkOut - more resources