. 2021 Oct 6:9:736350.
doi: 10.3389/fcell.2021.736350. eCollection 2021.

Gambogenic Acid Induces Endoplasmic Reticulum Stress in Colorectal Cancer via the Aurora A Pathway

Affiliations

Gambogenic Acid Induces Endoplasmic Reticulum Stress in Colorectal Cancer via the Aurora A Pathway

Cheng Liu et al. Front Cell Dev Biol. .

Abstract

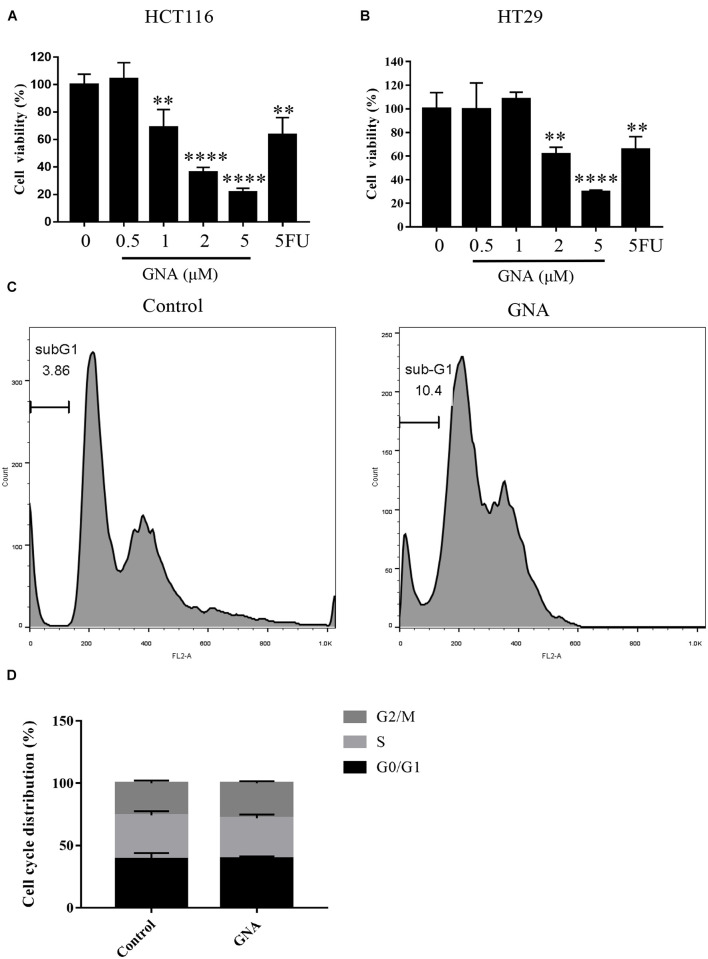
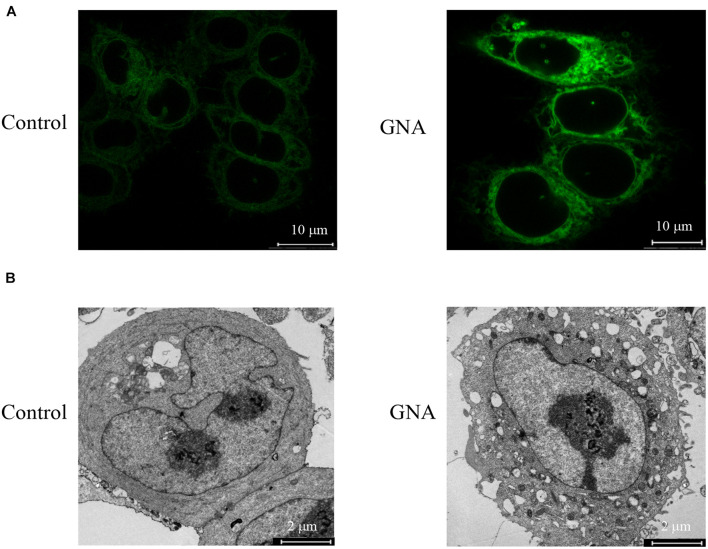
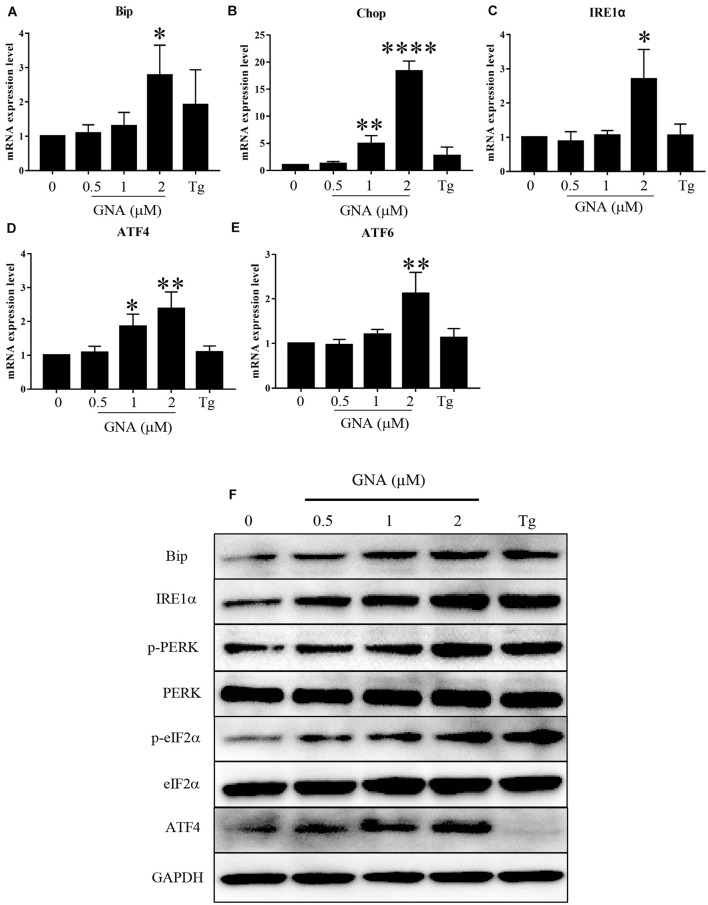
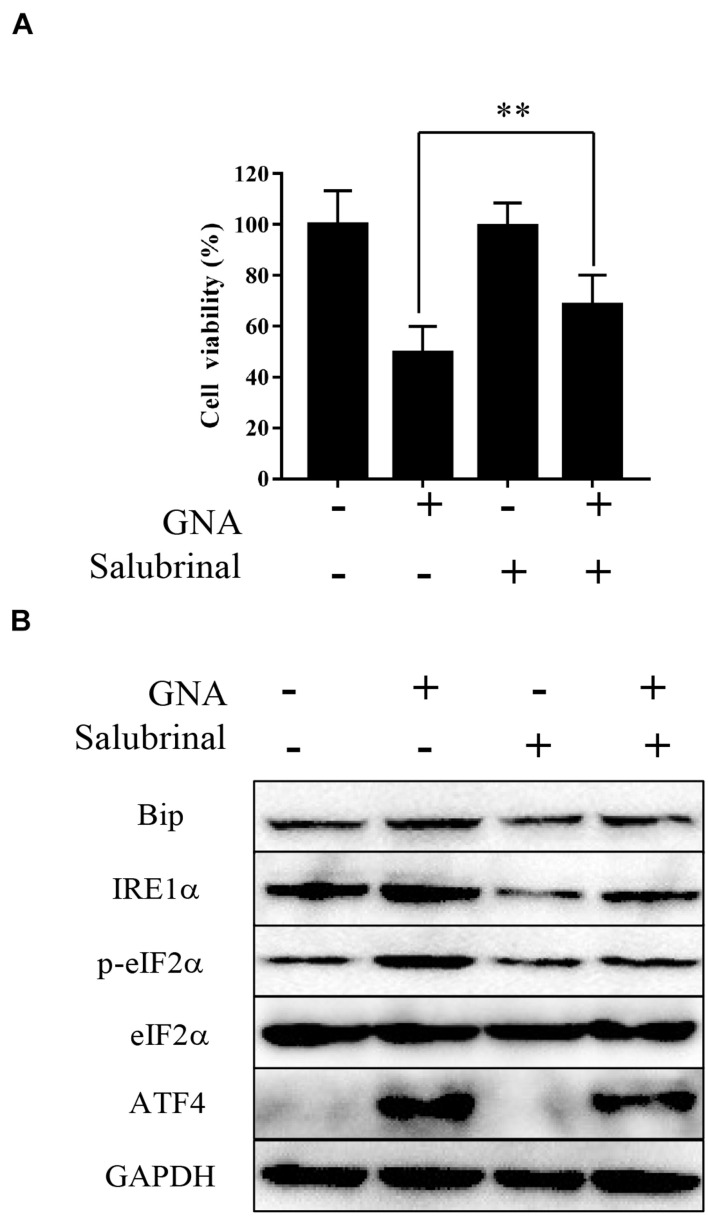
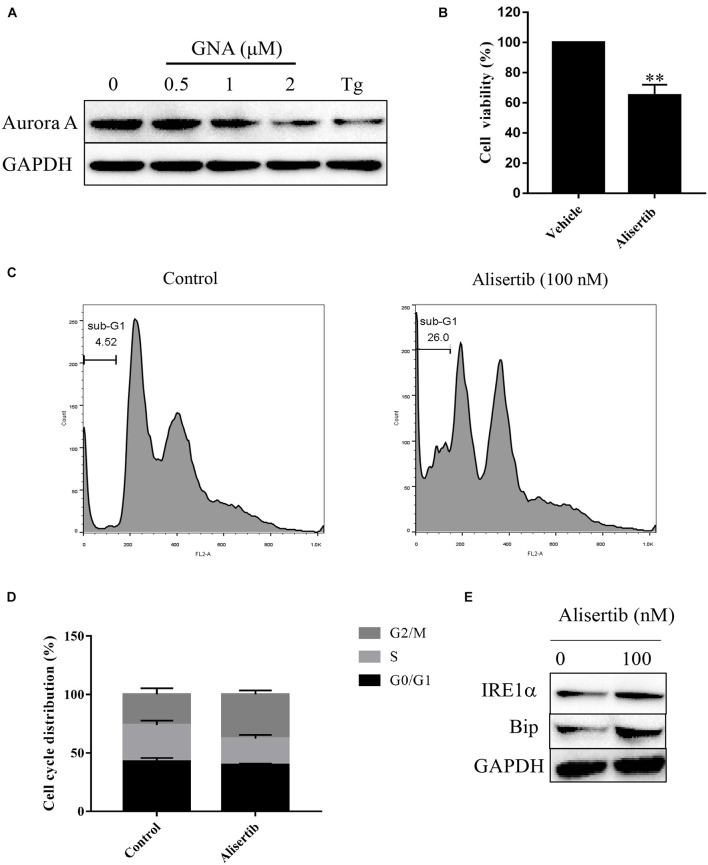
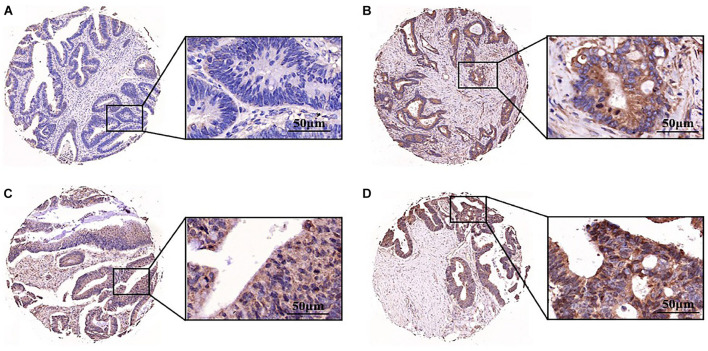
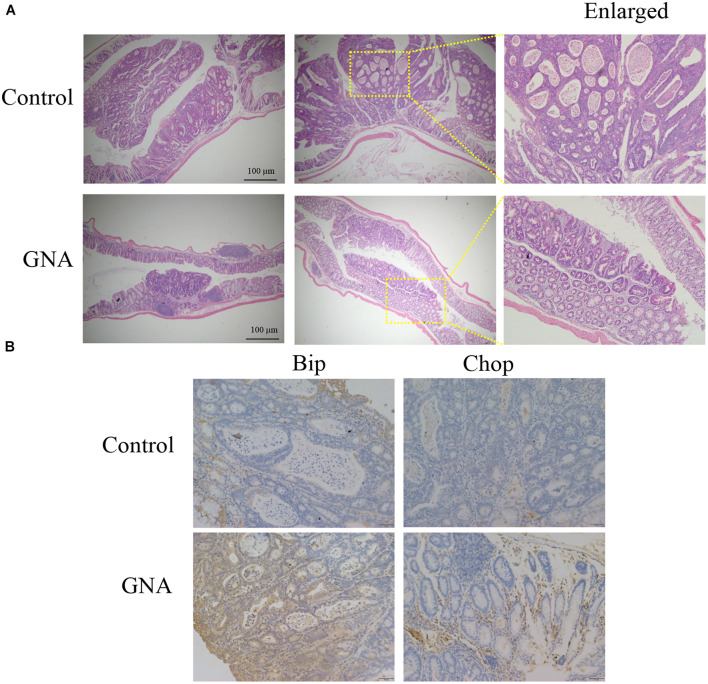
Colorectal cancer (CRC) is one of the most common malignancies in the world and has a poor prognosis. In the present research, gambogenic acid (GNA), isolated from the traditional Chinese medicine gamboge, markedly induced apoptosis and inhibited the proliferation of CRC in vitro and in vivo. Furthermore, GNA triggered endoplasmic reticulum (ER) stress, which subsequently activated inositol-requiring enzyme (IRE) 1α and the eukaryotic translation initiation factor (eIF) 2α pathway. Pretreatment with salubrinal (an eIF2α inhibitor) rescued GNA-induced cell death. Furthermore, GNA downregulated the expression of Aurora A. The Aurora A inhibitor alisertib decreased ER stress. In human colorectal adenocarcinoma tissue, Aurora A was upregulated compared to normal colorectal epithelial nuclei. Furthermore, GNA ameliorated mouse colitis-associated cancer models. Our findings demonstrated that GNA significantly inhibited the proliferation of CRC through activation of ER stress by regulating Aurora A, which indicates the potential of GNA for preventing the progression of CRC.

Keywords: Aurora A; colorectal cancer; endoplasmic reticulum stress; eukaryotic translation initiation factor 2α; gambogenic acid.


Conflict of interest statement

The authors declare that the research was conducted in the absence of any commercial or financial relationships that could be construed as a potential conflict of interest.

Figures

FIGURE 1
FIGURE 1
GNA inhibited cell proliferation and induced apoptosis. HCT116 (A) and HT29 (B) cell viability was assessed using the MTT assay. Cells were treated with different concentrations of GNA (0–5 μM) and 5FU (2 μM) for 24 h. MTT solution was added to the well and incubated for 4 h at 37°C. The precipitate was dissolved in DMSO, and the absorbance was measured at 570 nm. (C,D) Cells were treated with GNA for 24 h, and then the distribution of the cell cycle was detected by flow cytometry after PI staining. The data are presented for at least three independent experiments. The data are presented as the mean ± SD. **P < 0.01; ****P < 0.0001.
FIGURE 2
FIGURE 2
GNA activated ER stress in cells. (A) HCT116 cells were treated with GNA for 6 h, and then incubated with ER-tracker TM Green (1 μM) for 30 min. ER tracker staining fluorescence was observed by confocal laser scanning microscopy (scale bar = 10 μm). (B) HCT116 cells were treated with GNA (1 μM) for 24 h, and then the morphology of the ER was observed under TEM (scale bar = 2 μm). The data are presented for at least three independent experiments.
FIGURE 3
FIGURE 3
GNA promoted UPR in cells. HCT116 cells were treated with different concentrations of GNA (0.5, 1, 2 μM) and thapsigargin (1 μM) for 6 h. (A–E) Total mRNA was extracted, and real-time PCR was used to measure the mRNA expression levels of Bip (A), Chop (B), IRE1α (C), ATF6 (D), ATF4 (E). (F) The expression of BIP, IRE1α, p-PERK, PERK, p-eIF2α, eIF2α, and ATF4 was analysed by western blotting. GAPDH was used as a loading control. The data are presented for at least three independent experiments. The data are presented as the mean ± SD. *P < 0.05; **P < 0.01 and ****P < 0.0001.
FIGURE 4
FIGURE 4
GNA activated ER stress-associated apoptosis by targeting eIF2α. HCT116 cells were treated with GNA (1 μM) after pretreatment with salubrinal (10 μM). (A) After GNA treatment 24 h, MTT assay was used to analyse cell viability. MTT solution was added to the well and incubated for 4 h at 37°C. The precipitate was dissolved in DMSO, and the absorbance was measured at 570 nm. (B) After GNA treatment 6 h, The expression of Bip, IRE1α, p-eIF2α, eIF2α, and ATF4 was analysed by western blotting. The data are presented for at least three independent experiments. **P < 0.01.
FIGURE 5
FIGURE 5
GNA activated ER stress-associated apoptosis through Aurora A. (A) HCT116 cells were treated with different concentrations of GNA (0.5, 1, 2 μM) and thapsigargin (1 μM) for 6 h. The expression of Aurora A was analysed by western blot. (B) HCT116 cells treated with alisertib (100 nM) for 24 h. MTT assay was performed to detect the suppressed proliferation effect of alisertib. (C,D) HCT116 cells treated with alisertib (100 nM) for 24 h. Cells were fixed in 70% ethanol at 4°C, and the cell cycle was examined by flow cytometry after PI staining. (E) The expression of Bip and IRE1α was analysed by western blotting. The data are presented for at least three independent experiments. The data are presented as the mean ± SD. **P < 0.01.
FIGURE 6
FIGURE 6
Aurora A was highly expressed in colorectal adenocarcinoma. Expression pattern of Aurora kinase A in tissue microarray cores of colorectal adenocarcinoma. The staining intensity of the nuclei was evaluated as (A) negative, (B) weak, (C) moderate or (D) strong (scale bar = 50 μm). The data are presented for at least three independent experiments.
FIGURE 7
FIGURE 7
GNA inhibited CRC growth in vivo. An AOM/DSS mouse model of CAC was established in BALB/c mice. Colon tissue was collected after the mice were sacrificed, tissues were fixed in 4% paraformaldehyde and embedded in paraffin, and paraffin blocks were sectioned with a slicer. (A) The tissues were stained with haematoxylin and eosin to observe the tumour area. (B) Tissues were stained with anti-Bip and anti-Chop antibodies for IHC analysis. (scale bar = 100 μm). The data are presented for at least three independent experiments.

Similar articles

Cited by

References

    1. Albayrak D., Doganlar O., Erdogan S., Merakli M., Dogan A., Turker P., et al. (2021). Naringin combined with NF-kappa B inhibition and endoplasmic reticulum stress induces apoptotic cell death via oxidative stress and the PERK/eIF2 alpha/ATF4/CHOP axis in HT29 colon cancer cells. Biochem. Genet. 59 159–184. 10.1007/s10528-020-09996-5 - DOI - PubMed
    1. Bahar E., Kim H., Yoon H. (2016). ER Stress-mediated signaling: action potential and Ca(2+) as key players. Int. J. Mol. Sci. 17:1558. 10.3390/ijms17091558 - DOI - PMC - PubMed
    1. Belt E. J., Brosens R. P., Delis-van Diemen P. M., Bril H., Tijssen M., van Essen D. F., et al. (2012). Cell cycle proteins predict recurrence in stage II and III colon cancer. Ann. Surg. Oncol. 19(Suppl. 3), S682–S692. 10.1245/s10434-012-2216-7 - DOI - PubMed
    1. Briggs M. D., Dennis E. P., Dietmar H. F., Pirog K. A. (2020). New developments in chondrocyte ER stress and related diseases. F1000Research 9:290. 10.12688/f1000research.22275.1 - DOI - PMC - PubMed
    1. Carvalho B., Postma C., Mongera S., Hopmans E., Diskin S., van de Wiel M. A., et al. (2009). Multiple putative oncogenes at the chromosome 20q amplicon contribute to colorectal adenoma to carcinoma progression. Gut 58 79–89. 10.1136/gut.2007.143065 - DOI - PubMed

LinkOut - more resources