. 2021 Oct 8:8:694357.
doi: 10.3389/fvets.2021.694357. eCollection 2021.

Dietary Energy Level Impacts the Performance of Donkeys by Manipulating the Gut Microbiome and Metabolome

Affiliations

Dietary Energy Level Impacts the Performance of Donkeys by Manipulating the Gut Microbiome and Metabolome

Chongyu Zhang et al. Front Vet Sci. .

Abstract

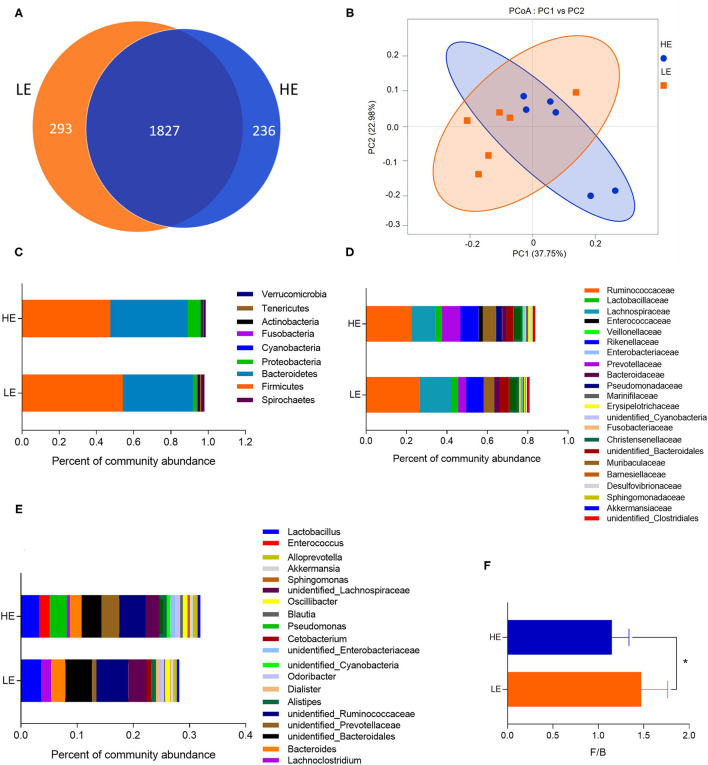
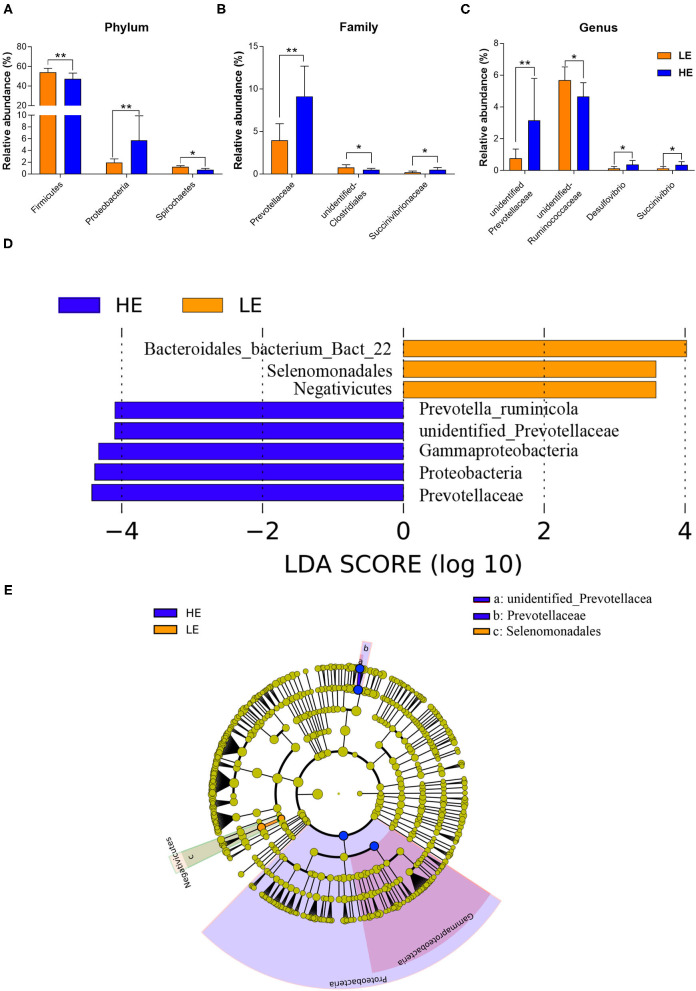
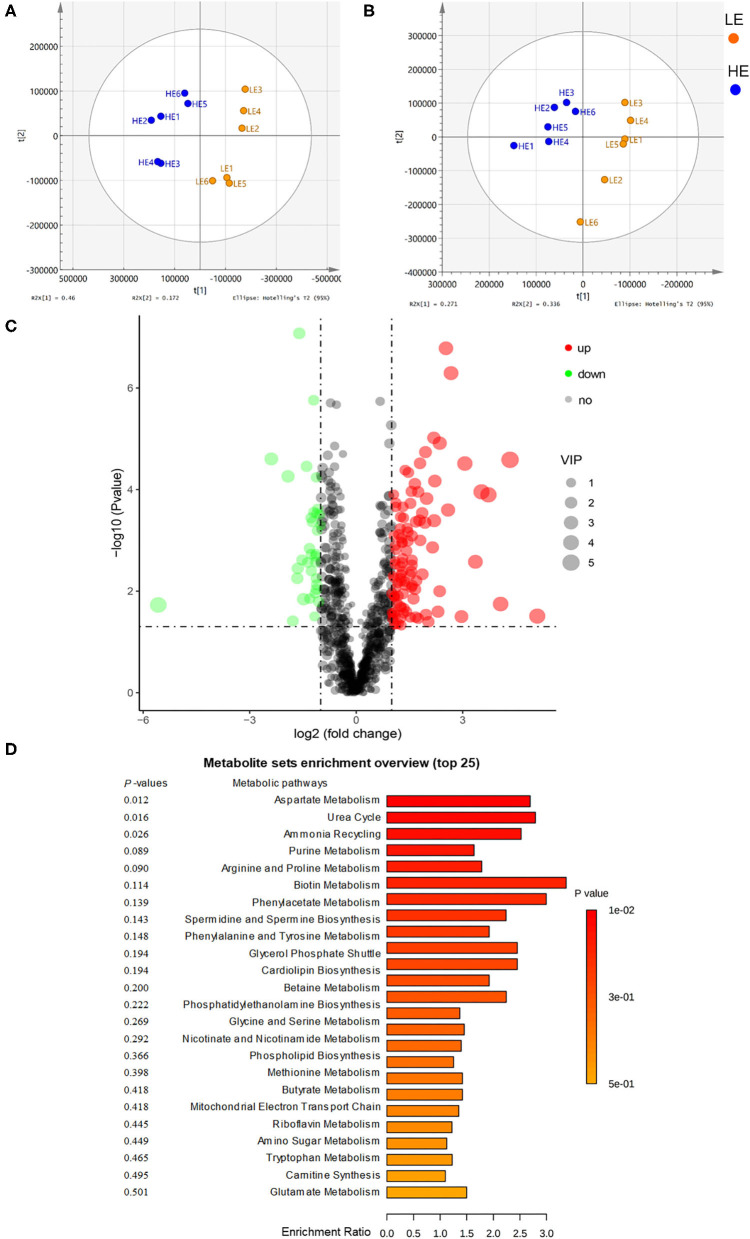
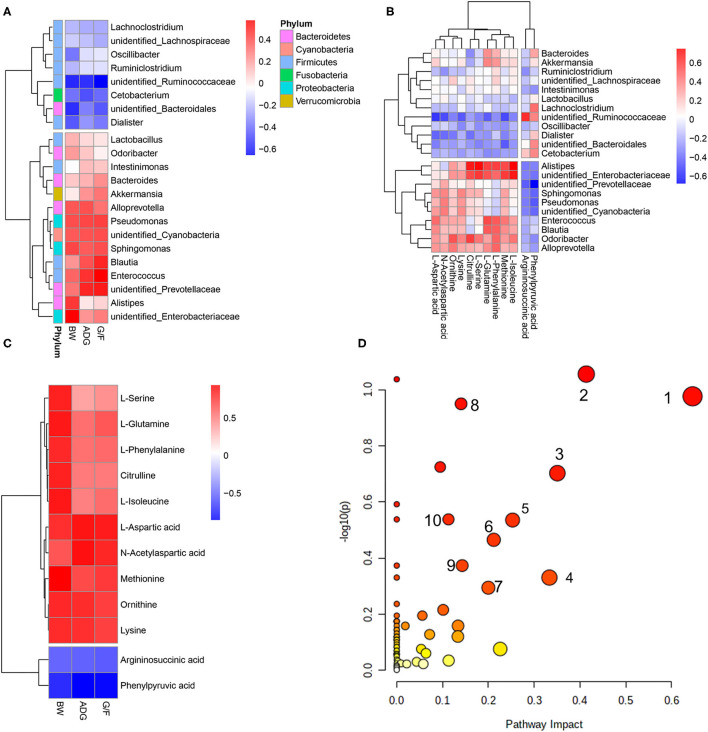
Considerable evidence suggests that dietary energy levels and gut microbiota are pivotal for animal health and productivity. However, little information exists about the correlations among dietary energy level, performance, and the gut microbiota and metabolome of donkeys. The objective of this study was to investigate the mechanisms by which dietary energy content dictates the growth performance by modulating the intestinal microbiome and metabolome of donkeys. Thirty-six nine-month-old male Dezhou donkeys with similar body weights were randomly assigned to two groups fed low- or high-energy diets (LE or HE). The results showed that donkeys fed HE had increased (p < 0.05) the average daily gain (ADG) and feed efficiency (G/F) compared with those that received LE diet. The gut microbiota in both groups was dominated by the phyla Firmicutes and Bacteroidetes regardless of the dietary energy level. However, feeding HE to donkeys significantly decreased (p < 0.05) the ratio of Firmicutes to Bacteroidetes (F/B). Compared to the LE group, feeding HE specifically increased the abundances of unidentified_Prevotellaceae (p = 0.02) while decreasing the richness of unidentified_Ruminococcaceae (p = 0.05). Compared to the LE group, feeding the HE diet significantly (p < 0.05) upregulated certain metabolic pathways involving the aspartate metabolism and the urea cycle. In addition, the increased bacteria and metabolites in the HE-fed group exhibited a positive correlation with improved growth performance of donkeys. Taken together, feeding the HE diet increased the richness of Prevotellaceae and upregulated growth-related metabolic pathways, which may have contributed to the ameliorated growth performance of donkeys. Thus, it is a recommendable dietary strategy to feed HE diets to fattening donkeys for superior product performance and feed efficiency.

Keywords: digestible energy; donkey; growth performance; metabolome; microbiome.


Conflict of interest statement

The authors declare that the research was conducted in the absence of any commercial or financial relationships that could be construed as a potential conflict of interest.

Figures

Figure 1
Figure 1
The OTU numbers, beta diversity (PCoA plot), and the relative abundances at the phylum, family, and genus levels of the rectal microbiota of donkeys fed LE or HE diet. (A) Venn diagram of OTUs in the rectal microbiota; (B) principal coordinate analysis (PCoA). The relative abundances of bacteria on the right in each group at the (C) phylum, (D) family, and (E) genus levels. (F) The ratio of Firmicutes and Bacteroidetes. LE and HE represent samples collected in the rectum from donkeys fed LE or HE diet. * means significant difference between the HE and LE group (p < 0.05). Only microbes that have a mean relative abundance of more than 0.5% are displayed.
Figure 2
Figure 2
The relative abundances of rectal microbiota that was significantly different between the LE and HE groups at the (A) phylum, (B) family, and (C) genus levels. Only microbes that had a relative abundance of more than 0.1% were compared. Linear discriminant analysis (LDA) value distributed histogram and cladogram of different microorganisms (LDA score > 3.5). (D) Linear discriminant analysis (LDA) value distributed histogram. (E) Cladogram constructed to visualize the microbial community relative abundance data at rectum samples between the LE and HE groups. Difference was declared to be statistically significant when *P < 0.05, **P < 0.01.
Figure 3
Figure 3
Orthogonal partial least squares discriminant analysis (OPLS-DA) plot of rectal metabolites in comparisons of the LE and HE groups following (A) positive ion electrospray ionization (ESI+) and (B) negative ion electrospray ionization (ESI–). (C) Identification of the differentially abundant metabolites between the LE and HE groups. Red represents an upregulation, while green represents downregulation; blue represents no change. (D) Enrichment analysis of metabolic pathways.
Figure 4
Figure 4
Correlations between (A) bacteria in which the relative abundance was more than 0.5% and performance parameters, (B) differential metabolites and bacteria, and (C) differential metabolites and pathways that differed significantly (p < 0.05) and performance parameters. Each row in the graph represents a metabolite, each column represents a performance parameter, and each lattice represents a Pearson correlation coefficient. Red represents a positive correlation, while blue represents a negative correlation. (D) Pathway analysis of differential metabolites. The manipulated metabolic pathways are based on the analysis of differentiated ruminal metabolites of donkeys fed HE or LE diets following the Bos Taurus KEGG pathway database. The metabolome view shows all matched pathways according to the p-values from the pathway enrichment analysis and impact values from the topology analysis. The node colors varied from yellow to red, indicating that the metabolites have in the data with different levels of significance. 1, Aspartate metabolism; 2, urea cycle; 3, cardiolipin biosynthesis; 4, glycerol phosphate shuttle; 5, glycerolipid metabolism; 6, arginine and proline metabolism; 7, malate–aspartate shuttle; 8, ammonia recycling; 9, amino sugar metabolism; 10, histidine metabolism.

Similar articles

Cited by

References

    1. Shi T, Hu W, Hou H, Zhao Z, Shang M, Zhang L. Identification and comparative analysis of long non-coding RNA in the skeletal muscle of Two Dezhou Donkey Strains. Genes. (2020) 11:508. 10.3390/genes11050508 - DOI - PMC - PubMed
    1. Polidori P, Vincenzetti S, Cavallucci C, Beghelli D. Quality of donkey meat and carcass characteristics. Meat Sci. (2008) 80:1222–4. 10.1016/j.meatsci.2008.05.027 - DOI - PubMed
    1. Polidori P, Cavallucci C, Beghelli D, Vincenzetti S. Physical and chemical characteristics of donkey meat from Martina Franca breed. Meat Sci. (2009) 82:469–71. 10.1016/j.meatsci.2009.03.001 - DOI - PubMed
    1. Sonnenburg JL, Bäckhed F. Diet–microbiota interactions as moderators of human metabolism. Nature. (2016) 535:56–64. 10.1038/nature18846 - DOI - PMC - PubMed
    1. Wallace RJ, Sasson G, Garnsworthy PC, Tapio I, Gregson E, Bani P, et al. . A heritable subset of the core rumen microbiome dictates dairy cow productivity and emissions. Sci Adv. (2019) 5:eaav8391. 10.1126/sciadv.aav8391 - DOI - PMC - PubMed

LinkOut - more resources