Review
. 2021 Aug 9;2(10):100328.
doi: 10.1016/j.patter.2021.100328. eCollection 2021 Oct 8.

Machine learning applications for therapeutic tasks with genomics data

Affiliations
Review

Machine learning applications for therapeutic tasks with genomics data

Kexin Huang et al. Patterns (N Y). .

Abstract

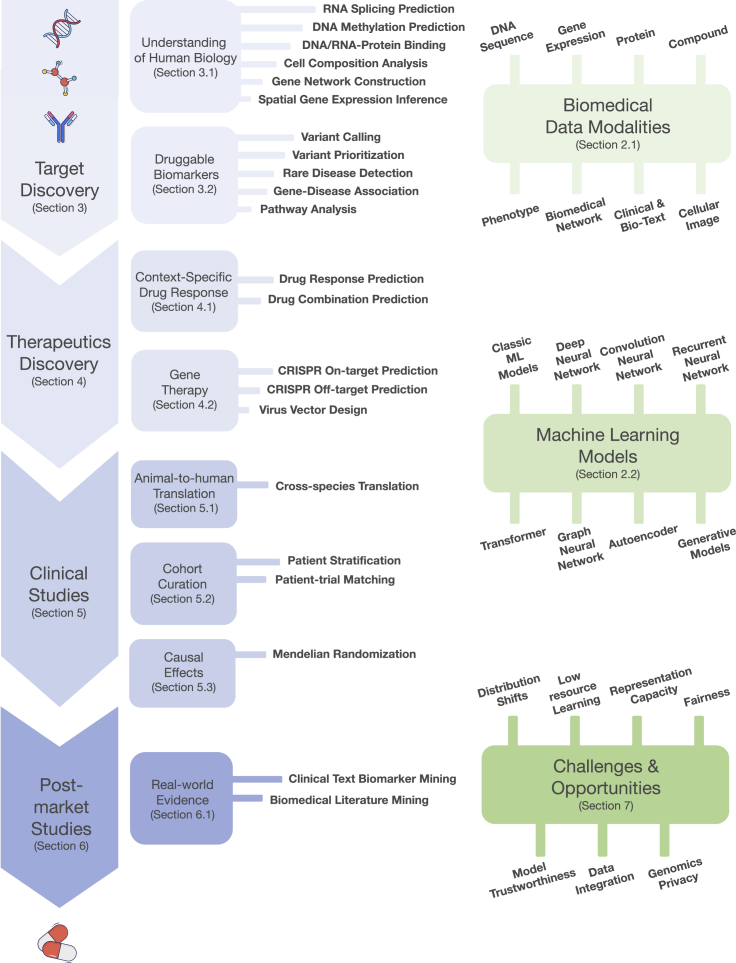
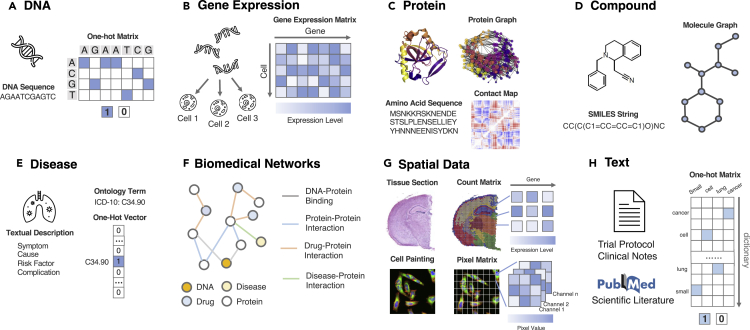
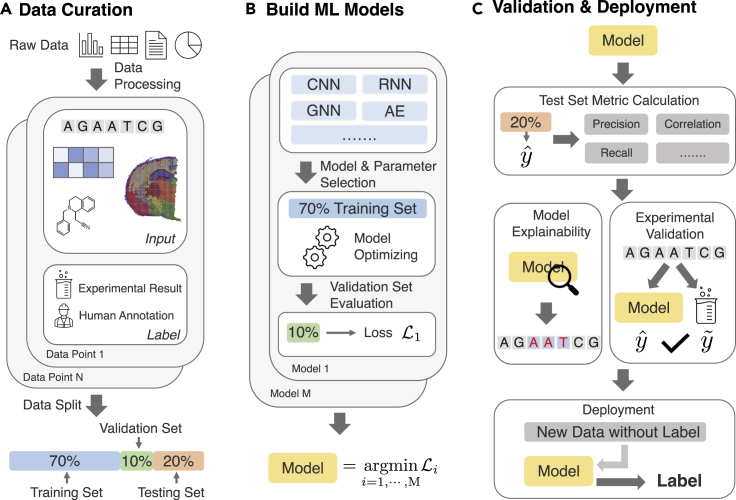
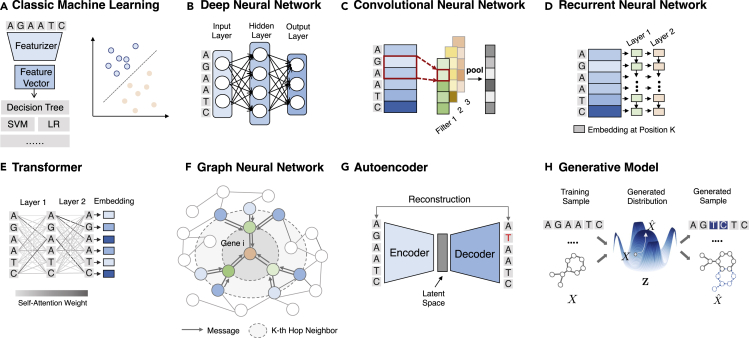
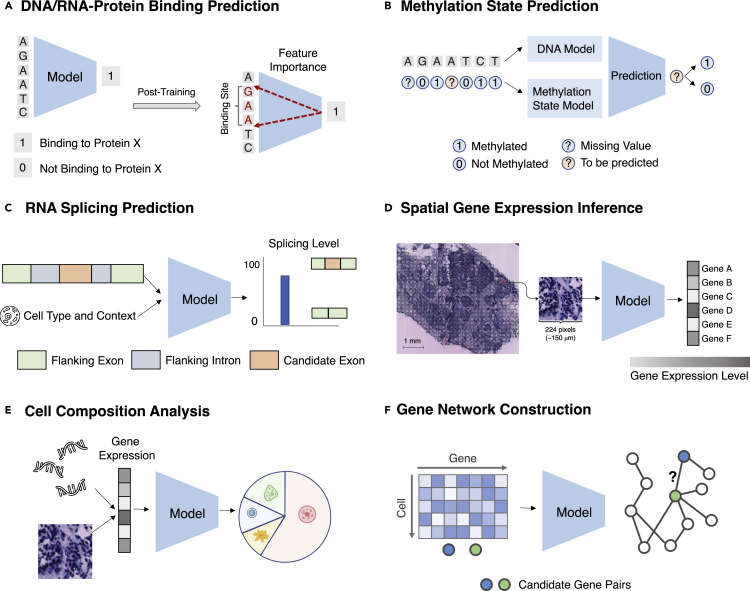
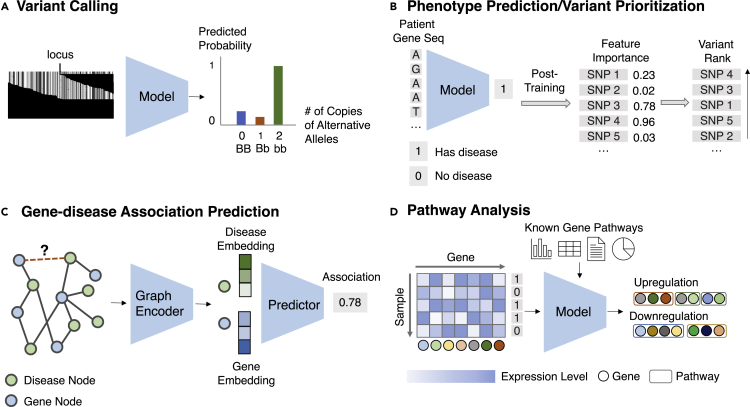
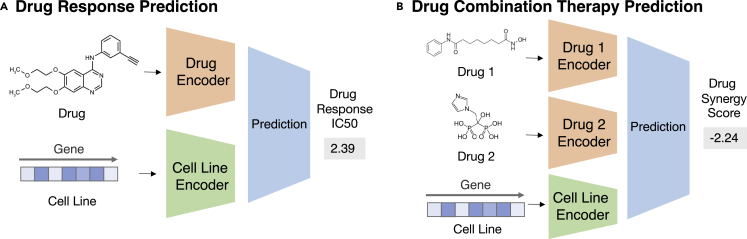
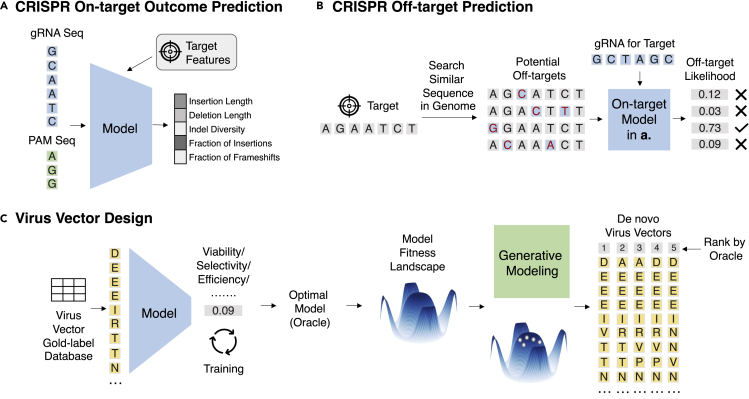
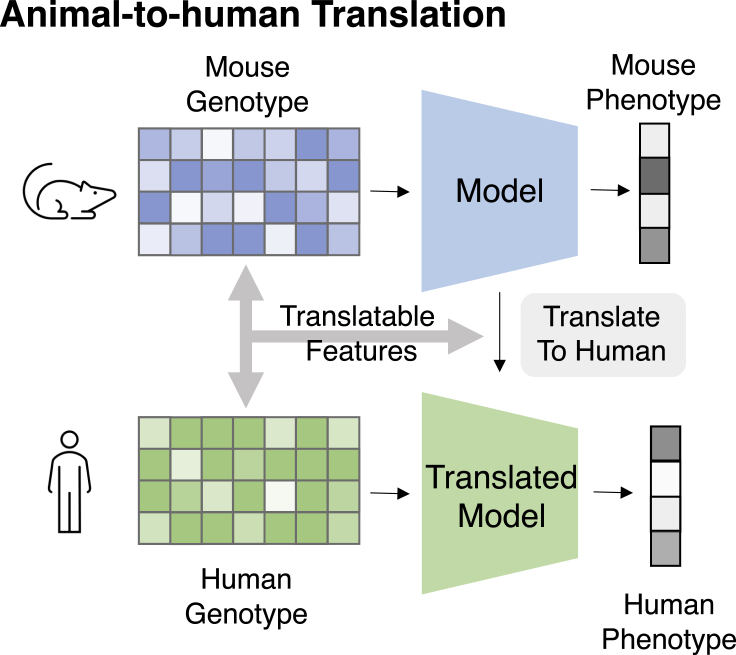
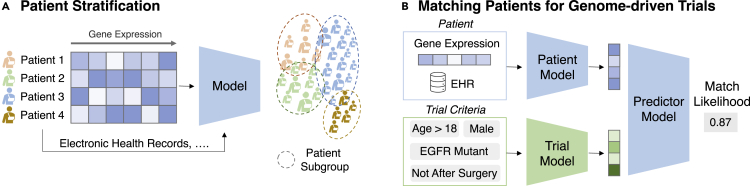
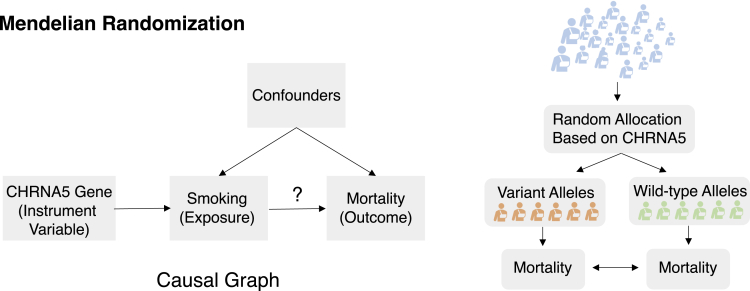
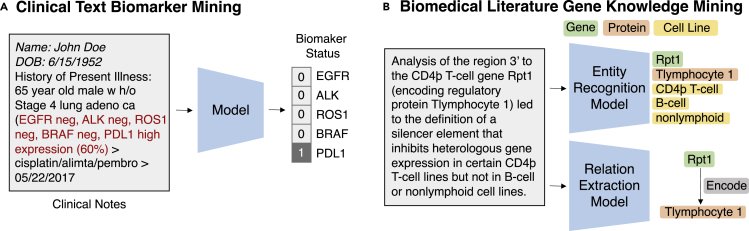
Thanks to the increasing availability of genomics and other biomedical data, many machine learning algorithms have been proposed for a wide range of therapeutic discovery and development tasks. In this survey, we review the literature on machine learning applications for genomics through the lens of therapeutic development. We investigate the interplay among genomics, compounds, proteins, electronic health records, cellular images, and clinical texts. We identify 22 machine learning in genomics applications that span the whole therapeutics pipeline, from discovering novel targets, personalizing medicine, developing gene-editing tools, all the way to facilitating clinical trials and post-market studies. We also pinpoint seven key challenges in this field with potentials for expansion and impact. This survey examines recent research at the intersection of machine learning, genomics, and therapeutic development.

Keywords: genomics; machine learning; therapeutics discovery and development.


Conflict of interest statement

No conflict of interests declared.

Figures

Figure 1
Figure 1
Organization and coverage of this survey Our survey covers a wide range of important ML applications in genomics across the therapeutics pipelines. In addition, we provide a primer on biomedical data modalities and machine learning models. Finally, we identify seven challenges filled with opportunities.
Figure 2
Figure 2
Therapeutics data modalities and their machine learning representation Detailed descriptions of each modality can be found in “genomics-related biomedical data.” (A) DNA sequences can be represented as a matrix where each position is a one-hot vector corresponding to A, C, G, T. (B) Gene expressions are a matrix of real value, where each entry is the expression level of a gene in a context such as a cell. (C) Proteins can be represented in amino acid strings, a protein graph, and a contact map where each entry is the connection between two amino acids. (D) Compounds can be represented as a molecular graph or a string of chemical tokens, which are a depth-first traversal of the graph. (E) Diseases are usually described by textual descriptions and also symbols in the disease ontology. (F) Networks connect various biomedical entities with diverse relations. They can be represented as a heterogeneous graph. (G) Spatial data are usually depicted as a 3D array, where two dimensions describe the physical position of the entity and the third dimension corresponds to colors (in cell painting) or genes (in spatial transcriptomics). (H) Texts are typically represented as a one-hot matrix where each token corresponds to its index in a static dictionary. The protein image is adapted from Gaudelet et al.; the spatial transcriptomics image is adapted from 10x Genomics; the cell painting image is from Charles River Laboratories.
Figure 3
Figure 3
Machine learning for genomics workflow (A) The first step is to curate a machine learning dataset. Raw data are extracted from databases of various sources and are processed into data points. Each data point corresponds to an input of a series of biomedical entities and a label from annotation or experimental results. These data points constitute a dataset, and they are split into three sets. The training set is for the ML model to learn and identify useful and generalizable patterns. The validation set is for model selection and parameter tuning. The testing set is for the evaluation of the final model. The data split could be constructed in a way to reflect real-world challenges. (B) Various ML models can be trained using the training set and tuned based on a quantified metric on the validation set such as loss L that measures how good this model predicts the output given the input. Lastly, we select the optimal model given the lowest loss. (C) The optimal model can then predict on the test set, where various evaluation metrics are used to measure how good the model is on new unseen data points. Models can also be probed with explainability methods to identify biological insights captured by the model. Experimental validation is also common to ensure the model can approximate wet-lab experimental results. Finally, the model can be deployed to make predictions on new data without labels. The prediction becomes a proxy for the label from downstream tasks of interest.
Figure 4
Figure 4
Illustrations of machine learning models Details about each model can be found in “machine learning methods for biomedical data.” (A) Classic machine learning models featurize raw data and apply various models (mostly linear) to classify (e.g., binary output) or regress (e.g., real value output). (B) Deep neural networks map input features to embeddings through a stack of non-linear weight multiplication layers. (C) Convolutional neural networks apply many local filters to extract local patterns and aggregate local signals through pooling. (D) Recurrent neural networks generate embeddings for each token in the sequence based on the previous tokens. (E) Transformers apply a stack of self-attention layers that assign a weight for each pair of input tokens. (F) Graph neural networks aggregate information from the local neighborhood to update the node embedding. (G) Autoencoders reconstruct the input from an encoded compact latent space. (H) Generative models generate novel biomedical entities with more desirable properties.
Figure 5
Figure 5
Task illustrations for the theme “facilitating understanding of human biology” (A) A model predicts whether a DNA/RNA sequence can bind to a protein. After training, one can identify binding sites based on feature importance (see “DNA-protein and RNA-protein binding prediction”). (B) A model predicts missing DNA methylation state based on its neighboring states and DNA sequence (see “methylation state prediction”). (C) A model predicts the splicing level given the RNA sequence and the context (see “RNA splicing prediction”). (D) A model predicts spatial transcriptomics from tissue image (see “spatial gene expression inference”). (E) A model predicts the cell-type compositions from the gene expression (see “cell-composition analysis”). (F) A model constructs a gene regulatory network from gene expressions (see “gene network construction”. Panel (C) is adapted from Xiong et al., and the spatial transcriptomics image in panel (D) is from Bergenstråhle et al.
Figure 6
Figure 6
Task illustrations for the theme “identifying druggable biomarkers” (A) A model predicts the zygosity given a read pileup image (see “variant calling”). (B) A model predicts whether the patient is at risk for the disease given the genomic sequence. After training, feature importance attribution methods assign importance for each variant, which is then ranked and prioritized (see “variant pathogenicity prioritization/phenotype prediction”). (C) A graph encoder obtains embeddings for each disease and gene node, and they are fed into a predictor to predict their association (see “gene-disease association prediction”). (D) A model identifies a set of gene pathways from the gene expression profiles and the known gene pathways (see “pathway analysis and prediction”).
Figure 7
Figure 7
Task illustrations for the theme “improving context-specific drug response” (A) A drug encoder and a cell-line encoder produce embeddings for drug and cell line, respectively, which are then fed into a predictor to estimate drug response (see “drug response prediction”). (B) Drug encoders first map two drugs into embedding, and a cell-line encoder maps a cell line into embeddings. Three embeddings are then fed into a predictor for drug synergy scores (see “drug combination therapy prediction”).
Figure 8
Figure 8
Task illustrations for the theme “improving efficacy and delivery of gene therapy” (A) A model predicts various gene-editing outcomes given the gRNA sequence and the target DNA features (see “CRISPR on-target outcome prediction”). (B) First, a model search through similar sequences to the target DNA sequence in the candidate genome and generate a list of potential off-target DNA sequences. Next, an on-target model predicts whether the gRNA sequence can affect these potential DNA sequences. The ones that have high on-target effects are considered potential off-targets (see “CRISPR off-target prediction”). (C) An optimal model (oracle function) is first obtained by training on a gold-label database. Next, a generative model generates de novo virus vectors potent in the oracle fitness landscape (see “virus vector design”).
Figure 9
Figure 9
Task illustration for the theme “translating pre-clinical animal models to humans” A model first obtains translatable features between mouse and human by comparing their genotypes. Next, a predictor model is trained to predict phenotype given the mouse genotype. Given the translatable features, the predictor is augmented and makes predictions on human genotypes (see “animal-to-human translation”).
Figure 10
Figure 10
Task illustrations for the theme “curating high-quality cohort” (A) Given the patient's gene expressions and EHRs, a model clusters them into subgroups (see “patient stratification/disease subtyping”). (B) A patient model obtains patient embedding from his/her gene expression and EHR. A trial model obtains trial embedding based on trial criteria. A predictor predicts whether this patient is fit for enrollment in the given trial (see “matching patients for genome-driven trials”).
Figure 11
Figure 11
Task illustrations for the theme “inferring causal effects” Left panel: Mendelian randomization relies on using a gene biomarker (e.g., CHRNA5) as an instrumental variable to measure the effect of exposure to the outcome as it is not affected by confounders, and it serves as a proxy for exposure by directly comparing the effect of the gene on the outcome. Right panel: patients are first grouped based on the CHRNA5 gene. One group contains variant alleles and another contains wild-type alleles. The mortality rate can then be calculated within each group and compared with ascertained risks. If the risk is high, we conclude that the exposure causes the outcome (see “Mendelian randomization”).
Figure 12
Figure 12
Task illustrations for the theme “mining real-world evidence” (A) A model predicts genomic biomarker status given a patient's clinical notes (see “clinical text biomarker mining”). (B) A model recognizes entities in the literature and extracts relations among these entities (see “biomedical literature gene knowledge mining”). The text in panel (A) is from Huang et al.; the text in panel (B) is from Zhu et al.

Comment in

References

    1. Hieter P., Boguski M. Functional genomics: it’s all how you read it. Science. 1997;278:601–602. - PubMed
    1. Wong M.-L., Licinio J. From monoamines to genomic targets: a paradigm shift for drug discovery in depression. Nat. Rev. Drug Discov. 2004;3:136–151. - PubMed
    1. Chin L., Andersen J.N., Futreal P.A. Cancer genomics: from discovery science to personalized medicine. Nat. Med. 2011;17:297. - PubMed
    1. Hamburg M.A., Collins F.S. The path to personalized medicine. New Engl. J. Med. 2010;363:301–304. - PubMed
    1. Makarova K.S., Haft D.H., Barrangou R., Brouns S.J., Charpentier E., Horvath P., Moineau S., Mojica F.J.M., Wolf Y.I., Yakunin A.F. Evolution and classification of the CRISPR–cas systems. Nat. Rev. Microbiol. 2011;9:467–477. - PMC - PubMed

LinkOut - more resources