Review
. 2022 Mar;40(3):229-244.
doi: 10.1007/s11604-021-01205-6. Epub 2021 Oct 25.

Whole-body MRI: detecting bone metastases from prostate cancer

Affiliations
Review

Whole-body MRI: detecting bone metastases from prostate cancer

Katsuyuki Nakanishi et al. Jpn J Radiol. 2022 Mar.

Abstract

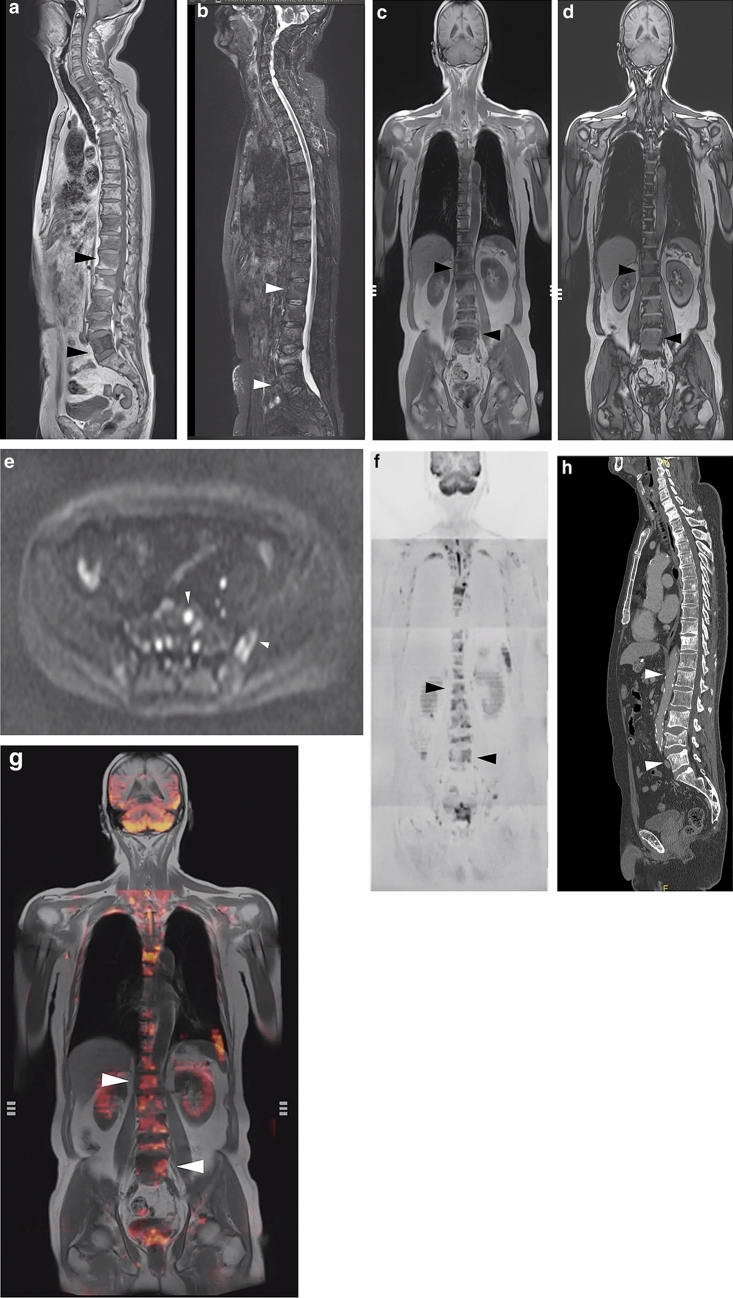
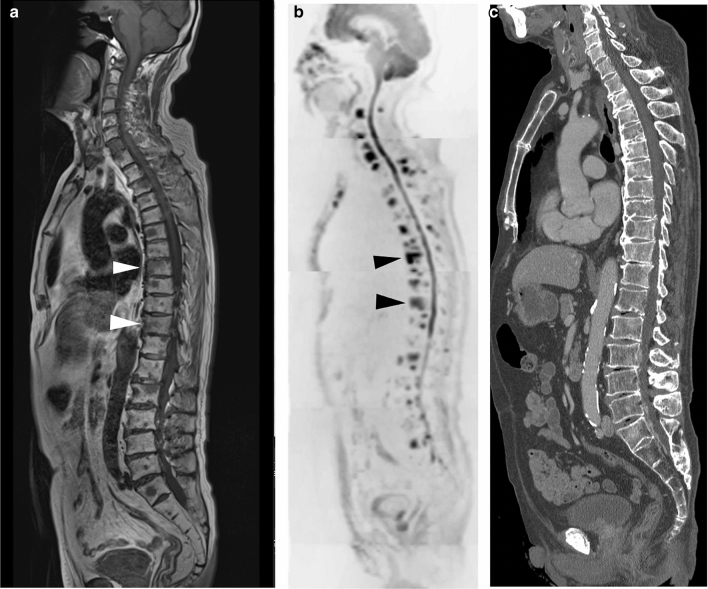
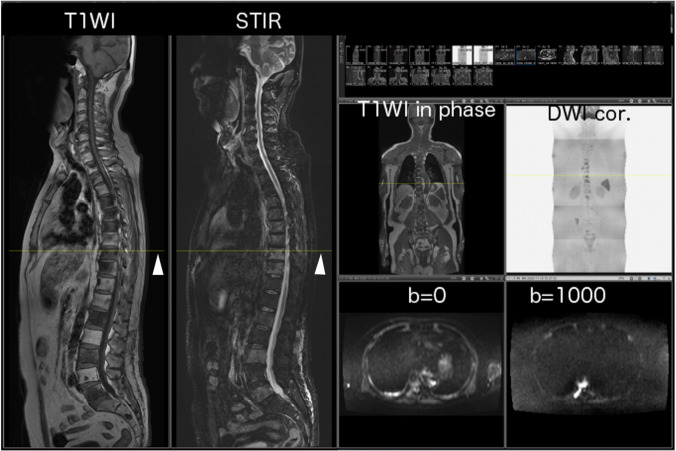
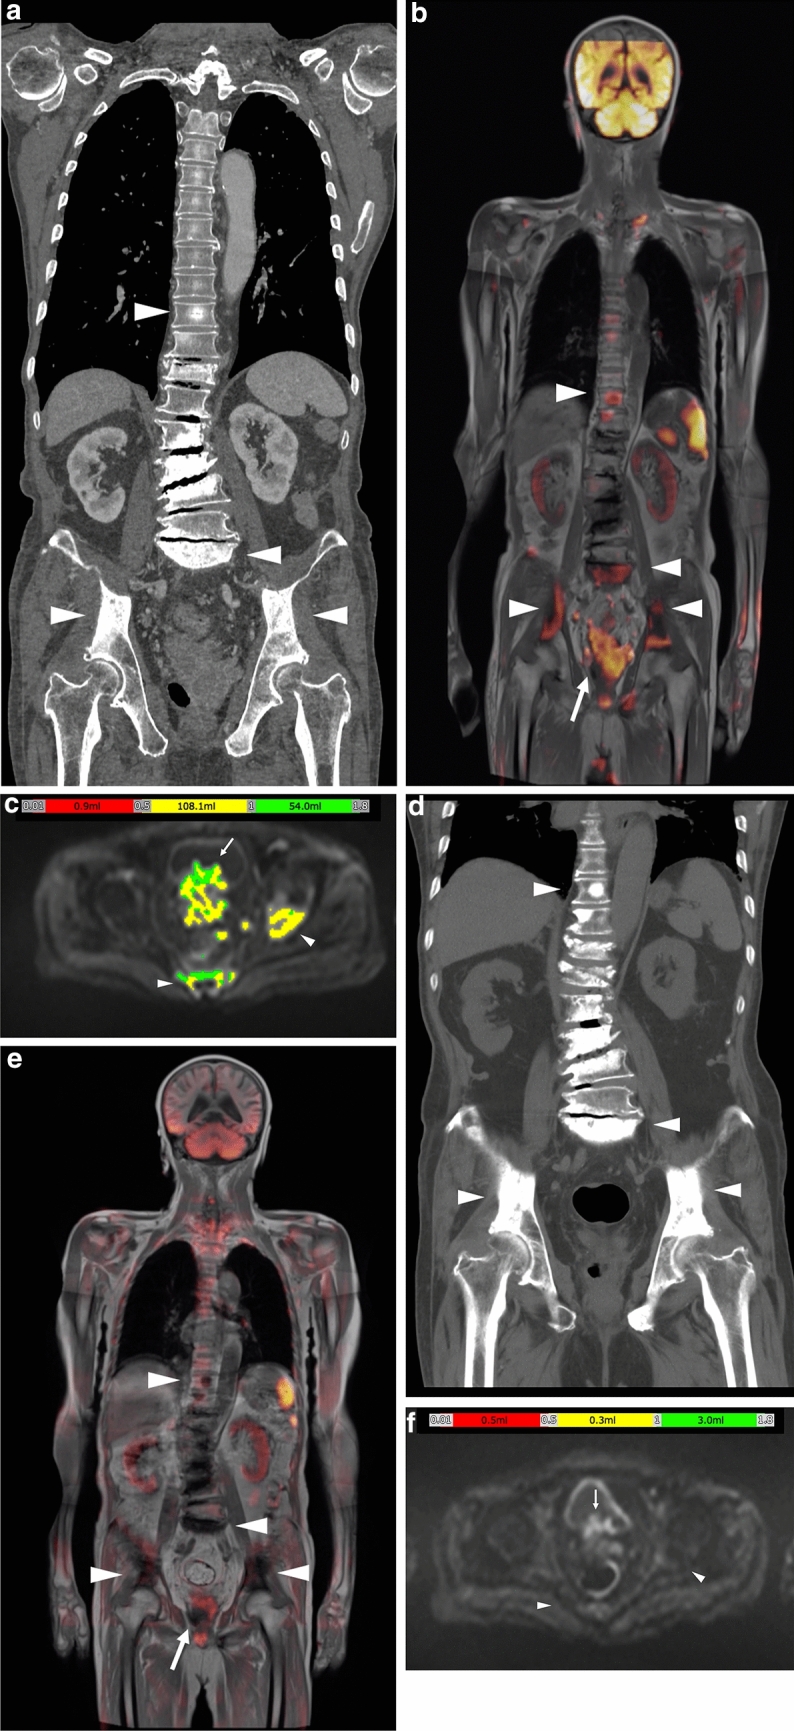
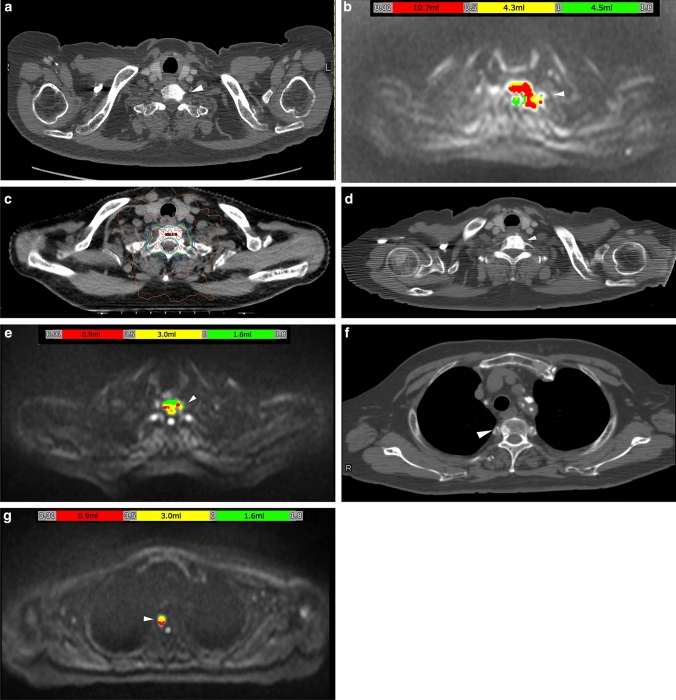
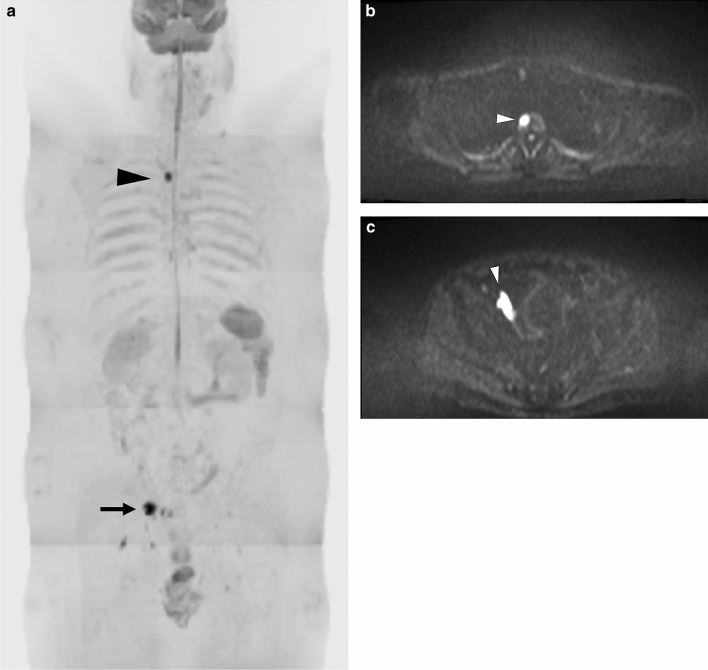
Whole-body magnetic resonance imaging (WB-MRI) is currently used worldwide for detecting bone metastases from prostate cancer. The 5-year survival rate for prostate cancer is > 95%. However, an increase in survival time may increase the incidence of bone metastasis. Therefore, detecting bone metastases is of great clinical interest. Bone metastases are commonly located in the spine, pelvis, shoulder, and distal femur. Bone metastases from prostate cancer are well-known representatives of osteoblastic metastases. However, other types of bone metastases, such as mixed or inter-trabecular type, have also been detected using MRI. MRI does not involve radiation exposure and has good sensitivity and specificity for detecting bone metastases. WB-MRI has undergone gradual developments since the last century, and in 2004, Takahara et al., developed diffusion-weighted Imaging (DWI) with background body signal suppression (DWIBS). Since then, WB-MRI, including DWI, has continued to play an important role in detecting bone metastases and monitoring therapeutic effects. An imaging protocol that allows complete examination within approximately 30 min has been established. This review focuses on WB-MRI standardization and the automatic calculation of tumor total diffusion volume (tDV) and mean apparent diffusion coefficient (ADC) value. In the future, artificial intelligence (AI) will enable shorter imaging times and easier automatic segmentation.

Keywords: Bone metastases; DWIBS; Prostate cancer; Whole-body MRI.


Conflict of interest statement

No conflicts of interest.

Figures

Fig. 1
Fig. 1
Batson’s venous plexus. Cited from Diseases of the Spine and Spinal Cord (Thomas N Byrne et al. P169, Oxford University Press)
Fig. 2
Fig. 2
Sample case (ag) and osteoblastic change (h). The figure presents a 69-year-old man with multiple bone metastases from prostate cancer. Serum PSA was 4.894 ng/mL. a Total spine T1W image. Multiple low-intensity areas are shown in the spine, including in the L1 and L5 (arrowheads). b Total spine STIR image. Multiple mild, high-intensity areas are shown in the spine, including in the L1 and L5 (white arrowheads). c Body coronal in-phase T1W image. Multiple low-intensity areas can be seen (arrowheads). d Body coronal out-of-phase T1W image. Multiple slight high-intensity areas are shown in the lumbar spine (arrowheads). e Axial b = 1000 of the DW image at the level of the pelvic bone. High-intensity areas are shown in the sacrum and left ilium (white arrowheads). f Coronal reconstructed DW image. This image is displayed as a black-and-white inverted image. Multiple high-intensity areas are shown in the spine, including in the L1 and L5 (arrowheads). g Fused image combining in-phase coronal T1W image with coronal reconstructed DW image. Multiple high-intensity areas are shown in the spine, including in the L1 and L5 (white arrowheads). CT was performed at approximately the same time and revealed osteoblastic metastases. h Sagittal reconstruction of the CT image. Multiple sclerotic lesions can be seen, including in the L1 and L5 (white arrowheads), which were correlated with the low-intensity area in the T1W image and the high-intensity area in DW image. The diagnosis was osteoblastic metastases
Fig. 3
Fig. 3
Mixed-type/intertrabecular metastases. A 78-year-old man with a 4-year history of prostate cancer and transition to castration-resistant prostate cancer (CRPC). Serum PSA was 5.954 ng/mL. a On T1W image, multiple low-intensity areas are shown, including in the Th8 and Th11 (white arrowheads). b On the DW sagittal reconstructed image, multiple high-intensity areas are shown, including in the Th8 and Th11(arrowheads). c On the CT reconstructed sagittal image, obvious sclerotic or lytic changes were not observed. In fact, the diagnosis of multiple bone metastases using only CT examination was not possible. These CT findings were defined as intertrabecular metastases
Fig. 4
Fig. 4
MET-RADS-P template [65]. The MET-RADS-P template form allocates the presence of unequivocally identified disease to 14 predefined regions of the body
Fig. 5
Fig. 5
Multichannel coil: 20-channel head coil, 32-channel spine coil, and two or three 18-channel body-array coils were combined to cover the area of Batson’s venous plexus, which is an area with a predilection for bone metastases
Fig. 6
Fig. 6
Imaging layout. This image was captured using WB-MRI by the radiologists and comprised two monitors. On the left side of the monitor, the sagittal T1W images and STIR images are displayed by longitudinal two partings, and on the right side of the monitor, the coronal in-phase T1W images, coronal reconstructed DW images, axial b = 0, and axial b = 1000 images were displayed by four partings. For all image planes, reference lines were used to detect the precise level of the regions (white arrowheads)
Fig. 7
Fig. 7
An 85-year-old man who was initially diagnosed with primary unknown multiple bone metastases. a On the coronal reconstructed CT image, sclerotic lesions were observed in the bilateral ilium, sacrum and Th10 (white arrowheads), which were considered osteoblastic metastases. Sclerotic change in the lumbar spine appeared to be degenerative. Following the CT examination, a high serum PSA level (> 5000 ng/mL) was detected. b On the fused coronal DW and in-phase T1W image at a similar level to a, high-intensity areas were shown in the bilateral ilium, sacrum and Th10 (white arrowheads). In addition, the prostate gland was enlarged and appeared as high intensity (white arrow). c BD score composed axial image at the level of pelvis. The total volume of the area with a specific ADC value range (0.01 to 1.8 × 10–3 mm2/s in the image) is defined as tDV and is subcategorized and denoted by a specific color (0.01–05: red, 0.5–1: yellow, 1–1.8: green). Color-displayed lesions are shown in the left acetabulum and sacrum (white arrowheads). The enlarged prostate gland can also be observed as color-displayed lesions (white arrow). In this case, the tDV was 163.0 mL, and the mean ADC of these lesions was calculated as 0.96 (× 10–3 mm2/s) by the ADC histogram. d-f. Three months after the image shows in ac, following combined androgen blockage. PSA decreased to 175.483 ng/mL. d On the coronal reconstructed CT, sclerotic change showed an increase from that in a in the bilateral ilium sacrum and Th10 (white arrowheads). e On the fused image, high-intensity areas in the bilateral ilium, sacrum, and Th10 decreased in intensity (white arrowheads), and the prostate gland decreased in size and intensity (white arrow) from those observed in b. f On the BD score–composed image, the color-displayed area shown in c largely disappeared (white arrowheads and white arrow). tDV markedly decreased to 3.8 mL, and mean ADC value increased to 1.18 (× 10–3 mm2/s). Osteosclerotic change on d had been considered as the re-ossification after therapy
Fig. 8
Fig. 8
A 70-year-old man with CRPC. Six years ago, local radiotherapy was performed for prostate cancer (T2c N0M0, PSA 32.1 ng/mL, GS 4 + 5). Four years later, the patient’s condition transitioned to CRPC. a On the original axial CT at the level of C7, osteosclerotic change was seen in the left part of C7 body (white arrowhead). At that time, the patient’s PSA level was 4.413 ng/mL. b On the BD score–composed axial image at the level of C7, a colored area was seen (white arrowhead). tDV was 19.5 mL, and the mean ADC value was 0.74 (× 10–3 mm2/s). c The C7 lesion was regarded a metastatic lesion, intensity-modulated radiation therapy was performed (35 Gy/5fr RT.) with reference to the axial DW image. dg Approximately 10 months after the image shown in ac, PSA increased to 6.235 ng/mL. d On the original axial CT at the level of C7, the osteosclerotic change increased in the left part of the C7 body (white arrowhead) from that shown in a. e On the BD score–composed axial image at the level of C7, a colored area was seen (white arrowhead). The colored area decreased from that in b. f On the CT image at the level of Th3, a subtle sclerotic change was newly observed (white arrowhead), but this was a retrospective finding. g On the BD score–composed axial image at the level of Th3, a colored area was newly observed in the right part of the body (white arrowhead). In this case, tDV decreased to 5.5 mL, and consequently, mean ADC increased to 0.83 (× 10–3 mm2/s); however, Th3 was diagnosed as a new metastatic lesion
Fig. 9
Fig. 9
Oligometastases. An 82-year-old man with bone metastases from prostate cancer. a On the radial reconstructed antero-posterior DW image, a high-intensity area was observed in Th2 (arrowhead), and swelling of the right internal iliac lymph node was suspected (arrow). At this time, the serum PSA was 34.903 ng/mL. b On the b = 1000 axial DW image at the level of the Th2, a high-intensity area was seen (white arrowhead). c On the b = 1000 axial DW image at the level of the pelvis, the right iliac lymph node was swollen and had shown high intensity (white arrowhead)

References

    1. Lee K, Park HY, Kim KW, Lee AJ, Yoon MA, Chae EJ, et al. Advances in whole body MRI for musculoskeletal imaging: Diffusion-weighted imaging. J Clin Orthop Trauma. 2019;10(4):680–686. - PMC - PubMed
    1. Lecouvet FE, Whole-Body MR. Imaging: musculoskeletal applications. Radiology. 2016;279(2):345–365. - PubMed
    1. Albano D, La Grutta L, Grassedonio E, Patti C, Lagalla R, Midiri M, et al. Pitfalls in whole body MRI with diffusion weighted imaging performed on patients with lymphoma: what radiologists should know. Magn Reson Imaging. 2016;34(7):922–931. - PubMed
    1. Grover VP, Tognarelli JM, Crossey MM, Cox IJ, Taylor-Robinson SD, McPhail MJ. Magnetic resonance imaging: principles and techniques: lessons for clinicians. J Clin Exp Hepatol. 2015;5(3):246–255. - PMC - PubMed
    1. Stecco A, Trisoglio A, Soligo E, Berardo S, Sukhovei L, Carriero A. Whole-body MRI with diffusion-weighted imaging in bone metastases: a narrative review. Diagnostics (Basel). 2018;8:3. - PMC - PubMed

MeSH terms