

Targeted Activation of G-Protein Coupled Receptor-Mediated Ca2+ Signaling Drives Enhanced Cartilage-Like Matrix Formation
- PMID: 34693731
- PMCID: PMC9271335
- DOI: 10.1089/ten.TEA.2021.0078
Targeted Activation of G-Protein Coupled Receptor-Mediated Ca2+ Signaling Drives Enhanced Cartilage-Like Matrix Formation
Abstract
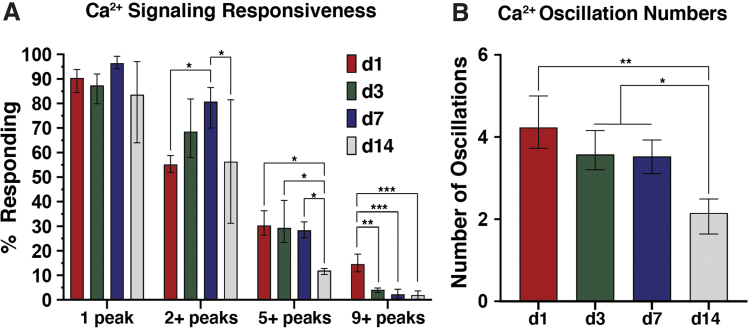
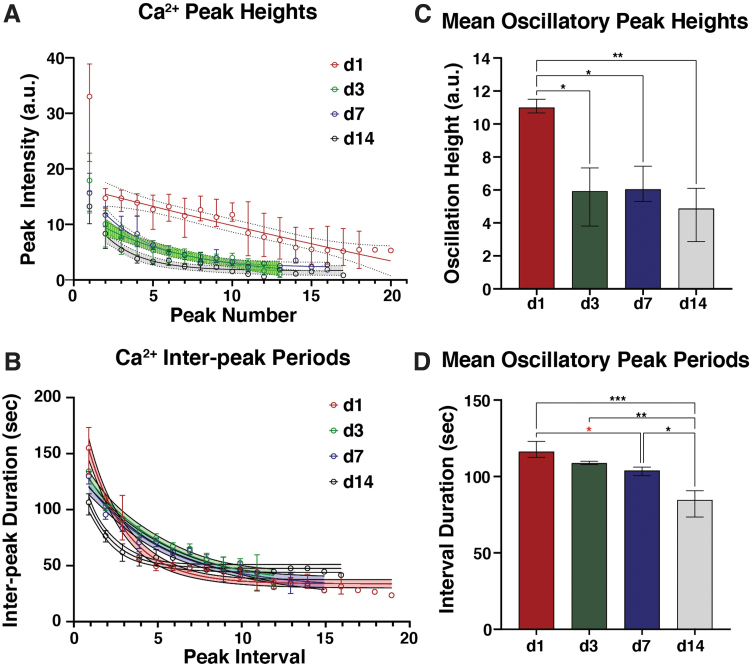
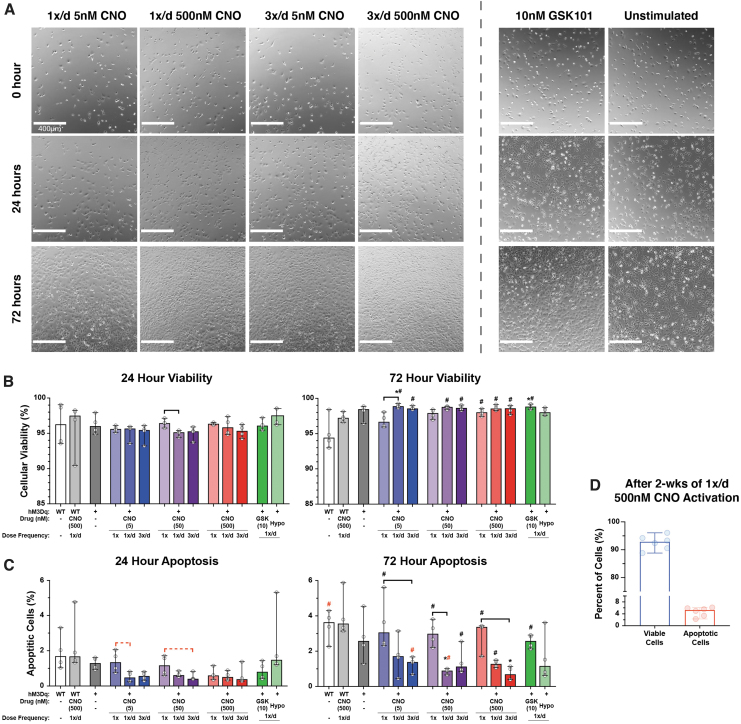
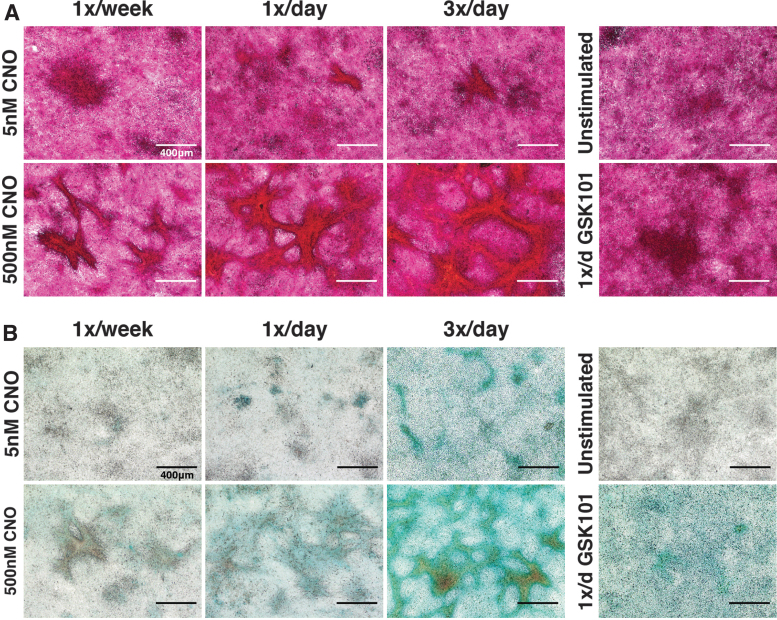
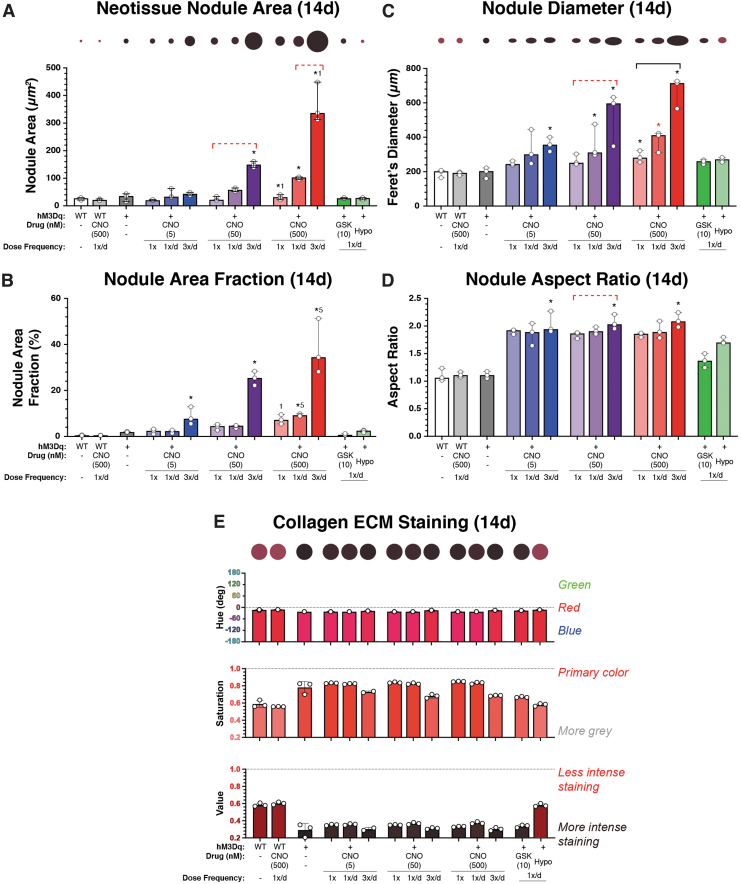
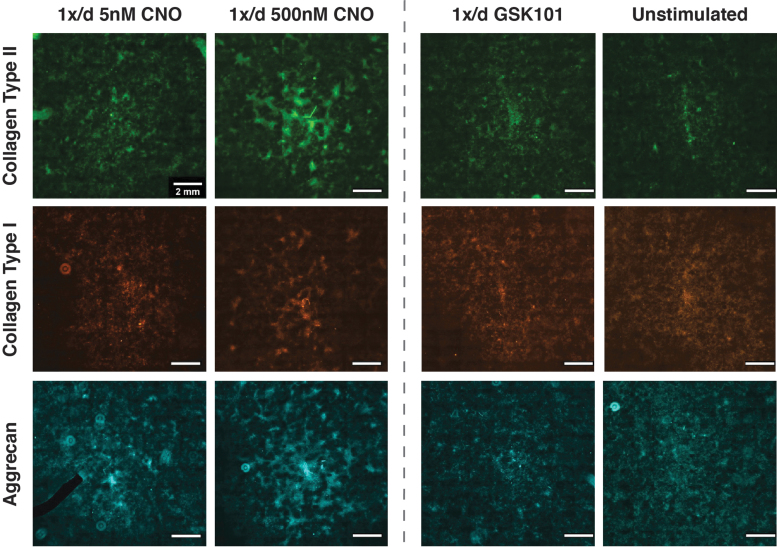
Intracellular calcium ([Ca2+]i) signaling is a critical regulator of chondrogenesis, chondrocyte differentiation, and cartilage development. Calcium (Ca2+) signaling is known to direct processes that govern chondrocyte gene expression, protein synthesis, cytoskeletal remodeling, and cell fate. Control of chondrocyte/chondroprogenitor Ca2+ signaling has been attempted through mechanical and/or pharmacological activation of endogenous Ca2+ signaling transducers; however, such approaches can lack specificity and/or precision regarding Ca2+ activation mechanisms. Synthetic signaling platforms permitting precise and selective Ca2+ signal transduction can improve dissection of the roles that [Ca2+]i signaling plays in chondrocyte behavior. One such platform is the chemogenetic DREADD (designer receptor exclusively activated by designer drugs) hM3Dq, which activates [Ca2+]i signaling via the Gαq-PLCβ-IP3-ER pathway upon clozapine N-oxide (CNO) administration. We previously demonstrated hM3Dq's ability to precisely and synthetically initiate robust [Ca2+]i transients and oscillatory [Ca2+]i signaling in chondrocyte-like ATDC5 cells. Here, we investigate the effects that long-term CNO stimulatory culture have on hM3Dq [Ca2+]i signaling dynamics, proliferation, and protein deposition in 2D ATDC5 cultures. Long-term culturing under repeated CNO stimulation modified the temporal dynamics of hM3Dq [Ca2+]i signaling, increased cell proliferation, and enhanced matrix production in a CNO dose- and frequency-dependent manner, and triggered the formation of cell condensations that developed aligned, anisotropic neotissue structures rich in cartilaginous proteoglycans and collagens, all in the absence of differentiation inducers. This study demonstrated Gαq-G-protein coupled receptor (GPCR)-mediated [Ca2+]i signaling involvement in chondroprogenitor proliferation and cartilage-like matrix production, and it established hM3Dq as a powerful tool for elucidating the role of GPCR-mediated Ca2+ signaling in chondrogenesis and chondrocyte differentiation. Impact statement Targeted activation of intracellular calcium signaling has gained attention as a cartilage tissue engineering adjuvant approach. In the present study, we demonstrated that activation of hM3Dq, an engineered chemogenetic activator of the Gαq-pathway and IP3-mediated intracellular calcium signaling, drives accelerated development of mesenchyme-like cell condensations and cartilaginous neotissue formation in chondrocyte-like cell cultures in vitro and does so without the requirement of differentiation factors/inducers. These outcomes highlight the potential of targeted/synthetic Gαq-pathway activation, specifically using novel chemogenetic approaches, to enhance the study of chondrocyte physiology and improve cartilage tissue engineering approaches.
Keywords: G-protein coupled receptor activation; cartilage tissue engineering; chemogenetics; chondrocyte calcium signaling; designer receptors exclusively activated by designer drugs.
Conflict of interest statement
No competing financial interests exist.
Figures
Similar articles
-
Targeted Gq-GPCR activation drives ER-dependent calcium oscillations in chondrocytes.Cell Calcium. 2021 Mar;94:102363. doi: 10.1016/j.ceca.2021.102363. Epub 2021 Jan 30. Cell Calcium. 2021. PMID: 33550208
-
DREADD-based synthetic control of chondrocyte calcium signaling in vitro.J Orthop Res. 2019 Jul;37(7):1518-1529. doi: 10.1002/jor.24285. Epub 2019 Mar 28. J Orthop Res. 2019. PMID: 30908734
-
Chemogenetic Activation of Excitatory Neurons Alters Hippocampal Neurotransmission in a Dose-Dependent Manner.eNeuro. 2019 Nov 15;6(6):ENEURO.0124-19.2019. doi: 10.1523/ENEURO.0124-19.2019. Print 2019 Nov/Dec. eNeuro. 2019. PMID: 31645362 Free PMC article.
-
Regulation of chondrogenesis by protein kinase C: Emerging new roles in calcium signalling.Cell Signal. 2014 May;26(5):979-1000. doi: 10.1016/j.cellsig.2014.01.011. Epub 2014 Jan 17. Cell Signal. 2014. PMID: 24440668 Review.
-
GPCR mediated control of calcium dynamics: A systems perspective.Cell Signal. 2020 Oct;74:109717. doi: 10.1016/j.cellsig.2020.109717. Epub 2020 Jul 22. Cell Signal. 2020. PMID: 32711109 Free PMC article. Review.
Cited by
-
Key Genes Identified in Nonsyndromic Microtia by the Analysis of Transcriptomics and Proteomics.ACS Omega. 2022 May 13;7(20):16917-16927. doi: 10.1021/acsomega.1c07059. eCollection 2022 May 24. ACS Omega. 2022. PMID: 35647449 Free PMC article.
-
Treatment of knee cartilage lesions in 2024: From hyaluronic acid to regenerative medicine.J Exp Orthop. 2024 Apr 2;11(2):e12016. doi: 10.1002/jeo2.12016. eCollection 2024 Apr. J Exp Orthop. 2024. PMID: 38572391 Free PMC article. Review.
-
Multifunctional piezoelectric hydrogels under ultrasound stimulation boost chondrogenesis by recruiting autologous stem cells and activating the Ca2+/CaM/CaN signaling pathway.Bioact Mater. 2025 Apr 18;50:344-363. doi: 10.1016/j.bioactmat.2025.04.009. eCollection 2025 Aug. Bioact Mater. 2025. PMID: 40297641 Free PMC article.
-
Calcium signaling of primary chondrocytes and ATDC5 chondrogenic cells under osmotic stress and mechanical stimulation.J Biomech. 2022 Dec;145:111388. doi: 10.1016/j.jbiomech.2022.111388. Epub 2022 Nov 17. J Biomech. 2022. PMID: 36413831 Free PMC article.
-
Molecular roles in membrane receptor signaling pathways and cascade reactions in chondrocytes: a review.J Mol Histol. 2025 Feb 23;56(2):94. doi: 10.1007/s10735-025-10368-9. J Mol Histol. 2025. PMID: 39988650 Review.
References
-
- Clapham, D.E. Calcium signaling. Cell 131, 1047, 2007. - PubMed
-
- Matta, C., and Zakany, R.. Calcium signalling in chondrogenesis: implications for cartilage repair. Front Biosci (Schol Ed) 5, 305, 2013. - PubMed
-
- Sanchez, J.C., Danks, T.A., and Wilkins, R.J.. Mechanisms involved in the increase in intracellular calcium following hypotonic shock in bovine articular chondrocytes. Gen Physiol Biophys 22, 487, 2003. - PubMed
-
- Guilak, F., Zell, R., Erickson, G., and Grande, D.. Mechanically induced calcium waves in articular chondrocytes are inhibited by gadolinium and amiloride. J Orthop Res 17, 421, 1999. - PubMed
-
- Pingguan-Murphy, B., El-Azzeh, M., Bader, D.L., and Knight, M.M.. Cyclic compression of chondrocytes modulates a purinergic calcium signalling pathway in a strain rate- and frequency-dependent manner. J Cell Physiol 209, 389, 2006. - PubMed
Publication types
MeSH terms
Substances
Grants and funding
LinkOut - more resources
Full Text Sources
Miscellaneous
