. 2021 Dec 1;321(6):F689-F704.
doi: 10.1152/ajprenal.00222.2021. Epub 2021 Oct 25.

A new view of macula densa cell protein synthesis

Affiliations

A new view of macula densa cell protein synthesis

Urvi Nikhil Shroff et al. Am J Physiol Renal Physiol. .

Abstract

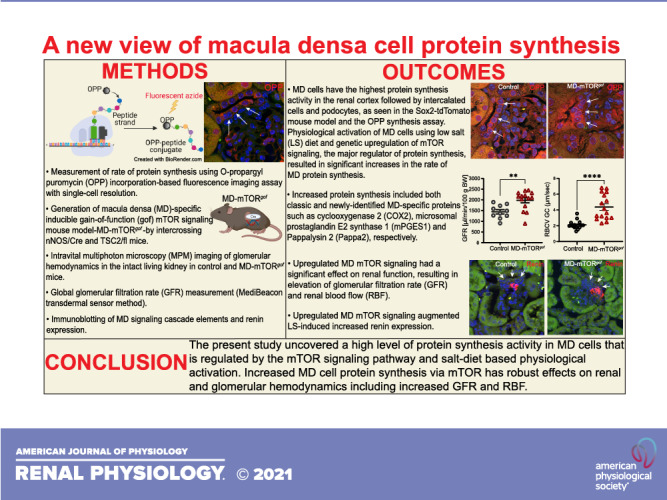
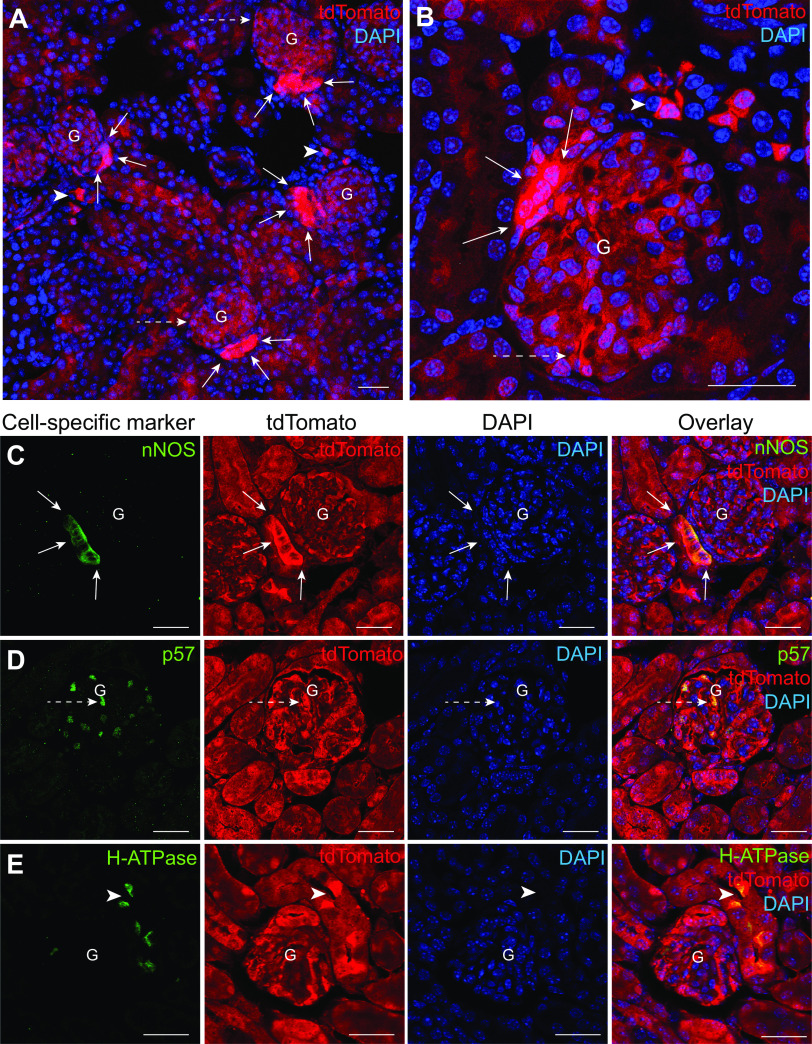
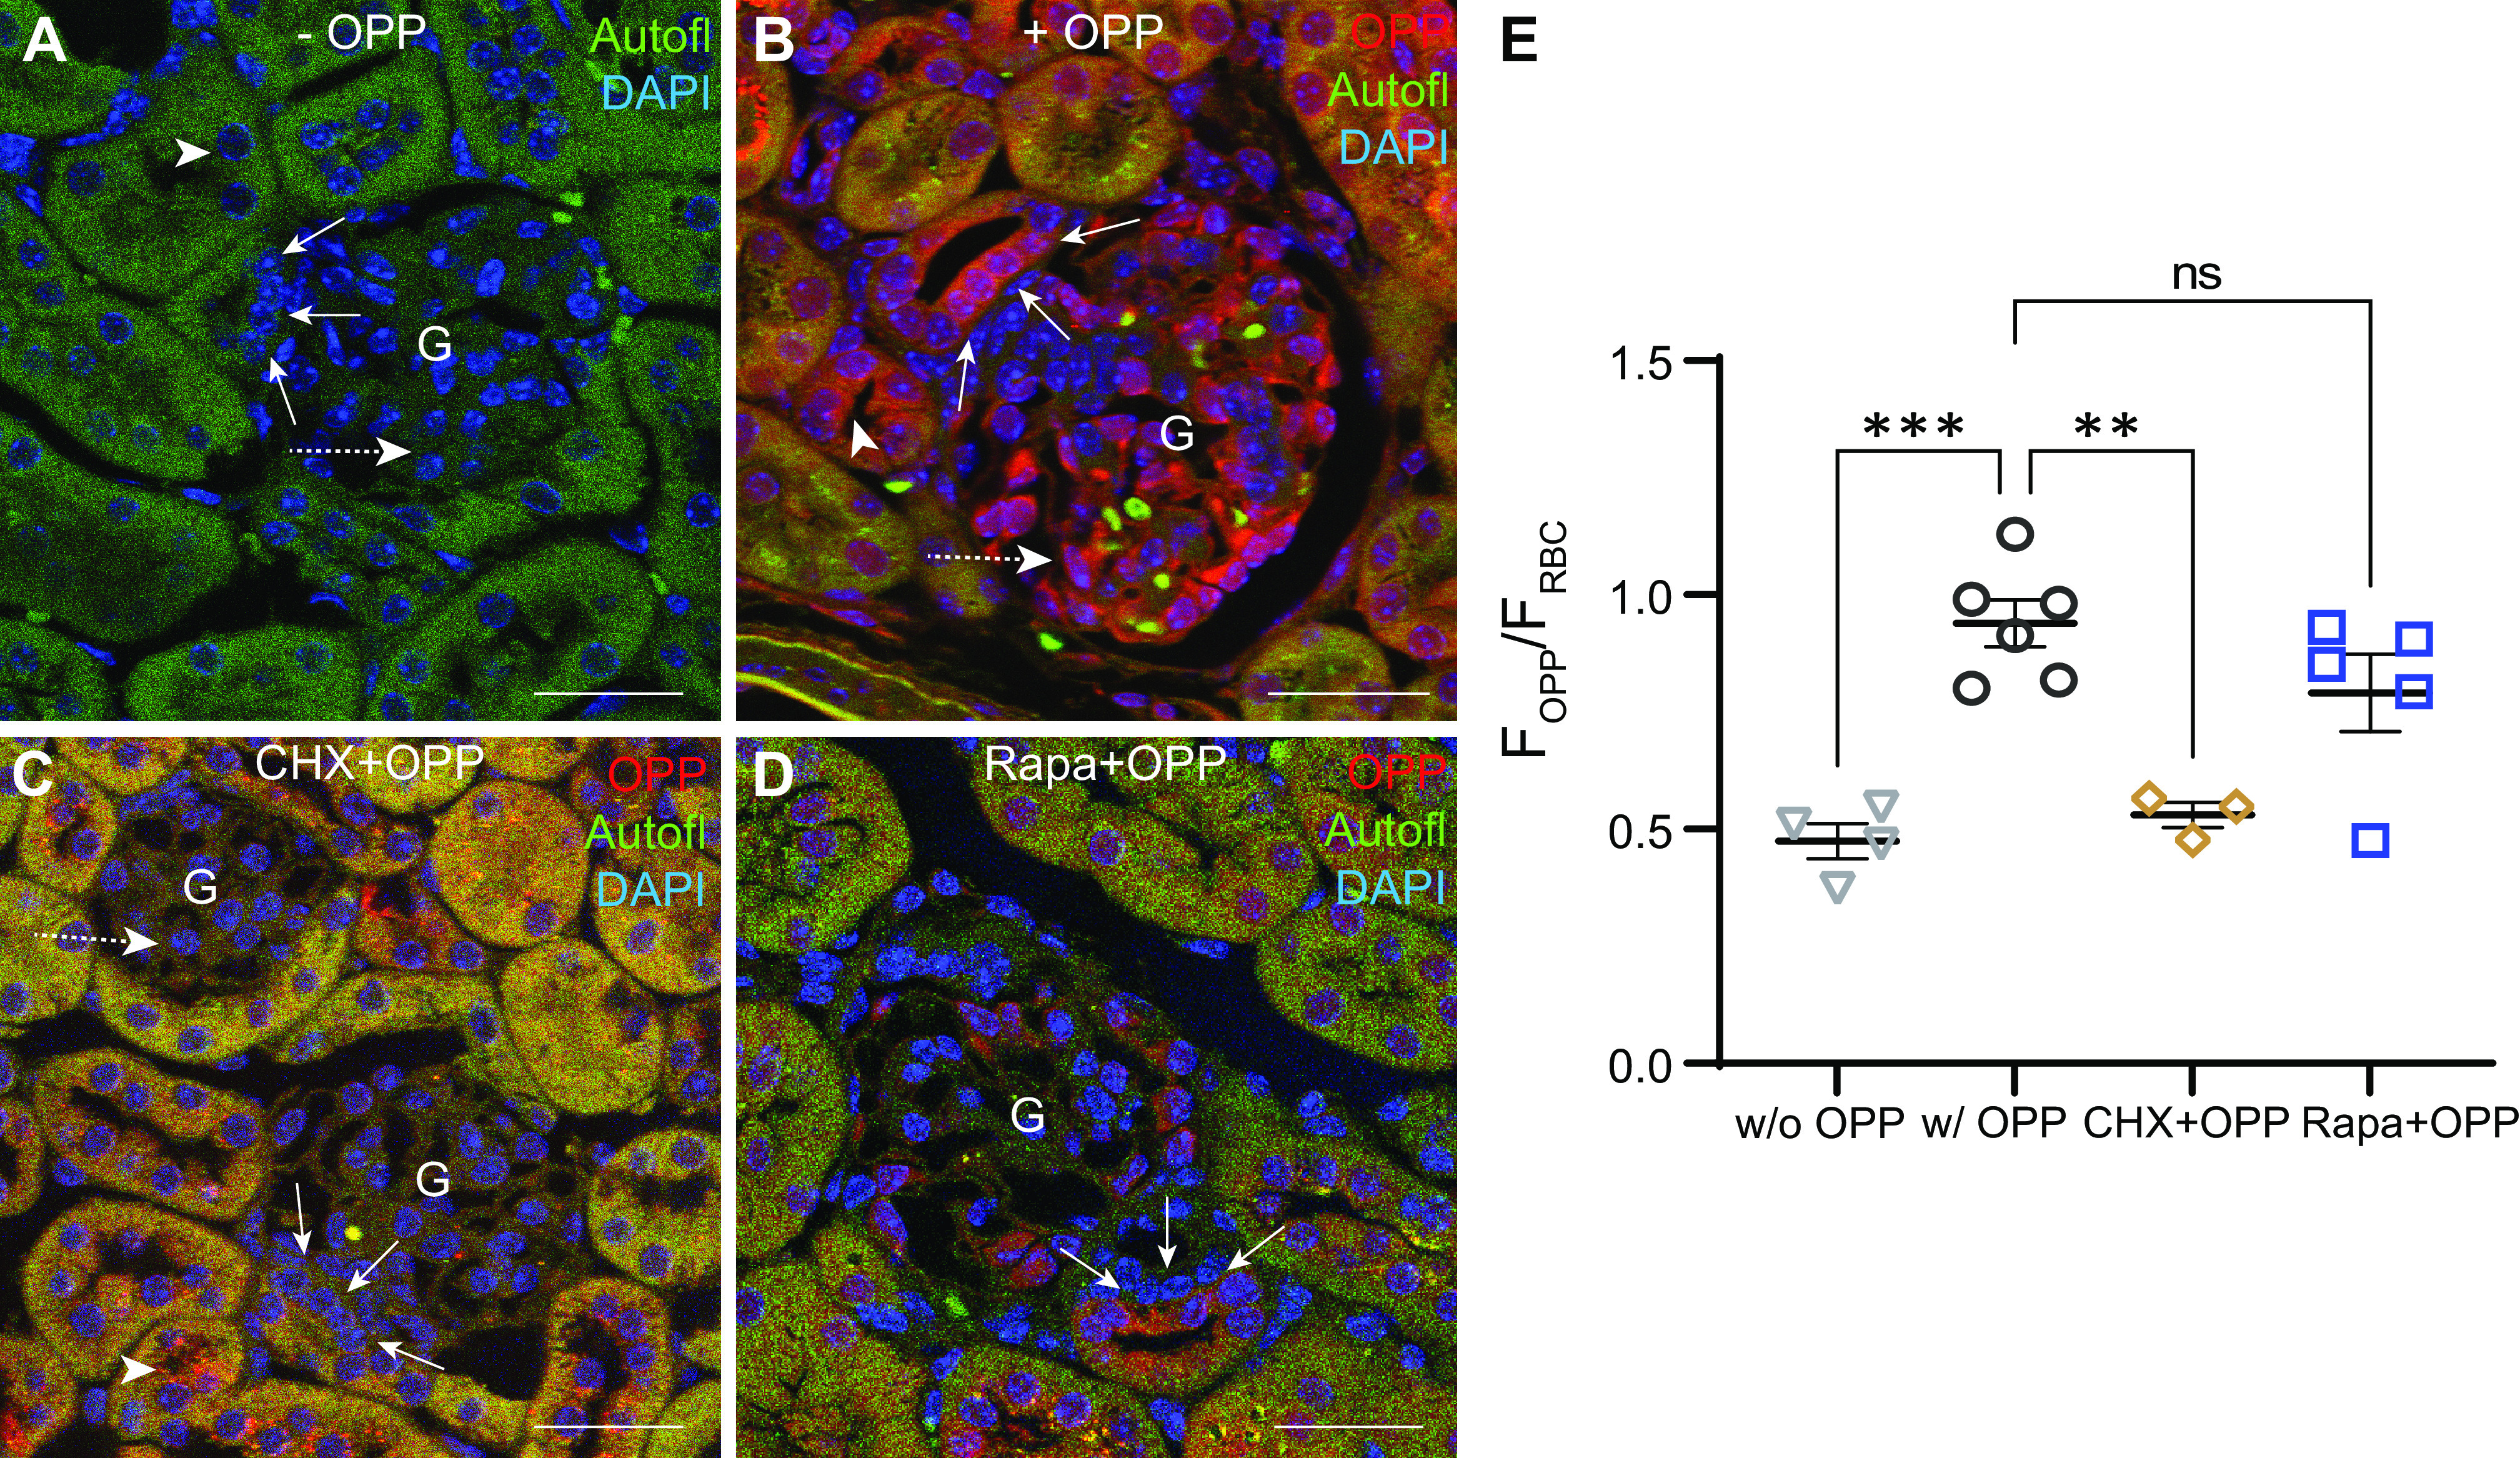
Macula densa (MD) cells, a chief sensory cell type in the nephron, are endowed with unique microanatomic features including a high density of protein synthetic organelles and secretory vesicles in basal cell processes ("maculapodia") that suggest a so far unknown high rate of MD protein synthesis. This study aimed to explore the rate and regulation of MD protein synthesis and their effects on glomerular function using novel transgenic mouse models, newly established fluorescence cell biology techniques, and intravital microscopy. Sox2-tdTomato kidney tissue sections and an O-propargyl puromycin incorporation-based fluorescence imaging assay showed that MD cells have the highest level of protein synthesis within the kidney cortex followed by intercalated cells and podocytes. Genetic gain of function of mammalian target of rapamycin (mTOR) signaling specifically in MD cells (in MD-mTORgof mice) or their physiological activation by low-salt diet resulted in further significant increases in the synthesis of MD proteins. Specifically, these included both classic and recently identified MD-specific proteins such as cyclooxygenase 2, microsomal prostaglandin E2 synthase 1, and pappalysin 2. Intravital imaging of the kidney using multiphoton microscopy showed significant increases in afferent and efferent arteriole and glomerular capillary diameters and blood flow in MD-mTORgof mice coupled with an elevated glomerular filtration rate. The presently identified high rate of MD protein synthesis that is regulated by mTOR signaling is a novel component of the physiological activation and glomerular hemodynamic regulatory functions of MD cells that remains to be fully characterized.NEW & NOTEWORTHY This study discovered the high rate of protein synthesis in macula densa (MD) cells by applying direct imaging techniques with single cell resolution. Physiological activation and mammalian target of rapamycin signaling played important regulatory roles in this process. This new feature is a novel component of the tubuloglomerular cross talk and glomerular hemodynamic regulatory functions of MD cells. Future work is needed to elucidate the nature and (patho)physiological role of the specific proteins synthesized by MD cells.

Keywords: glomerular filtration rate; mTOR; macula densa; protein synthesis; renin.


Conflict of interest statement

J.P-P. and G.G. are cofounders of Macula Densa Cell LLC, a biotechnology company that develops therapeutics to target macula densa cells for a regenerative treatment for chronic kidney disease. Macula Densa Cell LLC has a patent entitled “Targeting macula densa cells as a new therapeutic approach for kidney disease.” J.P-P. received consulting fees from Travere Therapeutics and Eli Lilly & Co. None of the other authors has any conflicts of interest, financial or otherwise, to disclose.

Figures

None
Graphical abstract
Figure 1.
Figure 1.
Histological features of the Sox2-tdTomato mouse model. A: representative fluorescence image of a Sox2-tdTomato mouse kidney tissue section confirming the expression of tandem dimer Tomato (tdTomato) in all kidney cell types (in red). Nuclei are labeled blue with DAPI. The specific cell types highlighted are macula densa (MD) cells (solid white arrows), podocytes (dashed white arrows), and intercalated cells (ICs) (white arrowheads). B: magnified fluorescence image of a Sox2-tdTomato mouse kidney section focusing on a single glomerulus (G) with its MD cell plaque (solid white arrows) and podocytes (dashed white arrows). Neighboring ICs are also shown (white arrowheads). Nuclei are labeled blue with DAPI. Representative immunofluorescence colocalization images for MD cell marker neuronal nitric oxide synthase (nNOS; in green; C), the podocyte marker p57 (in green; D), and the IC marker H+-ATPase (in green; E) with endogenous tdTomato expression (in red). Note the intense tdTomato expression in these specific cell types compared with the other cell populations. Nuclei are labeled blue with DAPI. Scale bars = 30 µm.
Figure 2.
Figure 2.
Quantitative visualization of protein synthesis activity in the kidney at the single cell level using O-propargyl puromycin (OPP) incorporation-based fluorescence imaging. Representative fluorescence images of wild-type mouse kidney sections without (−) OPP (A), with (+) OPP (in red; B), with cycloheximide (CHX) pretreatment and OPP (in red; C), and with rapamycin (Rapa) treatment and OPP (in red; D) with tissue autofluorescence (Autofl; in green) for morphological details. Nuclei are labeled blue with DAPI. Note the strong OPP labeling (in red) in the macula densa (MD) cell plaque (solid white arrows), podocytes (dashed white arrows), and intercalated cells (white arrowheads). E: statistical summary of average OPP fluorescence intensity in the MD cell plaque (FOPP) normalized to red blood cell (RBC) fluorescence intensity (FRBC) in WT mice without (w/o) OPP (n = 4), with (w/) OPP (n = 6), with CHX pretreatment and OPP (n = 3), and with Rapa treatment and OPP (n = 5). In each kidney tissue section, OPP intensity in 5–10 MD plaques was quantified by placing 10 circular regions of interest across the MD plaque (FOPP) and normalized to FRBC in the same imaging area. Each data point in the graph corresponds to an average of FOPP/FRBC values from 5 to 10 MD plaques per animal. Data are expressed as means ± SE. **P <0.01 and ***P < 0.001 by one-way ANOVA with Dunnett’s multiple comparisons test. G, glomerulus; ns, not significant. Scale bars = 30 µm.
Figure 3.
Figure 3.
Validation of expression of mammalian target of rapamycin (mTOR) signaling elements in human and control and MD-mTORgof mouse kidneys. Human protein atlas (HPA) validation of immunohistochemistry labeling for tuberous sclerosis complex 2 (TSC2; A), DEP domain containing mTOR interacting protein (Deptor; B), ribosomal protein S6 (RPS6) kinase (RPS6K; C), and eukaryotic translation initiation factor 3 C (eIF3C; D) in the human kidney. Magnified insets show labeling in the macula densa (MD; solid black arrows). Immunohistochemistry images for the above are available as follows: TSC2 (https://images.proteinatlas.org/30409/62646_A_9_5.jpg), Deptor (https://images.proteinatlas.org/23945/53320_A_7_5.jpg); RPS6K (https://images.proteinatlas.org/2852/7862_A_8_5.jpg); and eIF3C (https://images.proteinatlas.org/50112/117399_A_8_5.jpg. Representative immunofluorescence images of wild-type mouse kidney tissue sections with RPS6 labeling (in red; E) and eukaryotic translation initiation factor 4E-binding protein 1 (EIF4EBP1) labeling (in red; F) and tissue autofluorescence (Autofl; in green) for morphological details. Nuclei are labeled blue with DAPI. Note the strong labeling in MD cells (solid white arrows). Representative immunofluorescence images of mouse kidney tissue sections of control mice (G) and MD-mTORgof mice (H) with TSC2 labeling (in red) and tissue autofluorescence (in green) for morphological details. Nuclei are labeled blue with DAPI. Note the absence of TSC2 labeling in MD cells of the MD-mTORgof mouse kidney (solid white arrows) in H compared with control in G. The boundaries of the MD plaque are shown by dashed lines. I: immunoblots for total (t)RPS6K and phosphorylated (p)RPS6K) in control and MD-mTORgof kidney cortex homogenates (n = 7) with the [pRPS6K]/[tRPS6] statistical summary. J: immunoblots for tEIF4EBP1 and pEIF4EBP1 in control and MD-mTORgof kidney cortex homogenates (n = 7) with the [pEIF4EBP1]/[tEIF4EBP1] statistical summary. Representative periodic acid-Schiff staining of histological images of kidney tissue sections of control mice (K) and MD-mTORgof mice (L) depicting the entire kidney cross-sectional area along with a specific cortical region. Magnified insets show the cortical collecting duct (CD). M: statistical summary of kidney weight (KW) normalized to body weight in control and MD-mTORgof mice (n = 6). Data are expressed as means ± SE. *P < 0.05 and **P < 0.01 by an unpaired Student’s t test. G, glomerulus; MW, molecular weight; ns, not significant. Scale bars = 30 µm.
Figure 4.
Figure 4.
Quantification of macula densa (MD) cell global protein synthesis in control and MD-mTORgof mice using O-propargyl puromycin (OPP) incorporation-based fluorescence imaging. Representative fluorescence images of mouse kidney tissue sections of control mice on a normal-salt (NS) diet (A) or low-salt (LS) diet (B) as well as MD-mTORgof mice on a NS diet (C) or a LS diet (D) OPP labeling (in red) and tissue autofluorescence (Autofl; in green) for morphological details. Nuclei are labeled blue with DAPI. Note the strong OPP labeling (in red) in the MD cell plaque (solid white arrows). E: statistical summary of average OPP fluorescence intensity in the MD cell plaque (FOPP) normalized to red blood cell (RBC) fluorescence intensity (FRBC) in control mice on the NS or LS diet (n = 6) and in MD-mTORgof mice on the NS or LS diet (n = 8). In each kidney tissue section, OPP intensity in 5–10 MD plaques was quantified by placing 10 circular regions of interest across the MD plaque (FOPP) and normalized to FRBC in the same imaging area. Each data point in the graph corresponds to an average of FOPP/FRBC values from 5 to 10 MD plaques per animal. Data are expressed as means ± SE. ***P < 0.001 and ****P <0.0001 by one-way ANOVA with Tukey’s multiple comparisons test. G, glomerulus; mTOR, mammalian target of rapamycin; ns, not significant. Scale bars = 25 µm.
Figure 5.
Figure 5.
Autocrine and paracrine effects of upregulated macula densa (MD) mammalian target of rapamycin (mTOR) signaling. Representative fluorescence images of control (A) and MD-mTORgof (B) mice with MD cells expressing enhanced green fluorescent protein (eGFP; in green) and all other cells expressing tandem dimer Tomato (tdTomato; in red). Nuclei are labeled blue with DAPI. Note the change in the length of maculapodia at the base of MD cells (solid white arrow). C: statistical summary of the length of maculapodia in control (n = 8) and MD-mTORgof (n = 5) mice. In each kidney tissue section, the length of maculapodia of multiple MD cells in 5–10 MD plaques was measured using high-resolution z-stacks of the entire MD volume. Each data point in the graph corresponds to an average of the length of maculapodia in 5–10 MD plaques per animal. Representative fluorescence images of control (D) and MD-mTORgof (E) mice with the MD cell plaque expressing eGFP (in green) and other cells expressing tdTomato (in red). Nuclei are labeled blue with DAPI. Note the change in the number of MD cells per area (solid white arrows). F: statistical summary of the number of MD cells per juxtaglomerular apparatus area in control (n = 6) and MD-mTORgof (n = 5) mice. In each kidney tissue section, the number of MD cells per area was counted using high-resolution z-stacks of the entire volume of the MD plaque in which single MD cells could be clearly visualized based on their mG expression and DAPI labeling. Each data point in the graph corresponds to an average of the number of MD cells in 5–10 MD plaques per animal. G: statistical summary of the systolic blood pressure (BP) of control and MD-mTORgof mice on either a normal-salt (NS) diet or a low-salt (LS) diet at baseline, 4 wk postinduction, and 4 wk postinduction and 2 wk of dietary treatment (n = 3–6). All animals underwent a training period of 5 days for acclimatization, and each data point in the graph corresponds to an average of systolic BP over 2 days per animal after acclimatization. H: statistical summary of the glomerular filtration rate (GFR) in control (n = 10) and MD-mTORgof (n = 14) mice 4 wk postinduction. Data are expressed as means ± SE. *P < 0.05 and **P < 0.01 by two-way ANOVA (between multiple groups) with Tukey’s multiple comparisons test and an unpaired Student’s t test (between two groups). BW, body weight; G, glomerulus; ns, not significant. Scale bars = 15 µm.
Figure 6.
Figure 6.
Intravital imaging of glomerular hemodynamics in MD-mTORgof mice. Statistical summary of the glomerular tuft area (A), glomerular capillary (GC) diameter (B), and GC red blood cell velocity (RBCV; C) in control and MD-mTORgof mice. Each data point in the graph corresponds to an average of five different measurements in four glomeruli in n = 4 mice each in both groups. Representative intravital multiphoton microscopy images of glomeruli with their afferent arteriole (AA) and efferent arteriole (EA) of control (D and E) and MD-mTORgof (F and G) mice. Note the specificity of the membrane-targeted enhanced green fluorescent protein (eGFP) expression (in green) to macula densa (MD) cells and expression of membrane-targeted tandem dimer Tomato (tdTomato; in red) in all other renal cells. The circulating plasma is labeled with Alexa Fluor 680-conjugated BSA (in gray). Statistical summary of AA diameter (H), AA blood flow (I), EA diameter (J), and EA blood flow (K) in control and MD-mTORgof mice. Each data point in the graph corresponds to different measurements in four AA/EA (H and J) or one AA and two EA (I and K) in n = 4 mice each in both groups. Data are expressed as means ± SE. *P < 0.05, **P < 0.01, and ****P < 0.0001 by an unpaired Student’s t test. G, glomerulus; mTOR, mammalian target of rapamycin. Scale bars = 30 µm.
Figure 7.
Figure 7.
Changes in renin expression in MD-mTORgof mice. Representative maximum projection immunofluorescence images of mouse kidney tissue sections of control mice on a normal salt (NS) diet (A) or a low-salt (LS) diet (B) as well as MD-mTORgof mice on a NS diet (C) or a LS diet (D) with renin labeling (in red) and tissue autofluorescence (Autofl; in green) for morphological details. Nuclei are labeled blue with DAPI. The macula densa (MD) cell plaque is highlighted (solid white arrows). E: statistical summary of the average number of renin-positive cells/juxtaglomerular area in control (n = 6) and MD-mTORgof mice (n = 8) on either the NS or LS diet. In each kidney tissue section, the number of renin-positive cells in 10 juxtaglomerular areas was counted using high-resolution z-stacks of the entire volume of the glomerulus in which single renin-positive cells could be clearly visualized based on immunofluorescence and DAPI labeling. Each data point in the graph corresponds to an average of the number of renin-positive cells per juxtaglomerular area from 10 glomeruli per animal. Data are expressed as means ± SE. *P < 0.05 and **P < 0.01 by one-way ANOVA with Tukey’s multiple comparisons test. G, glomerulus; mTOR, mammalian target of rapamycin. Scale bars = 35 µm.
Figure 8.
Figure 8.
Changes in macula densa (MD) signaling in MD-mTORgof mice. A: immunoblots for renin, cyclooxygenase 2 (COX2), total ERK1/2 (tERK1/2), phosphorylated ERK1/2 (pERK1/2), total p38 (tp38), phosphorylated p38 (pp38), microsomal prostaglandin E2 synthase 1 (mPGES1), and pappalysin 2 (Pappa2) in kidney cortex homogenates from control and MD-mTORgof mice (n = 7). Statistical summary of immunoblot density for renin (B), COX2 (C), [pERK1/2]/[tERK1/2] (D), [pp38]/[tp38] (E), mPGES1 (F), and Pappa2 (G). Data are expressed as means ± SE. *P < 0.05 by an unpaired Student’s t test. MW, molecular weight; ns, not significant.

Similar articles

Cited by

References

    1. Yu A, Chertow G, Luyckx V, Marsden P, Skorecki K, Taal M (Editors). Anatomy of the kidney. In: Brenner and Rector's The Kidney E-Book. Amsterdam, The Netherlands: Elsevier Health Sciences, 2015, p. 42–82.
    1. Peti-Peterdi J, Harris RC. Macula densa sensing and signaling mechanisms of renin release. J Am Soc Nephrol 21: 1093–1096, 2010. doi:10.1681/ASN.2009070759. - DOI - PMC - PubMed
    1. Cangiotti AM, Lorenzi T, Zingaretti MC, Fabri M, Morroni M. Polarized ends of human macula densa cells: ultrastructural investigation and morphofunctional correlations. Anat Rec (Hoboken) 301: 922–931, 2018. doi:10.1002/ar.23759. - DOI - PubMed
    1. Sipos A, Vargas S, Peti-Peterdi J. Direct demonstration of tubular fluid flow sensing by macula densa cells. Am J Physiol Renal Physiol 299: F1087–F1093, 2010. doi:10.1152/ajprenal.00469.2009. - DOI - PMC - PubMed
    1. Gyarmati G, Shroff UN, Riquier-Brison A, Kriz W, Kaissling B, Neal CR, Arkill KP, Ahmadi N, Gill IS, Moon JY, Desposito D, Peti-Peterdi J. A new view of macula densa cell microanatomy. Am J Physiol Renal Physiol 320: F492–F504, 2021. doi:10.1152/ajprenal.00546.2020. - DOI - PMC - PubMed

Publication types

MeSH terms