

Choosing and changing the analysis scale in non-inferiority trials with a binary outcome
- PMID: 34693789
- PMCID: PMC8847766
- DOI: 10.1177/17407745211053790
Choosing and changing the analysis scale in non-inferiority trials with a binary outcome
Abstract
Background: The size of the margin strongly influences the required sample size in non-inferiority and equivalence trials. What is sometimes ignored, however, is that for trials with binary outcomes, the scale of the margin - risk difference, risk ratio or odds ratio - also has a large impact on power and thus on sample size requirement. When considering several scales at the design stage of a trial, these sample size consequences should be taken into account. Sometimes, changing the scale may be needed at a later stage of a trial, for example, when the event proportion in the control arm turns out different from expected. Also after completion of a trial, a switch to another scale is sometimes made, for example, when using a regression model in a secondary analysis or when combining study results in a meta-analysis that requires unifying scales. The exact consequences of such switches are currently unknown.
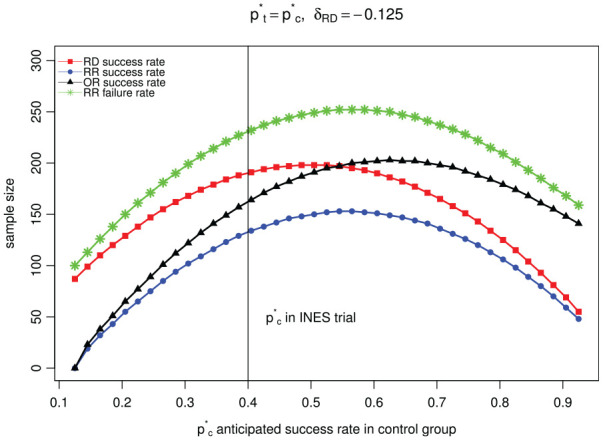
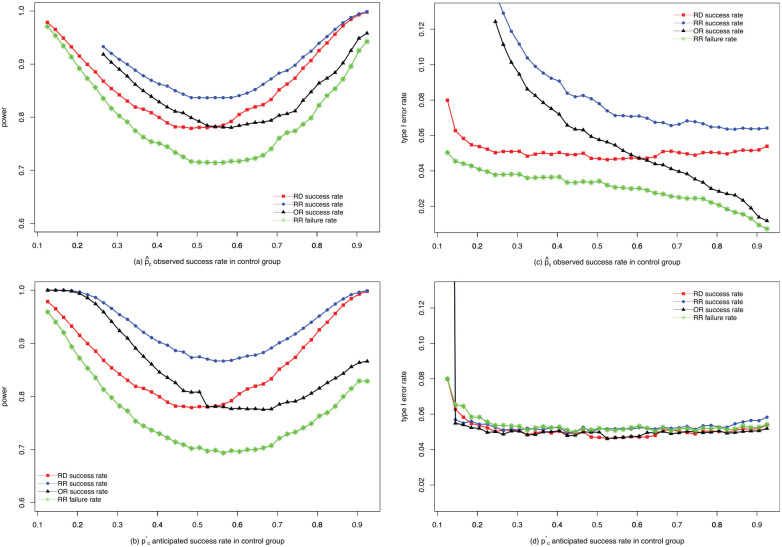
Methods and results: This article first outlines sample size consequences for different choices of analysis scale at the design stage of a trial. We add a new result on sample size requirement comparing the risk difference scale with the risk ratio scale. Then, we study two different approaches to changing the analysis scale after the trial has commenced: (1) mapping the original non-inferiority margin using the event proportion in the control arm that was anticipated at the design stage or (2) mapping the original non-inferiority margin using the observed event proportion in the control arm. We use simulations to illustrate consequences on type I and type II error rates. Methods are illustrated on the INES trial, a non-inferiority trial that compared single birth rates in subfertile couples after different fertility treatments. Our results demonstrate large differences in required sample size when choosing between risk difference, risk ratio and odds ratio scales at the design stage of non-inferiority trials. In some cases, the sample size requirement is twice as large on one scale compared with another. Changing the scale after commencing the trial using anticipated proportions mainly impacts type II error rate, whereas switching using observed proportions is not advised due to not maintaining type I error rate. Differences were more pronounced with larger margins.
Conclusions: Trialists should be aware that the analysis scale can have large impact on type I and type II error rates in non-inferiority trials.
Keywords: Non-inferiority trial; non-inferiority margin; odds ratio; risk difference; risk ratio; sample size calculation.
Conflict of interest statement
Figures
Similar articles
-
The Smooth Away From Expected (SAFE) non-inferiority frontier: theory and implementation with an application to the D3 trial.Trials. 2023 Aug 25;24(1):556. doi: 10.1186/s13063-023-07586-5. Trials. 2023. PMID: 37626423 Free PMC article. Clinical Trial.
-
Handling an uncertain control group event risk in non-inferiority trials: non-inferiority frontiers and the power-stabilising transformation.Trials. 2020 Feb 6;21(1):145. doi: 10.1186/s13063-020-4070-4. Trials. 2020. PMID: 32029000 Free PMC article.
-
Design of non-inferiority randomized trials using the difference in restricted mean survival times.Clin Trials. 2018 Oct;15(5):499-508. doi: 10.1177/1740774518792259. Epub 2018 Aug 3. Clin Trials. 2018. PMID: 30074407 Free PMC article.
-
Folic acid supplementation and malaria susceptibility and severity among people taking antifolate antimalarial drugs in endemic areas.Cochrane Database Syst Rev. 2022 Feb 1;2(2022):CD014217. doi: 10.1002/14651858.CD014217. Cochrane Database Syst Rev. 2022. PMID: 36321557 Free PMC article.
-
Confidence interval of risk difference by different statistical methods and its impact on the study conclusion in antibiotic non-inferiority trials.Trials. 2021 Oct 16;22(1):708. doi: 10.1186/s13063-021-05686-8. Trials. 2021. PMID: 34656155 Free PMC article.
Cited by
-
A comparison of different population-level summary measures for randomised trials with time-to-event outcomes, with a focus on non-inferiority trials.Clin Trials. 2023 Dec;20(6):594-602. doi: 10.1177/17407745231181907. Epub 2023 Jun 20. Clin Trials. 2023. PMID: 37337728 Free PMC article. Clinical Trial.
-
The Role of Outcome Response Rate in Planning Biosimilar Studies Using Different Evaluation Metrics.Pharmaceuticals (Basel). 2025 Feb 12;18(2):243. doi: 10.3390/ph18020243. Pharmaceuticals (Basel). 2025. PMID: 40006056 Free PMC article.
-
Summary measures in non-inferiority clinical trials with a time-to-event outcome: an empirical comparison of power.BMC Med Res Methodol. 2025 May 24;25(1):139. doi: 10.1186/s12874-025-02576-4. BMC Med Res Methodol. 2025. PMID: 40413390 Free PMC article.
-
The Smooth Away From Expected (SAFE) non-inferiority frontier: theory and implementation with an application to the D3 trial.Trials. 2023 Aug 25;24(1):556. doi: 10.1186/s13063-023-07586-5. Trials. 2023. PMID: 37626423 Free PMC article. Clinical Trial.
-
Assessment of Noninferiority Margins in Cardiovascular Medicine Trials.JACC Adv. 2024 Jun 5;3(7):101021. doi: 10.1016/j.jacadv.2024.101021. eCollection 2024 Jul. JACC Adv. 2024. PMID: 39130003 Free PMC article.
References
-
- Kaul S, Diamond GA. Good enough: a primer on the analysis and interpretation of noninferiority trials. Ann Intern Med 2006; 145: 62–69. - PubMed
-
- Mauri L, D’Agostino RB. Challenges in the design and interpretation of noninferiority trials. N Engl J Med 2017; 377: 1357–1367. - PubMed
-
- Wellek S. Statistical methods for the analysis of two-arm non-inferiority trials with binary outcomes. Biom J 2005; 47(1): 48–61; discussion 99. - PubMed
-
- Rousson V, Seifert B. A mixed approach for proving non-inferiority in clinical trials with binary endpoints. Biom J 2008; 50(2): 190–204. - PubMed
Publication types
MeSH terms
Grants and funding
LinkOut - more resources
Full Text Sources
Medical
