. 2021 Jan-Dec;13(1):1988836.
doi: 10.1080/19490976.2021.1988836.

Fungal lysozyme leverages the gut microbiota to curb DSS-induced colitis

Affiliations

Fungal lysozyme leverages the gut microbiota to curb DSS-induced colitis

Ida Søgaard Larsen et al. Gut Microbes. 2021 Jan-Dec.

Abstract

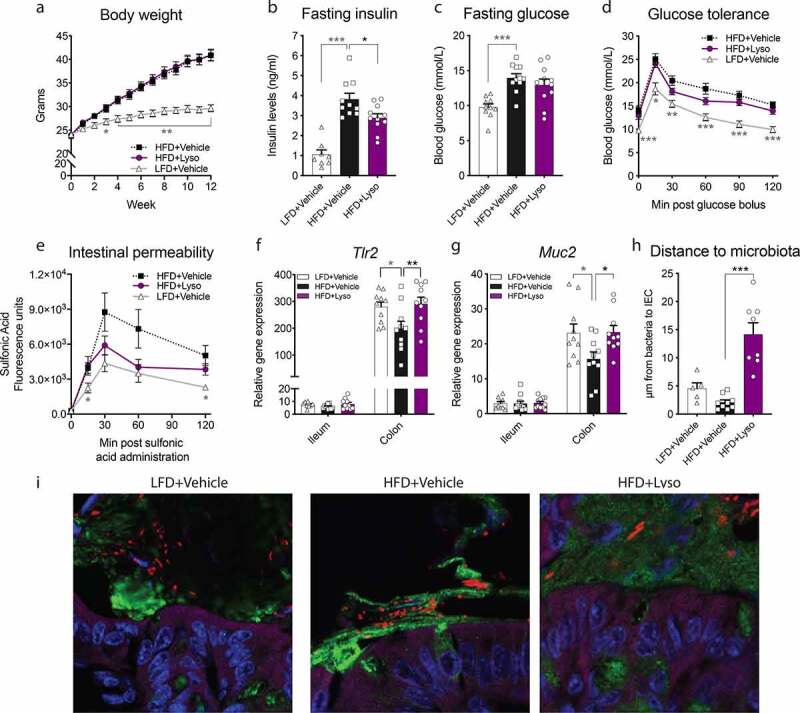
Colitis is characterized by colonic inflammation and impaired gut health. Both features aggravate obesity and insulin resistance. Host defense peptides (HDPs) are key regulators of gut homeostasis and generally malfunctioning in above-mentioned conditions. We aimed here to improve bowel function in diet-induced obesity and chemically induced colitis through daily oral administration of lysozyme, a well-characterized HDP, derived from Acremonium alcalophilum.C57BL6/J mice were fed either low-fat reference diet or HFD ± daily gavage of lysozyme for 12 weeks, followed by metabolic assessment and evaluation of colonic microbiota encroachment. To further evaluate the efficacy of intestinal inflammation, we next supplemented chow-fed BALB/c mice with lysozyme during Dextran Sulfate Sodium (DSS)-induced colitis in either conventional or microbiota-depleted mice. We assessed longitudinal microbiome alterations by 16S amplicon sequencing in both models.Lysozyme dose-dependently alleviated intestinal inflammation in DSS-challenged mice and further protected against HFD-induced microbiota encroachment and fasting hyperinsulinemia. Observed improvements of intestinal health relied on a complex gut flora, with the observation that microbiota depletion abrogated lysozyme's capacity to mitigate DSS-induced colitis.Akkermansia muciniphila associated with impaired gut health in both models, a trajectory that was mitigated by lysozyme administration. In agreement with this notion, PICRUSt2 analysis revealed specific pathways consistently affected by lysozyme administration, independent of vivarium, disease model and mouse strain.Taking together, lysozyme leveraged the gut microbiota to curb DSS-induced inflammation, alleviated HFD-induced gastrointestinal disturbances and lowered fasting insulin levels in obese mice. Collectively, these data present A. alcalophilum-derived lysozyme as a promising candidate to enhance gut health.

Keywords: Gut health; colitis; high fat diet; host defense peptides; insulin resistance; intestinal inflammation; microbiota encroachment; microbiota function; mucus; muramidase.


Conflict of interest statement

NNK, EGWS, PBO and LBSH are employed at Novozymes A/S (NZAS). NZAS provided the test compound and filed a patent based on the enclosed findings (PCT/EP2018/050189). The views presented in this manuscript are those of the authors and not necessarily those of NZAS.

Figures

Figure 1.
Figure 1.
Lysozyme administration reduces fasting insulin levels associated with normalized Tlr2 and Muc2 expression in HFD-fed C57BL6/J mice. a) Weekly body weight measure in grams during the study period. b) 6 h fasting insulin levels in week 10 of the study period. c) 6 h fasting blood glucose levels in week 10 of the study. d) Blood glucose levels during oral glucose tolerance test (oGTT) in week 10 with 2 µg glucose per g lean mass measured by MR scans. e) Fluorescence measured in plasma sampled at indicated minutes post oral sulfonic acid administration. f) Relative gene expression of Toll-like receptor (Tlr) 2 in ileum and colon tissue assessed by RT-qPCR. g) Relative Mucin (Muc) 2 gene expression in ileum and colon tissue assessed by RT-qPCR. h) Distances of the closest bacteria to intestinal epithelial cells (IEC) in proximal colon per condition over three high-powered fields per mouse, with each dot representing the average distance to bacteria per field of 2–3 representative mice per group. i) Representative slides of confocal microscopy analysis of microbiota localization; Muc2 (green), actin (purple), bacteria (red) and DNA (blue). Each slide measures 70 × 70 µm. a, d, e) Graphs depict group mean ± SEM. Repeated-measures two-way ANOVA with Geisser-Greenhouse correction and Dunnet’s multiple comparisons test to HFD+Vehicle. b, c, f, g, h) Graphs depict group mean ± SEM and individual data points. One-way ANOVA with Dunnet’s multiple comparisons test comparing to HFD+Vehicle. a-h) * = p < .05, ** p < .01, *** p < .001. Grey asterisk indicates significant difference between LFD+Vehicle vs HFD+Vehicle and black indicates HFD+Vehicle vs HFD+Lyso
Figure 2.
Figure 2.
Gut microbiota composition and predicted functionality of HFD-fed C57BL6/J mice was modified by lysozyme administration a) Principle coordinate analysis (PCoA) of overall small intestine bacterial presence using unweighted UniFrac distances at the end of the study period sampled 3–5 h after the last lysozyme/vehicle administration. Centroids indicate group average. PERMANOVA test between LFD+Vehicle vs. HFD+Vehicle p = .002 and between HFD+Vehicle vs. HFD+Lyso p = .005. b) Mean relative abundance in % of 17 most abundant aggregated bacterial genera in the small intestine samples shown in a. Missing entries indicate unclassified family and/or genus. c) PCoA using weighted UniFrac distances of overall bacterial presence in fecal samples week 4, 8, and 12 after initiation of LFD/HFD feeding and Vehicle/Lysozyme administration, sampled approximately 24 hours since the latest lysozyme/vehicle administration. Centroids indicate group mean at the indicated week after study start. PERMANOVA test between LFD+Vehicle vs. HFD+Vehicle p < .01 at all sampled times. PERMANOVA test between HFD+Vehicle vs. HFD+Lyso p = .078 at week 4, p < .001 at week 8 and 12. d) Mean relative abundance in % of 17 most abundant aggregated bacterial genera in fecal samples in week 12 of the study. Missing entries indicate unclassified family and/or genus. e) ASVs with differential abundance (FDR adjusted p < .05) by DEseq2 analysis comparing fecal microbiota of HFD+Lysozyme to HFD+Vehicle at week 12 of the study. ASVs are categorized with their classified genus and colored by their classified phylum. Missing entries indicate unclassified genus. f) Relative abundance in % of genera found differentially abundant in e from baseline (0) over the study period (4–12) with similar baseline abundance between the groups and a tendency across the entire aggregated genus abundance. Graphs depict group mean and 75% CI. g) PCoA of predicted KEGG Orthologs in fecal samples from week 12 of the study using Bray-Curtis distance sampled approximately 24 hours since the latest lysozyme/vehicle administration. Centroids indicate group mean. PERMANOVA test between LFD+Vehicle vs HFD+Vehicle p = .67, HFD+Vehicle vs HFD+Lyso p = .006
Figure 3.
Figure 3.
Lysozyme dose-dependently prevents Dextran-sulfate sodium (DSS)-induced colitis in BALB/c mice a) Body weight in grams as group mean ± SEM at baseline (day −3), at the start of DSS-challenge (day 0), and the following study period until end of the study (day 5). b) Body weight change during DSS-challenge from day 0 to 5 during as % of body weight. c) Colon damage assessed by Wallace histological scoring at the end of the study period. Bars indicate group median and interquartile range. Kruskal–Wallis test and Dunn’s multiple comparisons test to the DSS+Vehicle group. d) Colon length in cm. e) Interleukin (IL)-1β and IL-6 cytokine levels in colon tissue as fold change to vehicle group. f) IL-10 and IL-12 cytokine levels in colon tissue as fold change to vehicle group. g) IL-17A and IL-25 cytokine levels in colon tissue as fold change to vehicle group. h) TNFα cytokine levels in colon tissue as fold change to vehicle group. b,d-h) Graphs depict mean ± SEM with individual data points. One-way ANOVA with Dunnet’s multiple comparisons test to DSS+Vehicle group. a-h) * = p < .05, ** p < .01, *** p < .001. Grey asterisk indicates significant difference between Vehicle+Vehicle vs DSS+Vehicle and black indicates comparisons between DSS+Vehicle vs Lyso-supplemented groups
Figure 4.
Figure 4.
Lysozyme partially protects against DSS-induced effects on microbiota composition in BALB/c mice a) Weighted UniFrac distance from fecal microbiota day −3 to 0 within the same mouse. Fecal pellets were sampled prior DSS-challenge and shows the changes bacterial composition induced by administration of two days vehicle or 1 mg/day lysozyme. b) PCoA using weighted UniFrac distances of overall bacterial abundances in ileum (Ile), cecum (Cec), and colon (Col) samples at the end of the study in day 5 sampled a day after the latest vehicle or lysozyme administration. Centroids indicate group mean. Ileum PERMANOVA test between DSS+Vehicle vs. Vehicle+Vehicle p = .164, DSS+Vehicle vs. DSS+Lyso1.0 mg p = .062. Cecum PERMANOVA test between DSS+Vehicle vs. Vehicle+Vehicle p = .001, DSS+Vehicle vs. DSS+Lyso1.0 mg p = .009. Colon PERMANOVA test between DSS+Vehicle vs. Vehicle+Vehicle p = .001, DSS+Vehicle vs. DSS+Lyso1.0 mg p = .001. c) Mean relative abundance in % of 17 most abundant aggregated bacterial genera in colon samples of the end of the study. Missing entries indicate unclassified family and/or genus. d) ASVs with differential abundance (FDR adjusted p < .05) by DEseq2 analysis comparing colon microbiota composition of DSS+Vehicle to DSS+Lyso1.0 mg group at day 5 of the study sampled a day after the latest vehicle or lysozyme administration. ASVs are categorized with their classified genus and colored by their classified phylum. Missing entries indicate unclassified genus and/or phylum. e) PCoA of KEGG orthologs using Bray-Curtis distances based on 16S rRNA gene amplicons of colon samples week 12. Centroids indicate the mean of each group. PERMANOVA test between Vehicle+Vehicle vs. DSS+Vehicle p = .016 and between DSS+Vehicle vs. DSS+Lyso1.0 mg p = .002
Figure 5.
Figure 5.
Lysozyme leverages the gut microbiota to alleviate DSS-induced colitis in BALB/c mice a) Body weight change during DSS-challenge from day 0 to 5 during as % of body weight in conventional mice. b) Colon damage in conventional mice assessed by Wallace histological scoring at the end of the study period. Bars indicate group median and interquartile range. Kruskal–Wallis test and Dunn’s multiple comparisons test to the DSS+Vehicle group. c) Colon length in cm in conventional mice. d) Cecum wet weight in mg in conventional mice. e) Spleen weight in grams in conventional mice. f) Adapted histopathological colitis scoring of H&E-stained colon slides from conventional mice shown in g. g) Representative H&E-stained image of colon sections from the indicated group. h-n) As a-g in mice receiving antibiotics (ampicillin and neomycin) in drinking water. h) Colon length in cm in mice receiving antibiotics. Kruskal–Wallis test and Dunn’s multiple comparisons test to the DSS+Vehicle group. a, c-e, h, j-l) Graphs depict mean ± SEM with individual data points. One-way ANOVA with Dunnet’s multiple comparisons test to DSS+Vehicle group. a-f, h-m) * = p < .05, ** p < .01, *** p < .001. Grey asterisk indicates significant difference between Vehicle+Vehicle vs DSS+Vehicle and black indicates comparisons between DSS+Vehicle vs Lyso-supplemented groups in both conventional mice and mice receiving antibiotics
Figure 6.
Figure 6.
Lysozyme effects in HFD-fed C57BL/6 J and DSS-induced colitis BALB/c mice HFD and DSS induced intestinal changes in both used mouse models. Despite changes in study design, phenotypes, sex, mouse strain, diet, lysozyme dosage and duration, and experimental facility lysozyme ameliorated both diet- and DSS-induced phenotypes. This included consistent changes in several bacterial abundances and the predicted microbial functions

Similar articles

Cited by

References

    1. Volynets V, Louis S, Pretz D, Lang L, Ostaff MJ, Wehkamp J, Bischoff SC.. Intestinal barrier function and the gut microbiome are differentially affected in mice fed a western-style diet or drinking water supplemented with fructose. J. Nutr. 2017;147:770–20. doi:10.3945/jn.116.242859. - DOI - PubMed
    1. Lam YY, Ha CWY, Hoffmann JMA, Oscarsson J, Dinudom A, Mather TJ, Cook DI, Hunt NH, Caterson ID, Holmes AJ, et al. Effects of dietary fat profile on gut permeability and microbiota and their relationships with metabolic changes in mice. Obesity. 2015;23(7):1429–1439. doi:10.1002/oby.21122. - DOI - PubMed
    1. Gruber L, Kisling S, Lichti P, Martin F-P, May S, Klingenspor M, Lichtenegger M, Rychlik M, Haller D. High fat diet accelerates pathogenesis of murine crohn’s disease-like ileitis independently of obesity. PLoS One. 2013;8(8):1–13. doi:10.1371/journal.pone.0071661. - DOI - PMC - PubMed
    1. Jensen BAH, Nielsen TS, Fritzen AM, Holm JB, Fjære E, Serup AK, Borkowski K, Risis S, Pærregaard SI, Søgaard I, et al. Dietary fat drives whole-body insulin resistance and promotes intestinal inflammation independent of body weight gain. Metabolism. 2016;65(12):1706–1719. doi:10.1016/j.metabol.2016.09.002. - DOI - PubMed
    1. Ridaura, Vanessa K.Faith, Jeremiah J.Rey, Federico E.Knight, RobGordon, Jeffrey I. The effect of diet on the human gut microbiome: a metagenomic analysis in humanized gnotobiotic mice. Sci. Transl. Med. 2009;1:6ra14–6ra14. - PMC - PubMed

Publication types

Supplementary concepts

LinkOut - more resources