

Structure of a human replisome shows the organisation and interactions of a DNA replication machine
- PMID: 34694004
- PMCID: PMC8634136
- DOI: 10.15252/embj.2021108819
Structure of a human replisome shows the organisation and interactions of a DNA replication machine
Erratum in
-
Structure of a human replisome shows the organisation and interactions of a DNA replication machine.EMBO J. 2023 Nov 15;42(22):e115685. doi: 10.15252/embj.2023115685. Epub 2023 Oct 16. EMBO J. 2023. PMID: 37840470 Free PMC article.
Abstract
The human replisome is an elaborate arrangement of molecular machines responsible for accurate chromosome replication. At its heart is the CDC45-MCM-GINS (CMG) helicase, which, in addition to unwinding the parental DNA duplex, arranges many proteins including the leading-strand polymerase Pol ε, together with TIMELESS-TIPIN, CLASPIN and AND-1 that have key and varied roles in maintaining smooth replisome progression. How these proteins are coordinated in the human replisome is poorly understood. We have determined a 3.2 Å cryo-EM structure of a human replisome comprising CMG, Pol ε, TIMELESS-TIPIN, CLASPIN and AND-1 bound to replication fork DNA. The structure permits a detailed understanding of how AND-1, TIMELESS-TIPIN and Pol ε engage CMG, reveals how CLASPIN binds to multiple replisome components and identifies the position of the Pol ε catalytic domain. Furthermore, the intricate network of contacts contributed by MCM subunits and TIMELESS-TIPIN with replication fork DNA suggests a mechanism for strand separation.
Keywords: CMG helicase; DNA replication; cryo-EM; fork protection complex; replisome.
© 2021 MRC Laboratory of Molecular Biology. Published under the terms of the CC BY 4.0 license.
Conflict of interest statement
The authors declare that they have no conflict of interest.
Figures
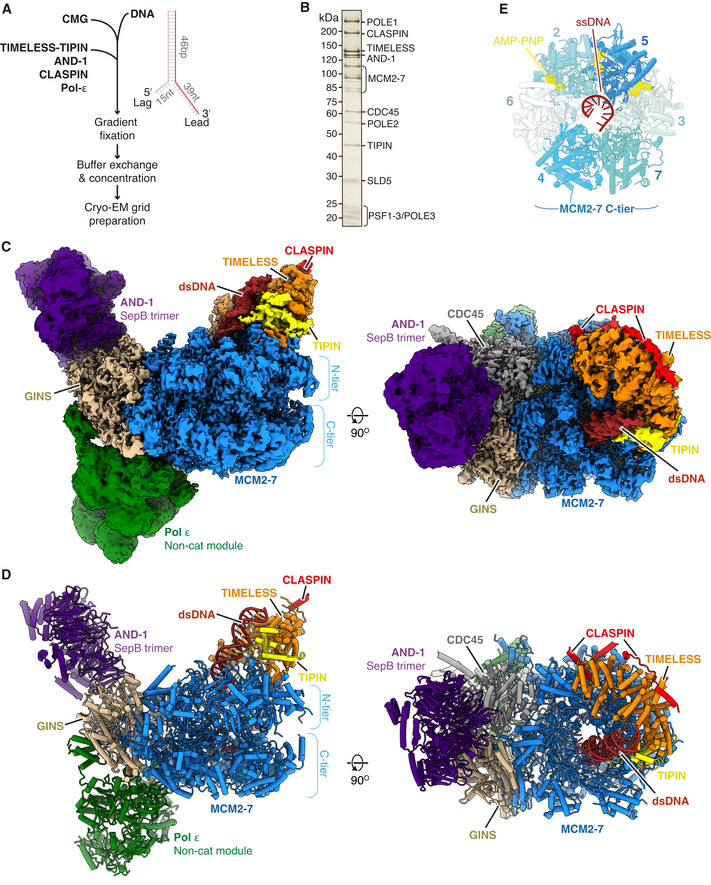
- A
Schematic illustrating the in vitro reconstitution method of sample preparation for cryo‐EM experiments.
- B
Silver‐stained SDS–PAGE of a peak fraction from a native glycerol gradient (Fraction 13, Appendix Fig S1C).
- C, D
Multiple views of the Cryo‐EM density map (C) and the corresponding atomic model displayed as stubs and cylinders (D) for the core human replisome. The cryo‐EM density displayed in (C) is a composite map generated by combining the highest resolution regions of discrete refinements using Phenix Combine‐focussed‐maps.
- E
End‐on view of the MCM2‐7 C‐tier illustrating which subunits engage ssDNA, and AMP‐PNP occupancy.
- A
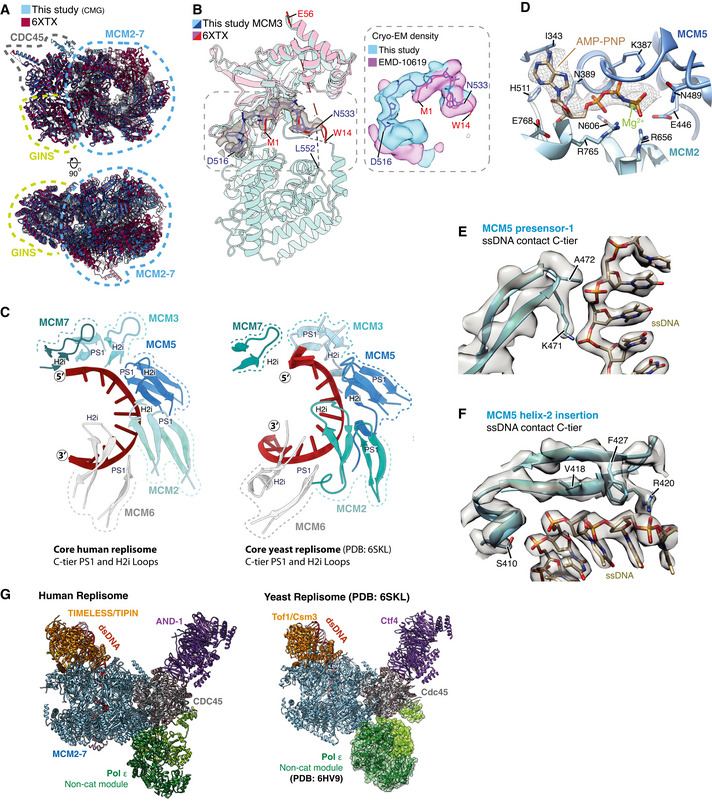
Comparison of the MCM N‐tier, GINS and CDC45 between the core replisome structure from this study (blue) (PDB: 7PFO) and the hsCMG:ssDNA structure (red) (PDB: 6XTX) (Rzechorzek et al, 2020).
- B
(Left) Comparison of the MCM3 model from this study (blue) with the N‐tier lobe of MCM3 from the hsCMG:ssDNA structure (pink). Cryo‐EM density for residues D516‐N533 from this study is shown as a transparent grey surface. This region was assigned to the N‐terminal extension of a longer MCM3 isoform in the hsCMG:ssDNA structure (Rzechorzek et al, 2020). (Right) Overlay of cryo‐EM density from this study (blue) and the previous hsCMG:ssDNA map (pink). Despite the isoform used in this study not containing this N‐terminal extension, almost identical density is observed, which in our map shows clear connectivity with the MCM3 C‐terminal domain. We therefore attribute this density to MCM3 residues 524–533.
- C
Comparison of ssDNA engagement by the PS1 and H2i loops between the core human (left) and S. cerevisiae replisomes (right) (PDB: 6SKL) (Baretić et al, 2020).
- D
Detailed view of the MCM2:5 ATPase site. Cryo‐EM density for AMP‐PNP is shown as mesh.
- E, F
Models illustrating MCM5 engagement with ssDNA in the C‐tier. Cryo‐EM density represented as transparent grey surface with selected side chains contacting ssDNA displayed. (E) Representative density for the PS1 loop (MCM5) interacting with the phosphodiester ssDNA backbone. (F) Representative density for the H2i loop (MCM5) interacting with ssDNA in the C‐tier.
- G
Comparison of the core human (left) and S. cerevisiae (right) (PDB: 6SKL) replisomes. Models are coloured as in Fig 1C. For the S. cerevisiae replisome, the Pol ε non‐cat module has been positioned based on the structure of scCMG:Pol ε (PDB: 6HV9) (Goswami et al, 2018).
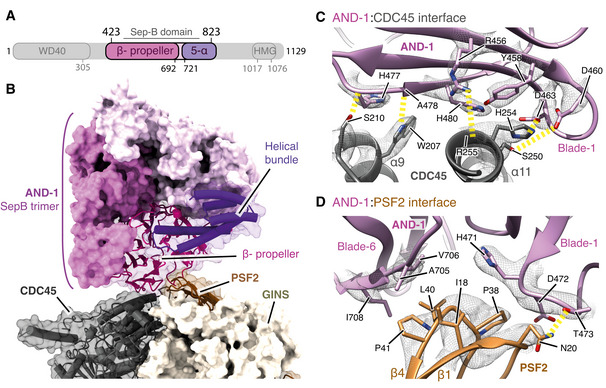
Schematic for the domain architecture of AND‐1. Regions visualised in this structure are coloured, with domain boundaries demarcated by primary sequence numbering.
Model of the AND‐1 SepB domain trimer bound to CMG rendered as a surface. The AND‐1 monomer mediating the interaction with PSF2 and CDC45 is displayed using both transparent surface rendering and backbone cartoon rendering.
Detailed view of the AND‐1:CDC45 interface. Side chains of residues key to this interaction are displayed and annotated. The cryo‐EM density for these selected residues is displayed as a transparent mesh with yellow dashed lines indicating hydrogen‐bond formation.
Detailed view of the interface between AND‐1 and PSF2 displayed as in (C).
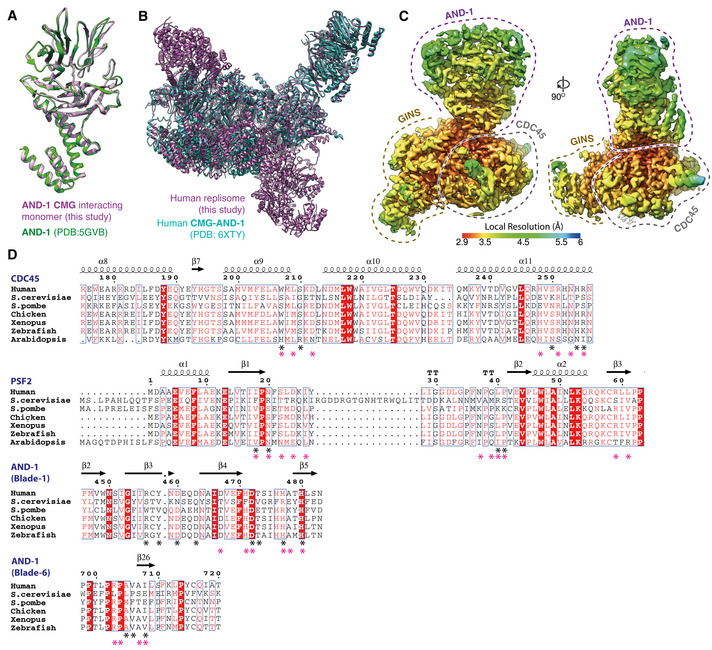
Comparison of the AND‐1 SepB domain from the core replisome (this study, purple) with the crystal structure of the isolated protein (PDB: 5GVB, green) (Guan et al, 2017).
Comparison of the positioning of AND‐1 in the core replisome (this study, purple) with the CMG:AND‐1 structure (PDB: 6XTY, cyan) (Rzechorzek et al, 2020).
Multi‐body cryo‐EM map comprising AND‐1, CDC45 and GINS coloured by local resolution according to inset key.
Multiple sequence alignments of residues involved in the AND‐1/CMG interface. Residues making specific AND‐1/CMG or Ctf4/CMG interface contacts are marked by a black (human) or pink (S. cerevisiae) asterisk. Alignments carried out using NCBI Clustal Omega (Sievers & Higgins, 2014) and visualised using ESPrit (Robert & Gouet, 2014) with the primary human sequence indicated. Uniprot ID for sequences used for CDC45 alignment: H. sapiens (O75419‐1), S. cerevisiae (Q08032‐1), S. pombe (O74113‐1), G. gallus (E1BYS7‐1), X. laevis (Q9YHZ6‐1), D. rerio (Q7ZU79‐1), A. thaliana (Q9LSG6‐1). PSF2 alignment: H. sapiens (Q03519‐1), S. cerevisiae (P40359‐1), S. pombe (O94329‐1), G. gallus (A0A1D5PQM4‐1), X. laevis (Q7ZT46‐1), D. rerio (Q4VBJ6‐1), A. thaliana (Q9C7A8‐1). AND‐1 alignment: H. sapiens (O75717‐1), S. cerevisiae (Q01454‐1), S. pombe (Q9C107‐1), G. gallus (P30985‐1), X. laevis (O13046‐1), D. rerio (A0A0R4J7S6‐1), A. thaliana (Q9ZQX6‐1).
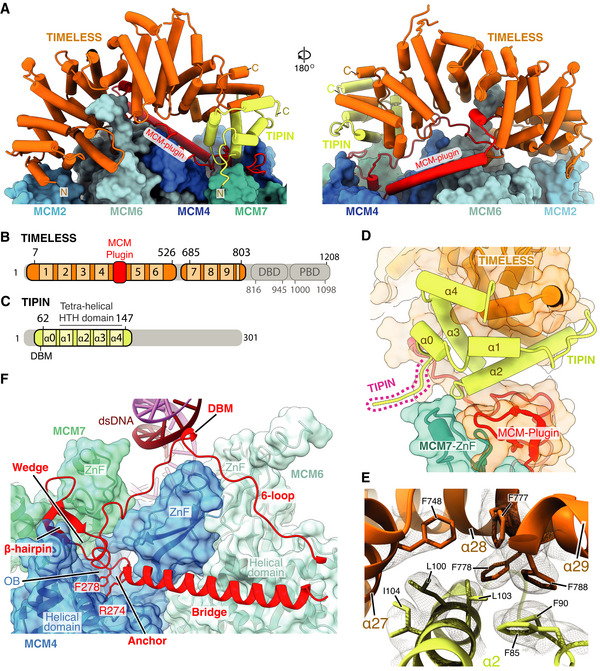
Atomic model for TIMELESS‐TIPIN bound to MCM displayed using stubs and cylinders, with N‐ and C‐termini labelled. Models for the MCM2, 6, 4 and 7 subunits are displayed using surface rendering.
Schematic for the domain architecture of TIMELESS. Regions of the protein visualised in this study are coloured, with domain boundaries and chain breaks demarcated with primary sequence numbering. The TIMELESS α‐solenoid helical repeats are numbered 1‐9. DBD–DNA‐binding domain, PDB–PARP1 binding domain.
Schematic for the domain architecture of TIPIN displayed in the same manner as (B), with helices α0–4 indicated.
Overview of TIPIN and its interfaces with TIMELESS and the MCM7 ZnF. TIPIN is displayed using cartoon cylinder rendering and TIMELESS and MCM7 are represented using both cartoon and transparent surface rendering.
Detailed view of the hydrophobic interface formed between TIMELESS and α2 of TIPIN. Side chains of key residues are displayed and their primary sequence annotated. The cryo‐EM density for these selected residues is displayed as a transparent mesh.
Overview of the TIMELESS MCM‐plugin interacting with the MCM2‐7 N‐tier. The MCM‐plugin is visualised using cartoon rendering and coloured red. MCM7, 4 and 6 are visualised using both cartoon and transparent surface rendering and are coloured according to subunit. The structural elements of the MCM‐plugin involved in binding to the N‐tier are labelled.
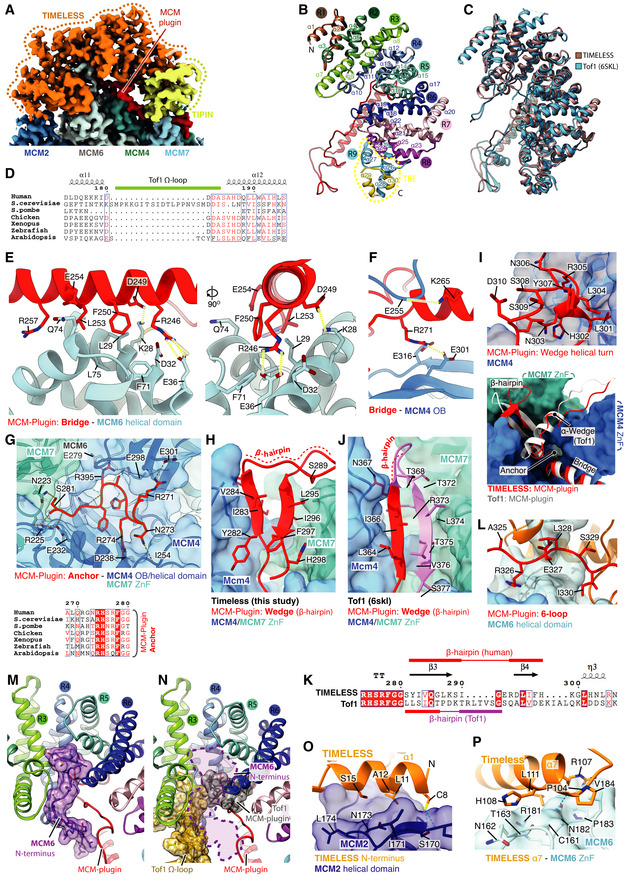
- A
Cryo‐EM density coloured according to protein chain occupancy, except for the TIMELESS “MCM‐plugin” element which is highlighted in red. For clarity DNA density is not shown.
- B
Assignment of the TIMELESS helical repeats. Model is coloured according to helical repeat and the α helices numbered.
- C
Structural comparison between TIMELESS from this study (brown) and yeast Tof1 (blue) (PDB: 6SKL) (Baretić et al, 2020).
- D
Multiple sequence alignment region covering the Tof‐1 Ω‐loop. All alignments in the figure were carried out using NCBI Clustal Omega and visualised using ESPrit with the primary human sequence indicated. Uniprot ID for sequences used for TIMELESS alignments: H. sapiens (Q9UNS1‐1), S. cerevisiae (P53840‐1), S. pombe (Q9UUM2‐1), G. gallus (Q8QGQ6‐1), X. laevis (A0A6I8PXH0‐1), D. rerio (E7FGL0‐1), A. thaliana (A0A1P8B9S9‐1).
- E–J, L
Detailed views of the interactions between the TIMELESS MCM‐Plugin and specific MCM subunits as indicated.
- G
(Bottom) multiple sequence alignment covering residues that form the TIMELESS Anchor motif, alignment carried out as described in EV3D.
- K
Sequence alignment of Wedge from H. sapiens TIMELESS and S. cerevisiae Tof1 (PDB: 6SKL) (Baretić et al, 2020), alignment carried out as described in EV3D.
- M
The position of the MCM6 N‐terminus (purple), which occupies a cavity formed by helical repeats 3, 4 and 5 of TIMELESS and the MCM‐plugin. Models shown as cartoons with the MCM6 N‐terminus also displayed using transparent surface rendering.
- N
The cavity occupied by the MCM6 N‐terminus in the core human replisome is partially blocked by the Tof‐1 Ω‐loop and MCM‐plugin in S. cerevisiae (PDB: 6SKL) (Baretić et al, 2020). Model of TIMELESS, displayed as a cartoon, overlaid with the Tof‐1 Ω‐loop (gold) and Tof‐1 MCM‐plugin (grey) displayed as a cartoon with transparent surface rendering. The approximate position adopted by the MCM6 N‐terminus in the core human replisome is indicated with a dashed purple line.
- O, P
Detailed views of the interactions between the TIMELESS α‐solenoid and MCM2 N‐terminal helical domain (O) and MCM6 zinc finger (P). TIMELESS model displayed using cartoon rendering with the surface of MCM2 and MCM6 displayed using transparent surface rendering.
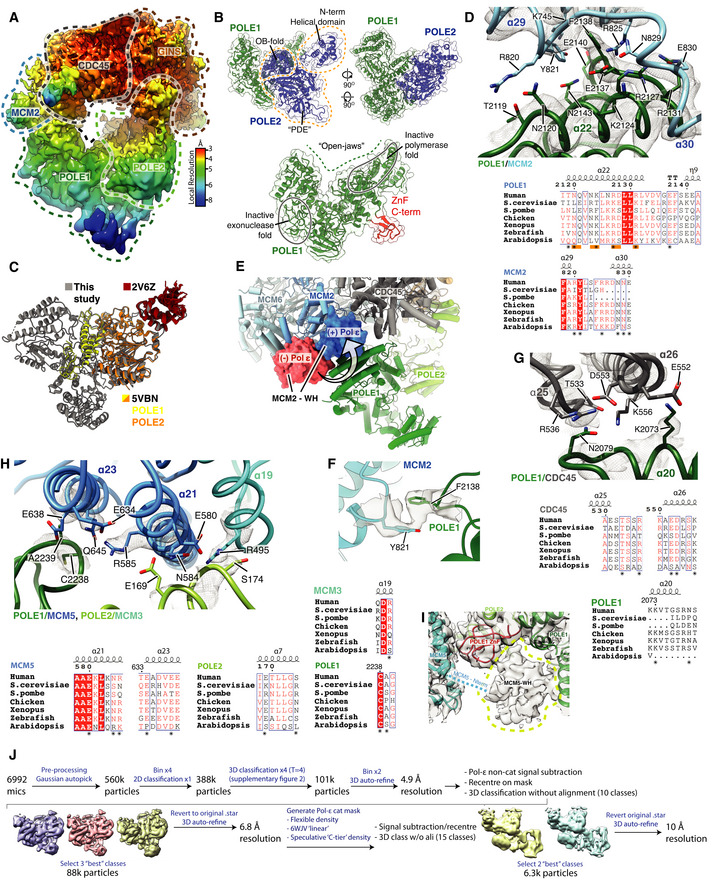
Cryo‐EM map obtained using MultiBody refinement (Nakane et al, 2018) masking over the Pol ε non‐catalytic module, CDC45 and GINS. Map coloured by local resolution according to inset key.
Model for the Pol εnon‐cat domain as part of the core human replisome (other replisome components not shown). Models displayed as cartoons overlayed with transparent surface rendering. (Top) POLE1 is coloured green and POLE2 in blue. POLE2 domains are annotated and their position indicated using dashed lines. (Bottom) Model for POLE1 displaying the “wide‐open jaw” configuration. Approximate positions of the inactive polymerase and exonuclease motifs are indicated and the C‐terminal ZnF coloured red.
Comparison between the structure of the Pol εnon‐cat domain from this study (grey) with previous structures of POLE2 (orange) with a C‐terminal region of POLE1 (Baranovskiy et al, 2017) (yellow) (PDB: 5VBN) and the N‐terminal helical domain of POLE2 (red) (PDB: 2V6Z) (Nuutinen et al, 2008).
(Top) Detailed view of the interface between POLE1 (green) and the MCM2 winged‐helix domain (blue). Atomic models visualised using cartoon rendering with selected side chains displayed and corresponding cryo‐EM density is overlaid in transparent mesh. (Bottom) Multiple sequence alignment for residues involved in the MCM2‐WH/POLE1 interface. Orange bars indicate the pattern of charge conserved residues along the same face of POLE1 α22, residues that make inter‐protein contacts are marked with an asterisk. All alignments in the figure were carried out using NCBI Clustal Omega and visualised using ESPrit with the primary human sequence indicated. Uniprot ID for sequences used for POLE1 alignment: H. sapiens (Q07864‐1), S. cerevisiae (P21951‐1), S. pombe (P87154‐1), G. gallus (E1C5P2‐1), X. laevis (A0A1L8HZP3‐1), D. rerio (B0V351‐1), A. thaliana (F4HW04‐1). MCM2 alignment: H. sapiens (P49736‐1), S. cerevisiae (P29469‐1), S. pombe (P40377‐1), G. gallus (F1NB20‐1), X. laevis (P55861‐1), D. rerio (A0A0R4IF65‐1), A. thaliana (Q9LPD9‐1).
Model highlighting the repositioning of the MCM2 WH domain following Pol ε engagement with CMG. Replisome model displayed using cylinder and stub cartoon rendering. The position of the MCM2 WH domain is displayed using surface rendering in the absence of Pol ε (Rzechorzek et al, 2020) (red) and presence (blue).
Model visualising the ring‐stacking interaction between MCM2 Y821 (blue) and POLE1 F2138 (green). Cryo‐EM density is displayed as a transparent surface.
(Top) Detailed view of the interface between POLE1 and the CDC45 as shown as in (C). (Bottom) Multiple sequence alignment for residues involved in the POLE1/CDC45 interface. Residues that make inter‐protein contacts are marked with an asterisk. Uniprot ID for sequences used for POLE1 alignment is as described in (C) and Uniprot IDs used for the CDC45 alignment are as described in Fig EV2D.
(Top) Detailed view of the interface involving POLE1, POLE2 and MCM5 as shown as in (C). (Bottom) Multiple sequence alignment for residues involved in the POLE1/POLE2/MCM5 interface. Residues that make inter‐protein contacts are marked with an asterisk. Uniprot ID for sequences used for POLE1 alignment are as described in panel b. Uniprot IDs used for POLE2 alignment: H. sapiens (P56282‐1), S. cerevisiae (P24482‐1), S. pombe (O94263‐1), G. gallus (Q5ZKQ6‐1), X. laevis (Q9DGB4‐1), D. rerio (Q8JHG8‐1), A. thaliana (Q500V9‐1). MCM5 alignment: H. sapiens (P33992‐1), S. cerevisiae (P29496‐1), S. pombe (P41389‐1), G. gallus (Q5ZKL0‐1), X. laevis (P55862‐1), D. rerio (F1QK71‐1), A. thaliana (O80786‐1).
Low threshold cryo‐EM map, displayed as a transparent grey surface, for the complete core human replisome highlighting unmodelled density, in the same location as the MCM5 winged‐helix domain in previous S. cerevisiae structures, circled with a dashed yellow line.
Schematic describing the processing pipeline used to obtain a cryo‐EM reconstruction containing additional ordered density for the Pol ε catalytic module.
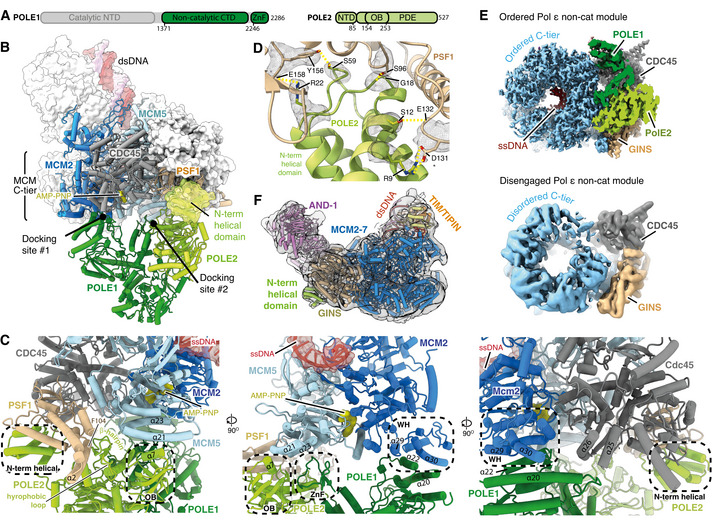
Primary structure diagram for POLE1 and POLE2. Regions of the protein visualised in this study are coloured and domain boundaries are demarcated using primary sequence numbering.
Overview of the interactions between the Pol ε non‐cat module and hsCMG. POLE1, POLE2 and the hsCMG subunits with which they interact (MCM2, MCM5, PSF1 and CDC45) are coloured according to subunit and displayed using cartoon rendering. The N‐terminal helical domain of POLE2 that interacts with PSF1 is also shown as a transparent surface. The remaining hsCMG subunits are shown with light grey surface rendering and dsDNA is shown as a coloured surface. AND‐1 is not shown to aid visualisation of the interactions between the Pol ε non‐cat module and hsCMG.
Expanded views of the interactions between the Pol ε non‐cat module and hsCMG.
Detailed view of the interface between the POLE2 N‐terminal helical domain and PSF1. Cryo‐EM density is displayed as a grey mesh.
Comparison of cryo‐EM maps where the Pol ε non‐cat module is either ordered or disengaged from the MCM C‐tier as indicated. See Fig EV4 for details of the cryo‐EM maps. Maps are coloured as in Fig 1C.
Cryo‐EM map where the Pol ε non‐cat module is disengaged from the MCM C‐tier displayed as a transparent surface with the structure of the core human replisome, coloured as in Fig 1D, docked into the density. Clear density is observed for the POLE2 N‐terminal helical domain bound to PSF1.
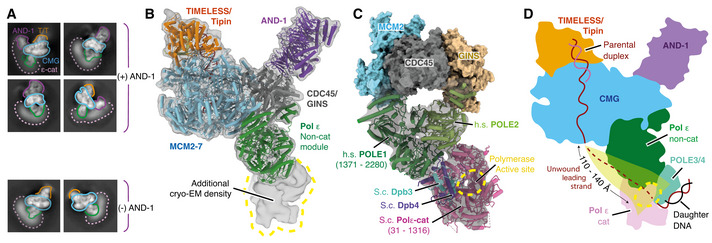
2D classes for the core human replisome for particles containing and lacking AND‐1 density as indicated. Additional diffuse density that we attribute to the Pol ε catalytic domain is indicated (dotted pink line).
Model for the core human replisome docked into a cryo‐EM map (transparent grey) displaying ordered density, continuous with the Pol ε non‐cat module, projecting away from CMG. Map obtained using extensive processing methods described in Fig EV4J.
Model of the budding yeast (S.c.) Pol ε catalytic domain and Dpb3/4 (PDB: 6WJV) (Yuan et al, 2020b) rigid‐body‐docked into the unmodelled cryo‐EM density described in (B). Models for the human non‐catalytic and yeast catalytic modules are visualised using cylinders and stubs cartoon rendering with MCM2, CDC45 and GINS visualised using surface rendering.
Illustration of the human replisome with Pol ε adopting the linear configuration. The putative path of the leading strand following extrusion from the C‐tier, to the POLE1 active site, is highlighted.
- A
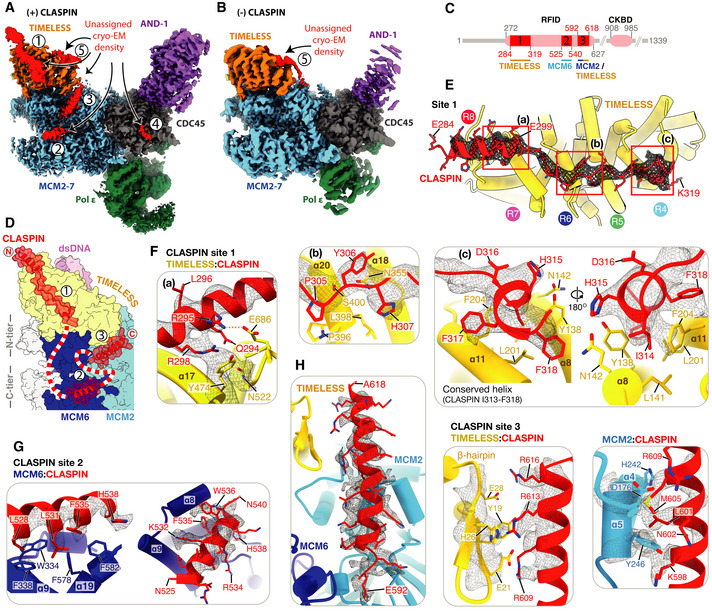
Cryo‐EM map of the complete core replisome coloured as in Fig 1C showing regions of density, labelled 1–5 (red), that remained unassigned after initial model building.
- B
Cryo‐EM map of a core replisome complex prepared in the absence of CLASPIN (Appendix Fig S3) coloured as in (A). Unassigned density 5 (red) is present in the absence of CLASPIN.
- C
Schematic for the domain architecture of CLASPIN. Pink ovals represent previously characterised functional regions with primary sequence numbering in grey. RFID: replication‐fork interaction domain, CKBD: Chk1 binding domain. Red rectangles represent regions of CLASPIN visualised in this structure, with primary sequence numbering in red and replisome components that contact each respective region labelled below.
- D
Schematic for the path of CLASPIN across one side of the replisome. Models visualised using surface rendering and coloured as in (A). CLASPIN model is displayed using surface transparent rendering with ribbon model overlaid. Red and white dashed line represents CLASPIN sequence not visualised linking sites 1–3.
- E–H
Detailed views of the contacts between CLASPIN and replisome components. Models displayed using cartoon rendering overlaid with density for selected CLASPIN residues displayed using grey mesh. (E) Overview of CLASPIN site 1. TIMELESS helical repeats are indicated by coloured circles. (F) Detailed views of interactions at CLASPIN site 1. Left, a: CLASPIN residues E284‐E299 form an α‐helix that contacts TIMELESS helical repeats 7 and 8. CLASPIN R298 contacts TIMELESS Y474 with density displayed for both residues. Centre, b: CLASPIN residues P305‐H307 sit between TIMELESS helical repeats 5 and 6. Right, c: Two views of CLASPIN residues F318‐H315 docked into a hydrophobic pocket formed between TIMELESS helices α8 and α11. (G) CLASPIN site 2. Two views of CLASPIN residues N525‐N540 binding a hydrophobic patch formed by MCM6 α9 and α19 in the MCM C‐tier. (H) CLASPIN site 3. Three views of CLASPIN residues E592‐A618 interacting with both the TIMELESS N‐terminal β‐hairpin (centre) and MCM2 α4 and α5 (right).
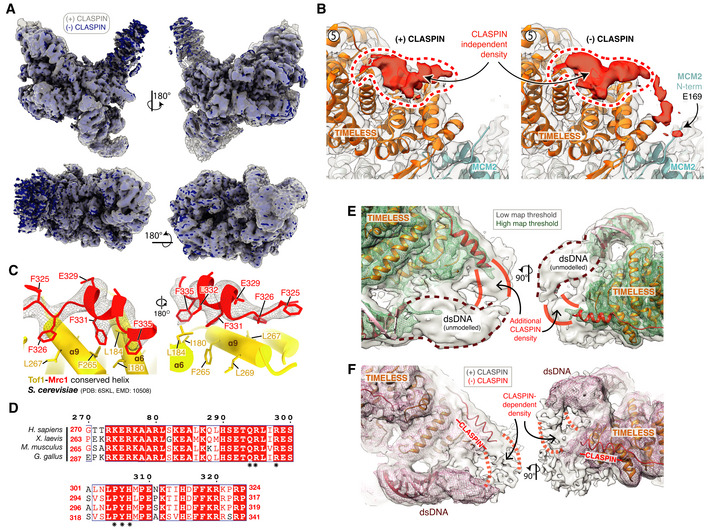
Cryo‐EM reconstruction of the core human replisome in the presence of CLASPIN (grey) rigid‐body‐docked into the cryo‐EM reconstruction in the absence of CLASPIN (blue) using UCSF Chimera (Pettersen et al, 2004) (correlation 0.8993).
Detailed view of the CLASPIN independent density that is bound to the N‐terminal end of the TIMELESS α‐solenoid. (Left) density in the presence and (right) absence of CLASPIN.
Closeup view of the interface between Mrc1 residues F335‐F325 and Tof1. The Mrc1 model was built into unmodelled density present in the S. cerevisiae replisome (PDB: 6SKL, EMD: 10508). Tof1 α6 and α9 are structurally equivalent to TIMELESS helices α8 and α11, respectively. Tof1 and Mrc1 are visualised using cartoon rendering with density assigned to Mrc1 displayed as grey mesh.
Multiple sequence alignment for H. sapiens CLASPIN residues 270–324 at CLASPIN site 1. CLASPIN residues involved in contacting the replisome are marked with an asterisk. Alignments carried out using NCBI Clustal Omega (Sievers & Higgins, 2014) and visualised using ESPrit (Robert & Gouet, 2014) with the primary sequence indicated. Uniprot ID for sequences used for CLASPIN alignment: H. sapiens (Q9HAW4‐1), M. musculus (Q80YR7‐1), G. gallus (F1P0J7‐1), X. laevis (Q9DF50‐1).
Cryo‐EM map for the core human replisome in the presence of CLASPIN at both high (green mesh) and low (grey transparent surface) thresholds, indicating the presence of density, continuous with CLASPIN site #1, projecting towards the upstream parental DNA duplex.
Cryo‐EM map of the core human replisome in the presence of CLASPIN (grey transparent surface) and absence (red mesh) both at low thresholds. Indicates that density projecting from CLASPIN‐dependent site #1 towards the unmodelled parental DNA duplex is dependent upon CLASPIN.
- A
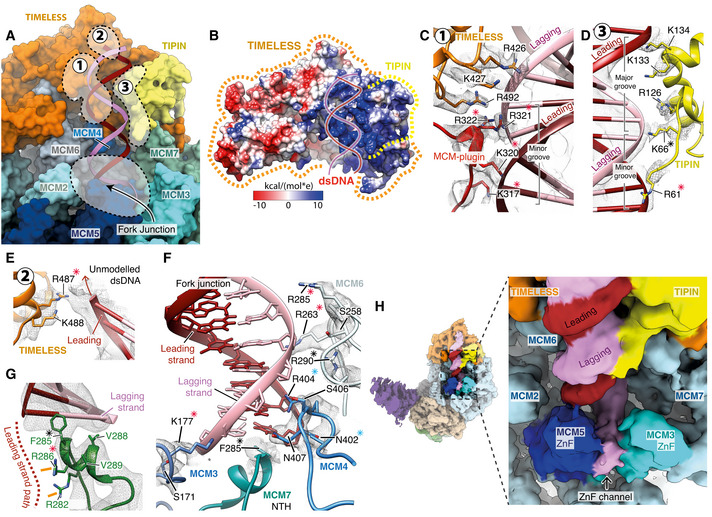
Overview of the interactions between the MCM2‐7 N‐tier and TIMELESS‐TIPIN with the parental DNA duplex and fork junction. Key regions of protein–DNA contacts are circled with dashed lines and labelled. Surface rendering of the replisome model with DNA displayed as a cartoon.
- B
Surface rendering of TIMELESS‐TIPIN coloured by Coulombic potential (see inset key) highlighting the positively charged concave groove that accommodates the parental DNA duplex. Approximate positions of TIMELESS and TIPIN indicated using dashed lines.
- C–E
Detailed views of the contacts between TIMELESS‐TIPIN and the parental DNA duplex. Cartoon model rendering with selected side chains displayed and overlaid with their corresponding cryo‐EM density in transparent mesh. Asterisks indicate conserved residues, red—charge conserved, blue—highly conserved, black—invariant. (C) A network of positively charged residues from the TIMELESS MCM‐plugin and helical repeats 6‐7 interact with the DNA backbone across the minor groove. (D) Positively charged residues extending from the TIPIN tetra‐helical HTH contact the DNA backbone, an interface that is augmented by additional DNA contacts formed by the N‐terminal DNA‐binding motif of TIPIN. (E) Positively charged residues from helical repeat 7 of TIMELESS project towards the leading strand of the parental DNA duplex.
- F, G
Detailed view of the replisome contacts with DNA at the fork junction. Asterisks indicate conserved residues, red—charge conserved, blue—highly conserved, black—invariant. (F) Contacts between MCM3,4,6 and 7 in the N‐tier and the DNA fork junction. (G) Detailed view of the MCM7 NTH positioned against the final base of dsDNA. The likely path of the leading‐strand template following unwinding is depicted by a dashed line and two arginine residues likely to coordinate it are highlighted (orange lines).
- H
(Left) Cryo‐EM map for the core human replisome coloured according to chain occupancy using a radius of 5 Å. The cryo‐EM map was obtained using a subset of data processed in CryoSPARC (Fig EV6H). (Right) Zoomed in view of the fork junction displaying continuous density extending from the lagging‐strand template at the point of strand separation out through the MCM3/5 ZnF channel. Density in the MCM3/5 ZnF channel that we attribute to the lagging‐strand template was coloured manually in UCSF Chimera.
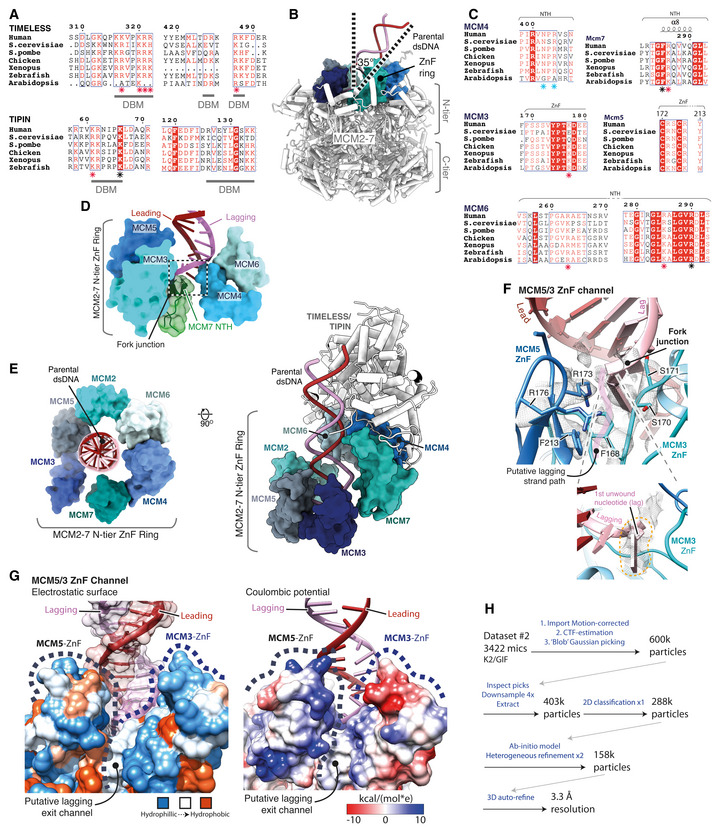
Multiple sequence alignment for regions in TIMELESS (top) and TIPIN (bottom) involved in DNA binding. Specific residues seen to be interacting with dsDNA in the structure are demarcated as part of a DNA‐binding motif (DBM). Level of conservation for residues contacting dsDNA indicated with a coloured asterisk, red—charge, blue—highly, black—invariant. All alignments in the figure were carried out using NCBI Clustal Omega and visualised using ESPrit with the primary human sequence indicated. Uniprot ID for sequences used for TIMELESS alignment: H. sapiens (Q9UNS1‐1), S. cerevisiae (P53840‐1), S. pombe (Q9UUM2‐1), G. gallus (A0A3Q2UKM8‐1), X. laevis (Q3LGB9‐1), D. rerio (E7FGL0‐1), A. thaliana (A0A1P8B9S9‐1). TIPIN alignment: H. sapiens (Q9BVW5‐1), S. cerevisiae (Q04659‐1), S. pombe (O14350‐1), G. gallus (Q5F416‐1), X. laevis (Q0IHI4‐1), D. rerio (Q6DBR4‐1).
Side‐on view of the MCM2‐7 complex, displayed using pipes and planks, illustrating the angle of the parental dsDNA as it enters the N‐tier. The ring of ZnF domains that encircle the incoming duplex is rendered as an opaque surface.
Multiple sequence alignment for the regions of MCM4, 6, 3, 5, 7 contacting the DNA at the fork junction as shown in (A). Level of conservation for residues contacting DNA at the fork junction indicated with a coloured asterisk, red—charge, blue—highly, black—invariant. Uniprot ID for sequences used for the MCM5 alignment is as described in Fig EV4H. Uniprot IDs used for MCM4 alignment: H. sapiens (P33991‐1), S. cerevisiae (P30665‐1), S. pombe (P29458‐1), G. gallus (E1C2U4‐1), X. laevis (P30664‐1), D. rerio (Q6NZV2‐1), A. thaliana (Q0WVF5‐1). MCM6 alignment: H. sapiens (Q14566‐1), S. cerevisiae (P53091‐1), S. pombe (P49731‐1), G. gallus (Q5ZKR8‐1), X. laevis (Q5FWY4‐1), D. rerio (A0A0E4AYA7‐1), A. thaliana (F4KAB8‐1). MCM7 alignment: H. sapiens (P33993‐1), S. cerevisiae (P38132‐1), S. pombe (O75001‐1), X. laevis (Q91876‐1), D. rerio (Q7ZVL6‐1), A. thaliana (P43299‐1). MCM3 alignment: H. sapiens (P25205‐1), S. cerevisiae (P24279‐1), S. pombe (P30666‐1), X. laevis (P49739‐1), D. rerio (A0A0E4AY38‐1), A. thaliana (Q9FL33‐1).
MCM2‐7 N‐tier loops contacting the dsDNA at the fork junction. Model rendered as an opaque surface, with the MCM2‐7 NTH also displayed as a cartoon with transparent surface rendering.
Two views of the MCM2‐7 N‐tier secondary ZnF domain ring, which encircles the incoming parental dsDNA duplex. The ZnF models are displayed using opaque surface rendering with TIMELESS‐TIPIN and dsDNA visualised as a cartoon using pipes and planks rendering.
Detailed view of the putative lagging‐strand exit channel between the MCM3 and MCM5 ZnF’s (Top). Model visualised using cartoon rendering with selected side chains displayed and their corresponding cryo‐EM density represented as a transparent mesh. Focussed view highlighting the first lagging‐strand nucleotide following strand separation and its corresponding cryo‐EM density (Bottom).
MCM5/3 ZnF channel displayed using surface rendering, coloured according to electrostatic potential (left) and Coulombic potential (right) (Pettersen et al, 2004) according to their respective inset keys.
Schematic pipeline diagram describing the processing of 3422 micrographs from cryo‐EM collection #1 in the presence of CLASPIN using CryoSPARC (Punjani et al, 2017). This processing resulted in a reconstruction in which density was identified between the MCM5 and MCM3 ZnF’s that is continuous with the lagging strand at the fork junction.
References
-
- Bellelli R, Boulton SJ (2021) Spotlight on the replisome: aetiology of DNA replication‐associated genetic diseases. Trends Genet 37: 317–336 - PubMed
Publication types
MeSH terms
Substances
Associated data
- Actions
Grants and funding
LinkOut - more resources
Full Text Sources
Molecular Biology Databases
Miscellaneous
