. 2021 Nov 30;144(22):1777-1794.
doi: 10.1161/CIRCULATIONAHA.121.055313. Epub 2021 Oct 25.

Cardiovascular Progerin Suppression and Lamin A Restoration Rescue Hutchinson-Gilford Progeria Syndrome

Affiliations

Cardiovascular Progerin Suppression and Lamin A Restoration Rescue Hutchinson-Gilford Progeria Syndrome

Amanda Sánchez-López et al. Circulation. .

Abstract

Background: Hutchinson-Gilford progeria syndrome (HGPS) is a rare disorder characterized by premature aging and death mainly because of myocardial infarction, stroke, or heart failure. The disease is provoked by progerin, a variant of lamin A expressed in most differentiated cells. Patients look healthy at birth, and symptoms typically emerge in the first or second year of life. Assessing the reversibility of progerin-induced damage and the relative contribution of specific cell types is critical to determining the potential benefits of late treatment and to developing new therapies.

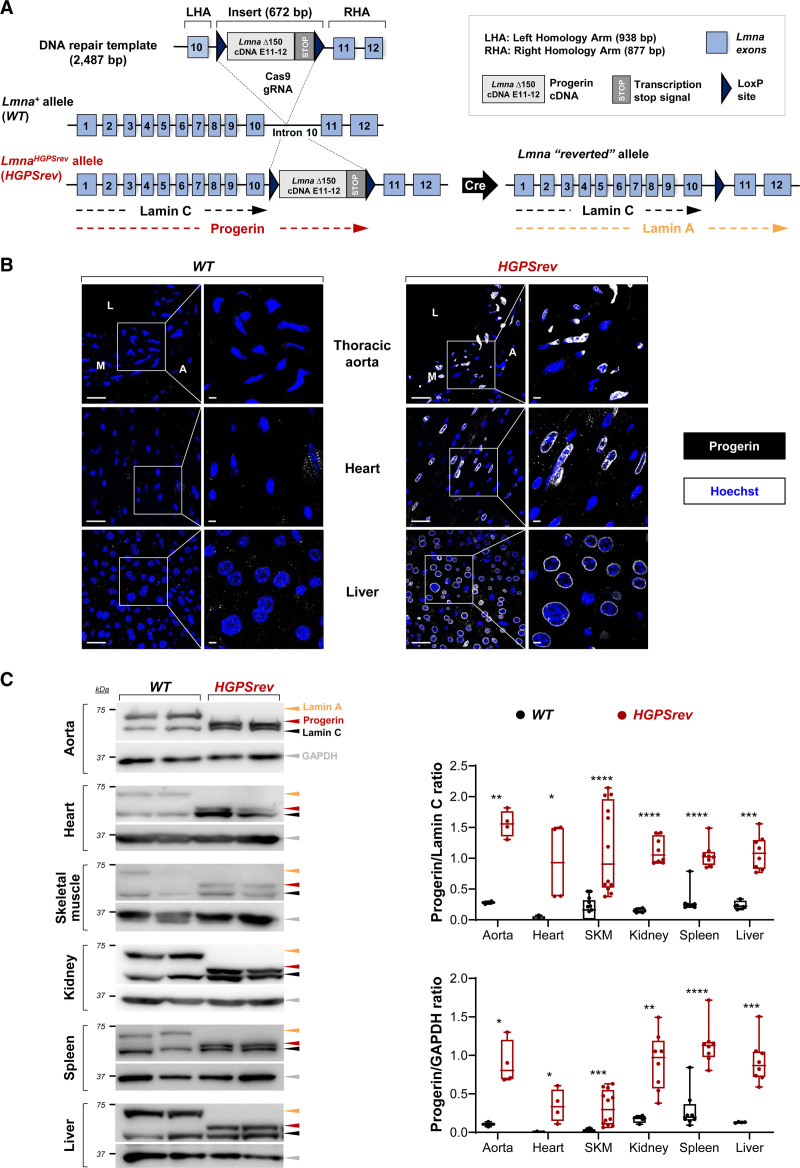
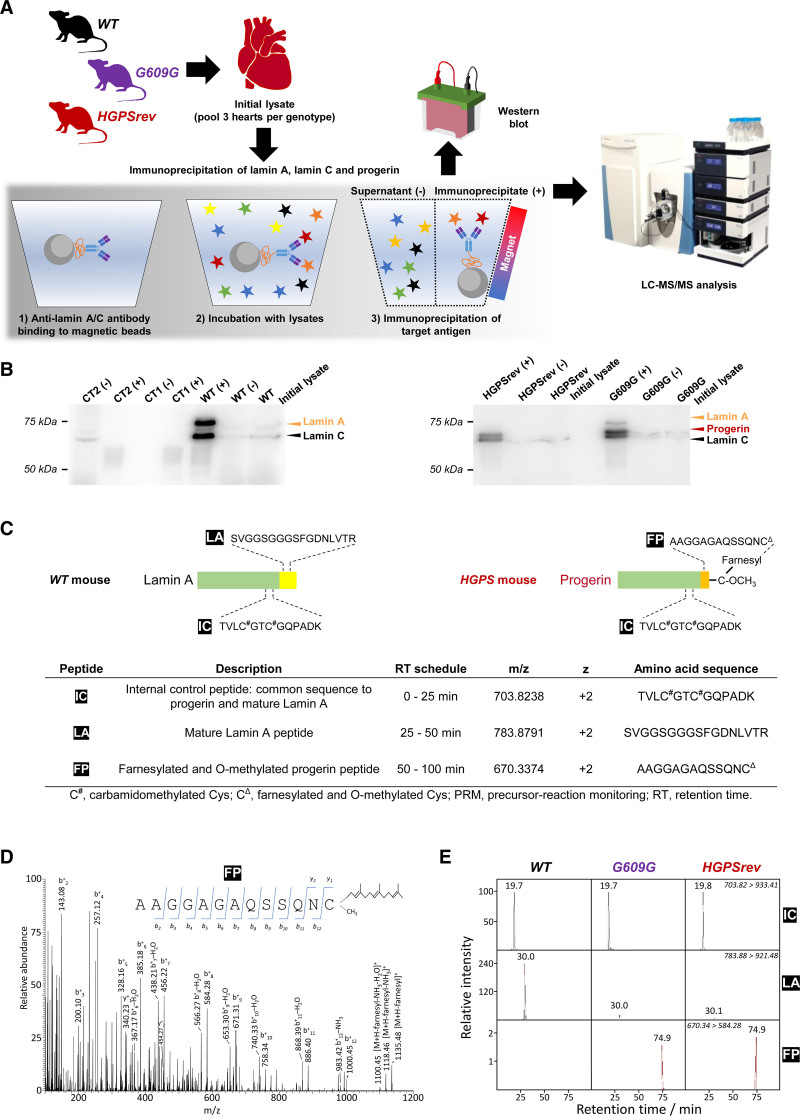
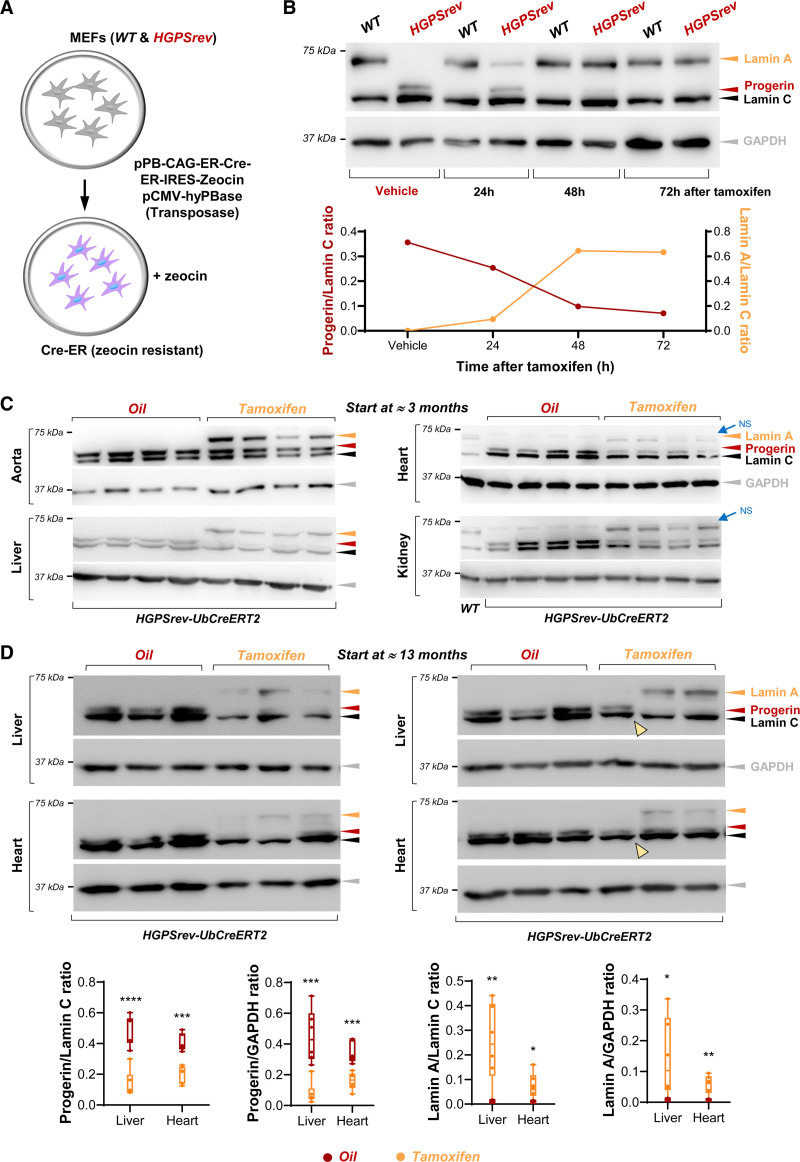
Methods: We used CRISPR-Cas9 technology to generate LmnaHGPSrev/HGPSrev (HGPSrev) mice engineered to ubiquitously express progerin while lacking lamin A and allowing progerin suppression and lamin A restoration in a time- and cell type-specific manner on Cre recombinase activation. We characterized the phenotype of HGPSrev mice and crossed them with Cre transgenic lines to assess the effects of suppressing progerin and restoring lamin A ubiquitously at different disease stages as well as specifically in vascular smooth muscle cells and cardiomyocytes.

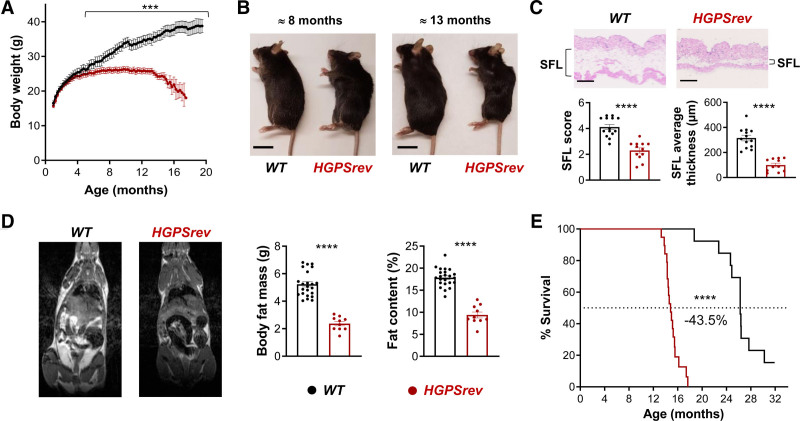
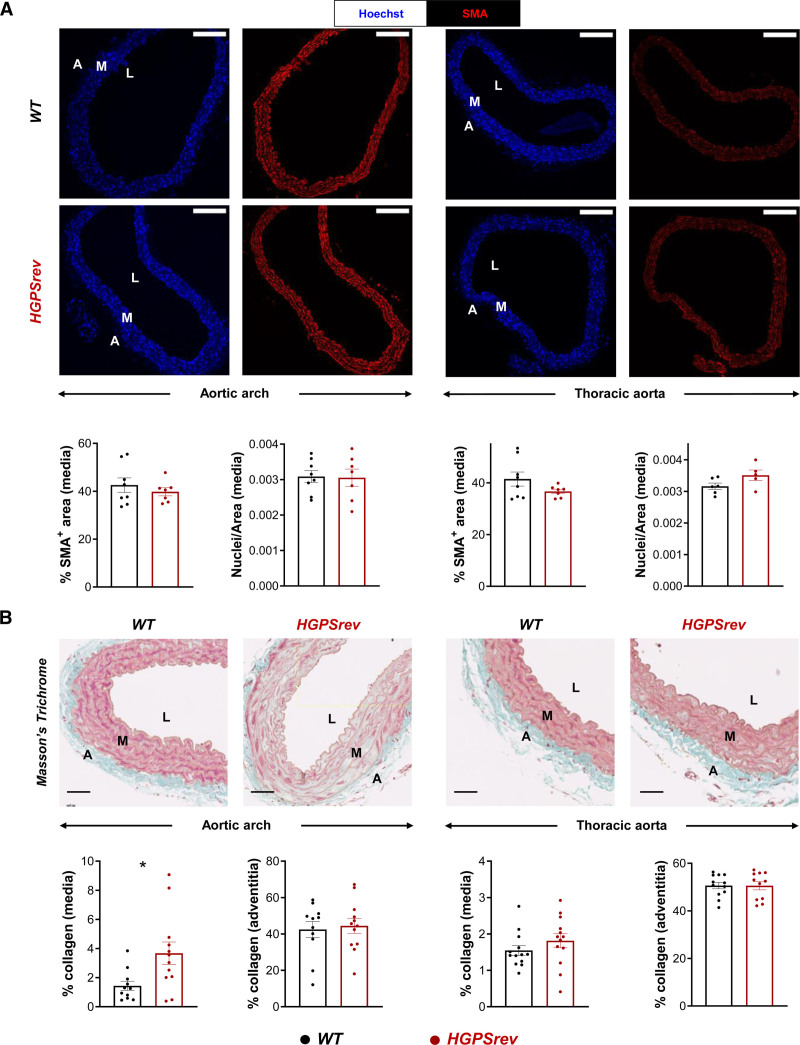
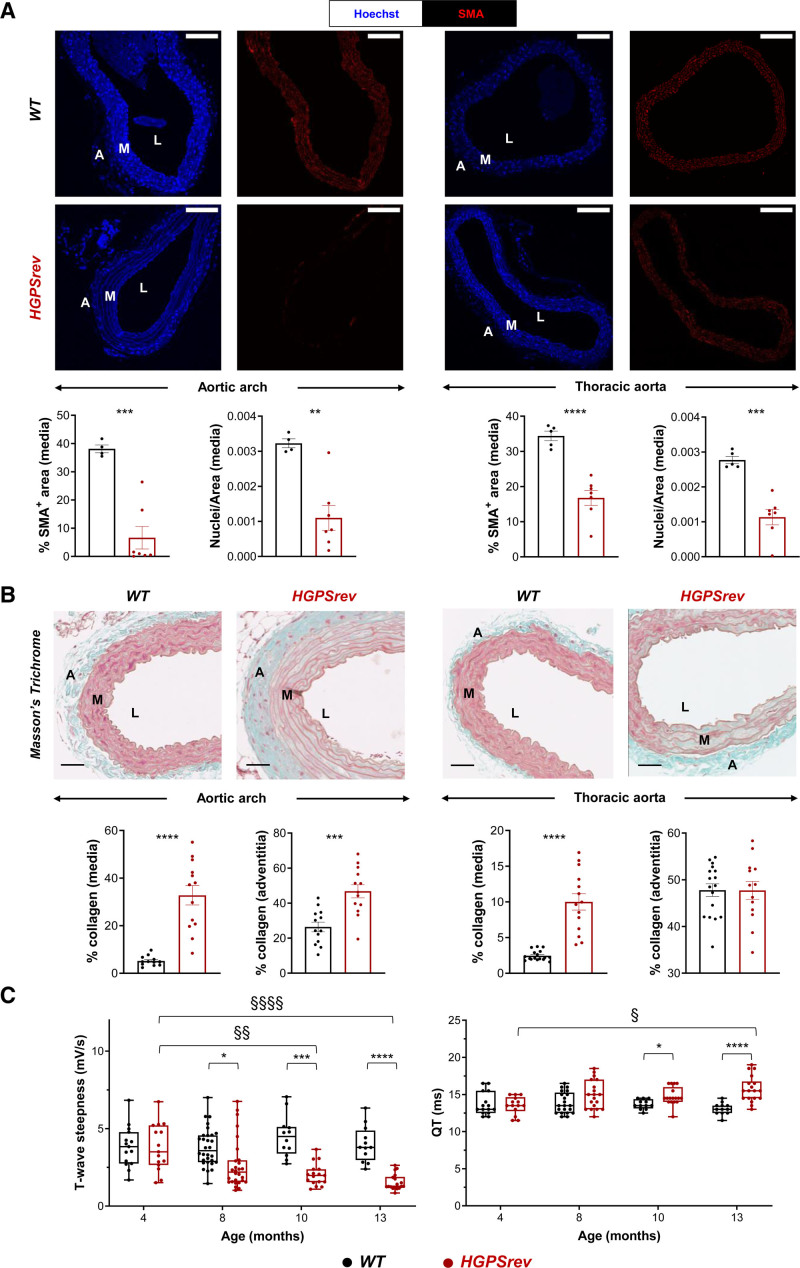
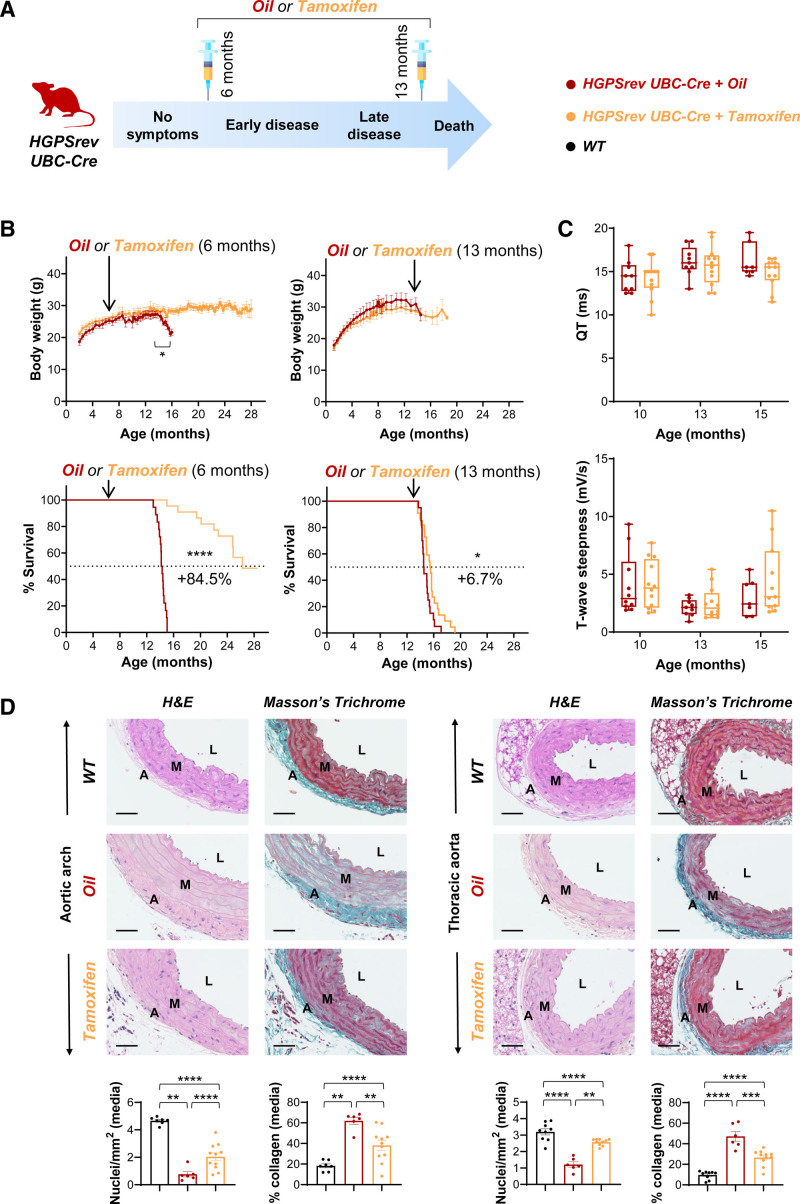
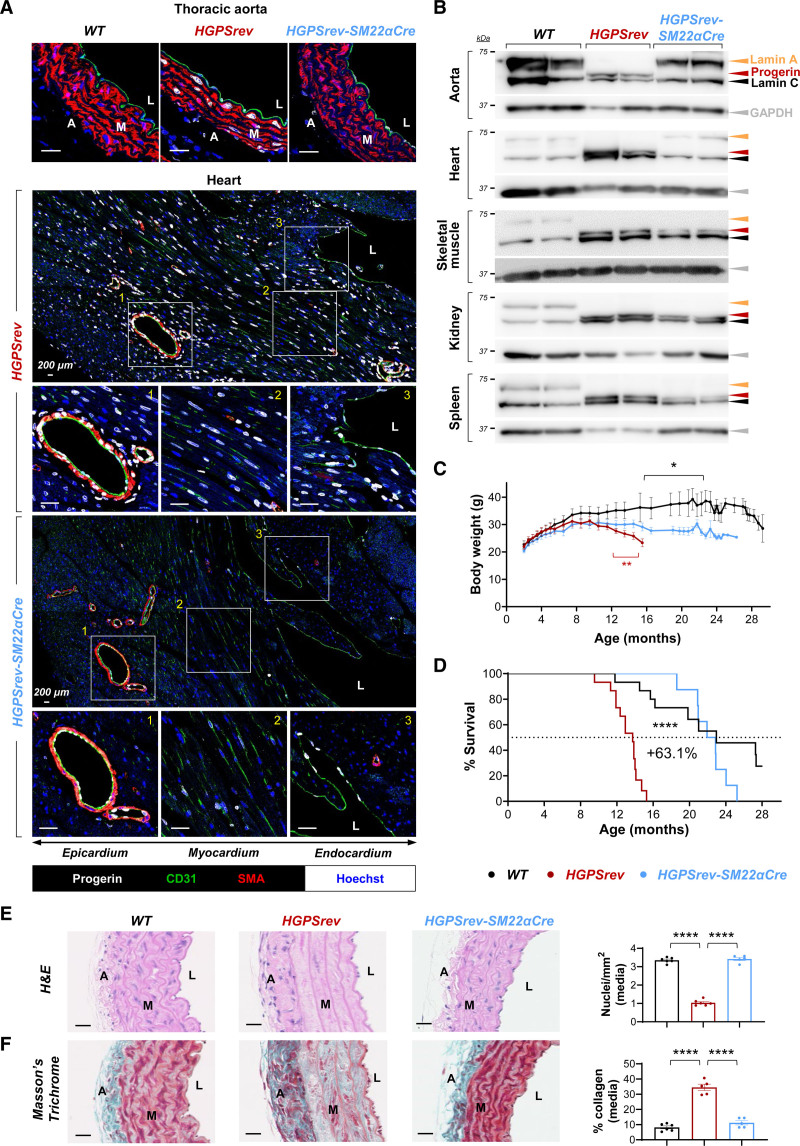
Results: Like patients with HGPS, HGPSrev mice appear healthy at birth and progressively develop HGPS symptoms, including failure to thrive, lipodystrophy, vascular smooth muscle cell loss, vascular fibrosis, electrocardiographic anomalies, and precocious death (median lifespan of 15 months versus 26 months in wild-type controls, P<0.0001). Ubiquitous progerin suppression and lamin A restoration significantly extended lifespan when induced in 6-month-old mildly symptomatic mice and even in severely ill animals aged 13 months, although the benefit was much more pronounced on early intervention (84.5% lifespan extension in mildly symptomatic mice, P<0.0001, and 6.7% in severely ill mice, P<0.01). It is remarkable that major vascular alterations were prevented and lifespan normalized in HGPSrev mice when progerin suppression and lamin A restoration were restricted to vascular smooth muscle cells and cardiomyocytes.

Conclusions: HGPSrev mice constitute a new experimental model for advancing knowledge of HGPS. Our findings suggest that it is never too late to treat HGPS, although benefit is much more pronounced when progerin is targeted in mice with mild symptoms. Despite the broad expression pattern of progerin and its deleterious effects in many organs, restricting its suppression to vascular smooth muscle cells and cardiomyocytes is sufficient to prevent vascular disease and normalize lifespan.

Keywords: Hutchinson-Gilford progeria syndrome; cardiac myocyte; cell; smooth muscle.


Figures

Figure 1.
Figure 1.
LmnaHGPSrev/HGPSrev (HGPSrev) mice exhibit ubiquitous progerin expression and undetectable lamin A expression. A, CRISPR-Cas9 strategy for generating HGPSrev mice (see details in Methods and Figure S1A). Cre activity generates a Lmna “reverted” allele that causes progerin suppression and lamin A restoration. B, Representative immunofluorescence images showing progerin expression (white) and nuclei (blue) in wild-type (WT) and HGPSrev mice. Scale bar, 25 µm. C, Western blot of lamin A/C, progerin, and GAPDH in 2-month-old WT and HGPSrev mice. Six mice of each genotype were analyzed, and representative images are shown of 2 mice of each genotype. The graphs show the relative amount of progerin normalized using lamin C and GAPDH as controls. (n=3–13 WT mice; n=4–12 HGPSrev mice). Statistical analysis was performed by 2-tailed t test. *P<0.05; **P<0.01; ***P<0.001; ****P<0.0001. A indicates adventitia; L, lumen; M, media; and SKM, skeletal muscle.
Figure 2.
Figure 2.
Targeted precursor-reaction monitoring (PRM) analysis to examine progerin farnesylation in mouse heart lysates. A, Workflow for the LC-MS/MS analysis of proteins extracted from mouse hearts and immunoprecipitated with anti-lamin A/C antibodies that recognize lamin A, lamin C, and progerin. For each genotype, each sample was the pool of 3 hearts. WT, wild-type mice; G609G, LmnaG609G/G609G mice; HGPSrev, LmnaHGPSrev/HGPSrev mice. B, Western blots using anti-lamin A/C antibody to check the enrichment of lamin A, lamin C, and progerin in the immunoprecipitated material and supernatant (+, immunoprecipitated; –, supernatant). Controls included samples containing only beads and antibody (CT1) and only beads and protein extract (CT2). A 10-µL aliquot of each sample was loaded onto the gel; see details in Supplemental Material. C, Surrogate peptides used to detect mature lamin A and progerin: IC, internal control peptide (present in both lamin A and progerin); LA, lamin A peptide (specific for lamin A); FP, farnesylated progerin peptide (specific for progerin). D, MS2 fragmentation spectrum from FP obtained in the PRM assay. The insert shows ion ascription to the main fragment-ion series (C-terminal y-series and N-terminal b-series). E, MS/MS (tandem mass spectrometry) extracted ion chromatograms of IC, LA, and FP peptides obtained from the time-scheduled PRM assay for the detection of lamin A and progerin. The ion traces were obtained using fragment ion y+9 from IC, y+8 from LA, and b+8 from FP. LC-MS/MS indicates liquid chromatography coupled to targeted tandem mass spectrometry.
Figure 3.
Figure 3.
Progeroid phenotype in LmnaHGPSrev/HGPSrev (HGPSrev) mice with ubiquitous progerin expression. A, Postnatal body weight curves (n=14 WT; n=22 HGPSrev). Differences were analyzed by unpaired multiple t-tests and the Holm-Sidák correction. B, Representative images of ≈8- and ≈13-month-old mice. Scale bar, 2 cm. C, Representative images of hematoxylin-eosin–stained skin from ≈13-month-old mice and the results of subcutaneous fat layer (SFL) score and thickness quantification (see Methods; n=13 or 14 WT; n=11 or 12 HGPSrev). Statistical analysis was performed by 2-tailed t test. Scale bar, 500 µm. D, Representative images of sagittal whole-body cross-sections obtained by magnetic resonance imaging (fat shown in white) and quantification of body fat mass and percentage fat content in ≈13-month-old mice (n=23 WT; n=10 HGPSrev). Differences were analyzed by 2-tailed t test. E, Kaplan-Meier survival curve (n=13 WT; n=22 HGPSrev). Differences were analyzed by the Mantel-Cox test. ***P<0.001; ****P<0.0001. Data are mean±SEM. Each symbol represents 1 animal.
Figure 4.
Figure 4.
Vascular smooth muscle cell (VSMC) content and collagen deposition in the aortas of ≈8-month-old HGPSrev mice. A, Representative immunofluorescence of cross-sections of aortic arch (left) and thoracic aorta (right) stained with anti–smooth muscle α-actin (SMA) antibody (red) and Hoechst 33342 (blue) to visualize vascular smooth muscle cells (VSMCs) and nuclei, respectively. Graphs show quantification of VSMC content in the media as either the percentage of SMA-positive area or nuclear density (n=6–8 WT; n=5–7 HGPSrev). Scale bar, 150 µm. B, Representative images and quantification of Masson’s trichrome staining to visualize medial and adventitial collagen content in cross-sections of aortic arch (left) and thoracic aorta (right; n=11–13 WT; n=11–13 HGPSrev). Scale bar, 50 µm. Data are mean±SEM. Each symbol represents 1 animal. Statistical analysis was performed by 2-tailed t test (*P<0.05). A indicates adventitia; L, lumen; and M, media.
Figure 5.
Figure 5.
Cardiovascular abnormalities in ≈13-month-old HGPSrev mice. A, Representative immunofluorescence images of aortic arch (left) and thoracic aorta (right). Specimens were costained with anti–smooth muscle α-actin (SMA) antibody (red) and Hoechst 33342 (blue) to visualize vascular smooth muscle cells (VSMCs) and nuclei, respectively. Graphs show quantification of VSMC content in the media as either the percentage of SMA-positive area or nuclear density (n=4 or 5 WT; n=7 HGPSrev). Scale bar, 150 µm. Data are mean±SEM. Statistical analysis was performed by 2-tailed t test (**P<0.01; ***P<0.001; ****P<0.0001). B, Representative images and quantification of Masson’s trichrome staining to visualize medial and adventitial collagen content in aortic arch (left) and thoracic aorta (right) of ≈13-month-old mice (n=13–17 WT; n=13 or 14 HGPSrev). Scale bar, 50 µm. Data are mean±SEM. Statistical analysis was performed by 2-tailed t test (***P<0.001; ****P<0.0001). C, Longitudinal ECG assessment (n=12–23 WT; n=14–19 HGPSrev). Data are median with interquartile range ± minima and maxima. Differences were analyzed by mixed-effects analysis using the Geisser-Greenhouse correction and Sidák’s multiple comparisons test. Differences over time within each genotype: §P<0.05; §§P<0.01; §§§§P<0.0001. Differences between genotypes at each time point: *P<0.05; ***P<0.001; ****P<0.0001. Each symbol represents 1 animal. A indicates adventitia; M, media; and L, lumen.
Figure 6.
Figure 6.
In vitro and in vivo tamoxifen-induced Cre-dependent progerin suppression and lamin A restoration. A, Wild-type (WT) and HGPSrev mouse embryonic fibroblasts (MEFs) were cotransfected with plasmids to confer resistance to zeocin and express a tamoxifen-inducible Cre recombinase. B, Zeocin-resistant MEFs were analyzed by Western blot to examine lamin A/C, progerin, and GAPDH expression. Equal volumes of ethanol or tamoxifen (25 nmol/L final concentration) were added to the cells as indicated. The graph shows the relative amount of progerin and lamin A in HGPSrev MEFs (normalized to lamin C content). C and D, Western blot analysis of tissues of LmnaHGPSrev/HGPSrev Ubc-CreERT2-tg/+ mice that received vehicle (oil) or tamoxifen beginning at the age of ≈3 months (C, n=4 each group) and ≈13 months (D, n=6 each group). Mice in C were euthanized 1 week after oil or tamoxifen administration, and mice in D when they met human end point criteria. Yellow arrowheads in D indicate 1 animal in which tamoxifen administration did not suppress progerin or induce lamin A and that died 2 days after the end of tamoxifen administration (see Figure 7B, bottom right). Quantification of the relative amounts of lamin A and progerin in the blots in C is shown in Figure S5). The graphs in D show the relative amount of progerin and lamin A normalized to lamin C and GAPDH content. Statistical analysis to compare genotypes was performed by 2-tailed t test. *P<0.05; **P<0.01; ***P<0.001; ****P<0.0001. Each symbol represents 1 animal. NS indicates nonspecific band.
Figure 7.
Figure 7.
Ubiquitous progerin suppression and lamin A restoration extends lifespan in both mildly and severely symptomatic HGPSrev-Ubc-CreERT2 mice. A, Experimental protocol for studies with HGPSrev-Ubc-CreERT2 mice, showing the age at which oil or tamoxifen administration started (details in the Table). B, Oil or tamoxifen were administered at ≈6 months (left: n=18 oil and n=22 tamoxifen) or ≈13 months (right: n=7–20 oil and n=9–23 tamoxifen). The graphs show the results from 2 independent experiments. Differences were analyzed by unpaired multiple t tests and the Holm-Sidák correction in body weight studies and by the Mantel-Cox test in Kaplan-Meier survival curves. C, Oil or tamoxifen was administered at ≈9 months of age, and electrocardiography was performed at the indicated ages (n=7–10 oil; n=11 or 12 tamoxifen). Data are medians with interquartile range ± minima and maxima. Differences were analyzed by mixed-effects analysis with the Geisser-Greenhouse correction and Sidák’s multiple comparisons test. D, Hematoxylin-eosin (H&E) and Masson’s trichrome staining of aortic cross-sections from mice receiving oil/tamoxifen at ≈9 months and euthanized at 14.5 months of age (n=5 or 6 oil; n=11 tamoxifen). A group of age-matched untreated wild-type (WT) mice was included for comparison (n=7–9). Scale bar, 50 µm. Data are mean±SEM. Differences were analyzed by 1-way ANOVA and the post hoc Tukey test. **P<0.01; ***P<0.001; ****P<0.0001. Each symbol represents 1 animal. A indicates adventitia; L, lumen; and M, media.
Figure 8.
Figure 8.
Normal vascular phenotype and lifespan in HGPSrev-SM22α-Cre mice with progerin suppression and lamin A restoration restricted to vascular smooth muscle cells (VSMCs) and cardiomyocytes. A, Representative immunofluorescence images of thoracic aorta and hearts of ≈13-month-old mice. Cross-sections were costained with antibodies against CD31 (green), smooth muscle α-actin (SMA; red) and progerin (white) and with Hoechst 33342 (blue) to visualize endothelial cells, vascular smooth muscle cells (VSMCs), progerin, and nuclei, respectively. B, Western blot of lamin A/C, progerin, and GAPDH in tissues of ≈13-month-old mice. C, Body weight curves (n=9 WT; n=13 HGPSrev; n=11 HGPSrev-SM22α-Cre). Differences were analyzed by unpaired multiple t tests and the Holm-Sídák correction. Red asterisks denote differences between HGPSrev-SM22α-Cre and HGPSrev mice. Black asterisks denote differences between HGPSrev-SM22α-Cre and WT mice. D, Kaplan-Meier survival curve (n=15 WT; n=15 HGPSrev; n=11 HGPSrev-SM22α-Cre). Median lifespan was 13.73 months in HGPSrev mice, 22.4 months in HGPSrev-SM22α-Cre mice, and 22.97 months in WT mice. Differences were analyzed with the Mantel-Cox test. E and F, Representative images of aortic arch stained with hematoxylin-eosin (H&E) and Masson’s trichrome, to quantify VSMCs and fibrosis, respectively, in ≈13-month-old WT mice (n=6), HGPSrev mice (n=5 or 6), and HGPSrev-SM22α-Cre mice (n=5). Differences were analyzed by 1-way ANOVA with the post hoc Tukey test. *P<0.05; ****P<0.0001. Each symbol represents 1 animal. Data are mean±SEM. A indicates adventitia; L, lumen; and M, media. Scale bars, 25 µm (except in the tile scans in A, where they are 200 µm).

References

    1. Dorado B, Andrés V. A-type lamins and cardiovascular disease in premature aging syndromes. Curr Opin Cell Biol. 2017;46:17–25. doi: 10.1016/j.ceb.2016.12.005 - PubMed
    1. Merideth MA, Gordon LB, Clauss S, Sachdev V, Smith ACM, Perry MB, Brewer CC, Zalewski C, Kim HJ, Solomon B, et al. . Phenotype and course of Hutchinson–Gilford progeria syndrome. New Engl J Med. 2008;358:592–604. doi: 10.1056/NEJMoa0706898 - PMC - PubMed
    1. Gordon LB, Shappell H, Massaro J, D’Agostino RB, Sr, Brazier J, Campbell SE, Kleinman ME, Kieran MW. Association of lonafarnib treatment vs no treatment with mortality rate in patients with Hutchinson-Gilford progeria syndrome. JAMA. 2018;319:1687–1695. doi: 10.1001/jama.2018.3264 - PMC - PubMed
    1. De Sandre-Giovannoli A, Bernard R, Cau P, Navarro C, Amiel J, Boccaccio I, Lyonnet S, Stewart CL, Munnich A, Le Merrer M, et al. . Lamin a truncation in Hutchinson-Gilford progeria. Science. 2003;300:2055. doi: 10.1126/science.1084125 - PubMed
    1. Eriksson M, Brown WT, Gordon LB, Glynn MW, Singer J, Scott L, Erdos MR, Robbins CM, Moses TY, Berglund P, et al. . Recurrent de novo point mutations in lamin A cause Hutchinson-Gilford progeria syndrome. Nature. 2003;423:293–298. doi: 10.1038/nature01629 - PMC - PubMed

Publication types