

The global significance of biodiversity science in China: an overview
- PMID: 34694304
- PMCID: PMC8310773
- DOI: 10.1093/nsr/nwab032
The global significance of biodiversity science in China: an overview
Abstract
Biodiversity science in China has seen rapid growth over recent decades, ranging from baseline biodiversity studies to understanding the processes behind evolution across dynamic regions such as the Qinghai-Tibetan Plateau. We review research, including species catalogues; biodiversity monitoring; the origins, distributions, maintenance and threats to biodiversity; biodiversity-related ecosystem function and services; and species and ecosystems' responses to global change. Next, we identify priority topics and offer suggestions and priorities for future biodiversity research in China. These priorities include (i) the ecology and biogeography of the Qinghai-Tibetan Plateau and surrounding mountains, and that of subtropical and tropical forests across China; (ii) marine and inland aquatic biodiversity; and (iii) effective conservation and management to identify and maintain synergies between biodiversity and socio-economic development to fulfil China's vision for becoming an ecological civilization. In addition, we propose three future strategies: (i) translate advanced biodiversity science into practice for biodiversity conservation; (ii) strengthen capacity building and application of advanced technologies, including high-throughput sequencing, genomics and remote sensing; and (iii) strengthen and expand international collaborations. Based on the recent rapid progress of biodiversity research, China is well positioned to become a global leader in biodiversity research in the near future.
Keywords: biodiversity inventory; biodiversity maintenance; biodiversity monitoring; biodiversity origins; biodiversity-ecosystem functioning.
© The Author(s) 2021. Published by Oxford University Press on behalf of China Science Publishing & Media Ltd.
Figures
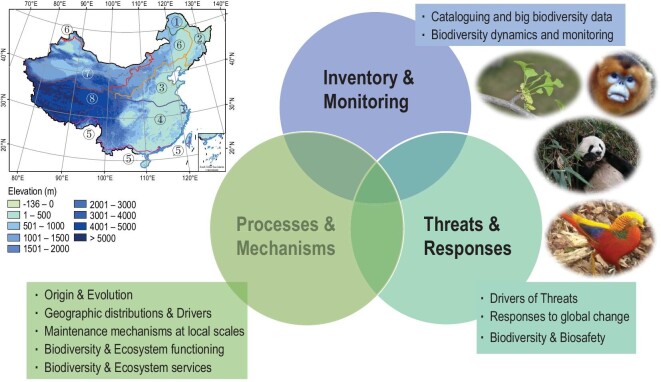
 cold-temperate deciduous needle-leaved forests;
  temperate mixed-needle and broad-leaved forests;
  warm-temperate deciduous broad-leaved forests;
  subtropical evergreen broad-leaved forests;
  tropical monsoon rain forests and rain forests;
  temperate grassland;
  temperate desert;
  Qinghai-Tibetan Plateau alpine vegetation. Digital elevational model (DEM) data at 10 arcmin spatial resolution were downloaded from WorldClim [20]. The four pictures present the iconic species Ginkgo biloba (copyright Yunpeng Zhao), Rhinopithecus roxellanae (copyright Sheng Li), Ailuropoda melanoleuca (copyright Yibo Hu) and Chrysolophus pictus (copyright Sheng Li). The map of China is from
References
-
- Lomolino MV, Riddle BR, Whittaker RJ. Biogeography: Biological Diversity Across Space and Time, 5th ed. Sunderland: Sinauer Associates Inc, 2017.
-
- Millennium Ecosystem Assessment (MA) . Ecosystems and Human Well-Being: Synthesis. Washington: Island Press, 2005.
-
- Díaz S, Settele J, Brondízio Eet al. Summary for Policymakers of the Global Assessment Report on Biodiversity and Ecosystem Services of the Intergovernmental Science-Policy Platform on Biodiversity and Ecosystem Services, 2020. http://www.ipbes.net/sites/default/files/ipbes_7_10_add.1_en_1.pdf.
LinkOut - more resources
Full Text Sources